Industrial Robotics Market Size and Share
Market Overview
| Study Period | 2020 - 2031 |
|---|---|
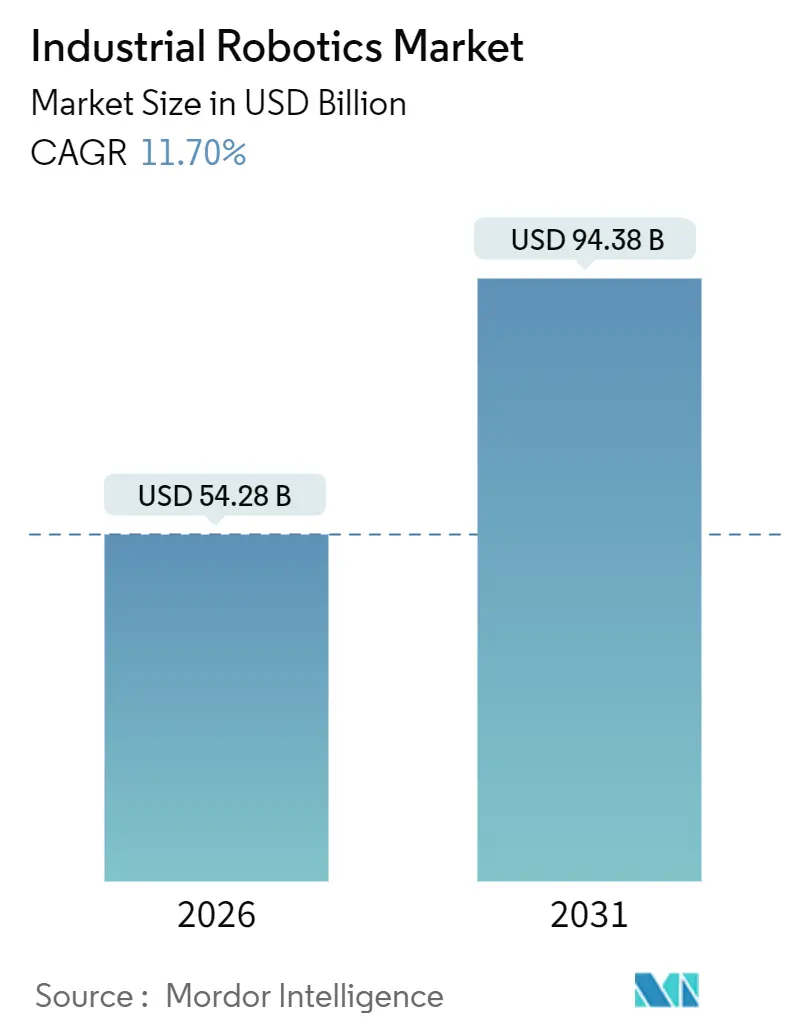
| Market Size (2026) | USD 54.28 Billion |
| Market Size (2031) | USD 94.38 Billion |
| Growth Rate (2026 - 2031) | 11.70% CAGR |
| Fastest Growing Market | Middle East |
| Largest Market | Asia Pacific |
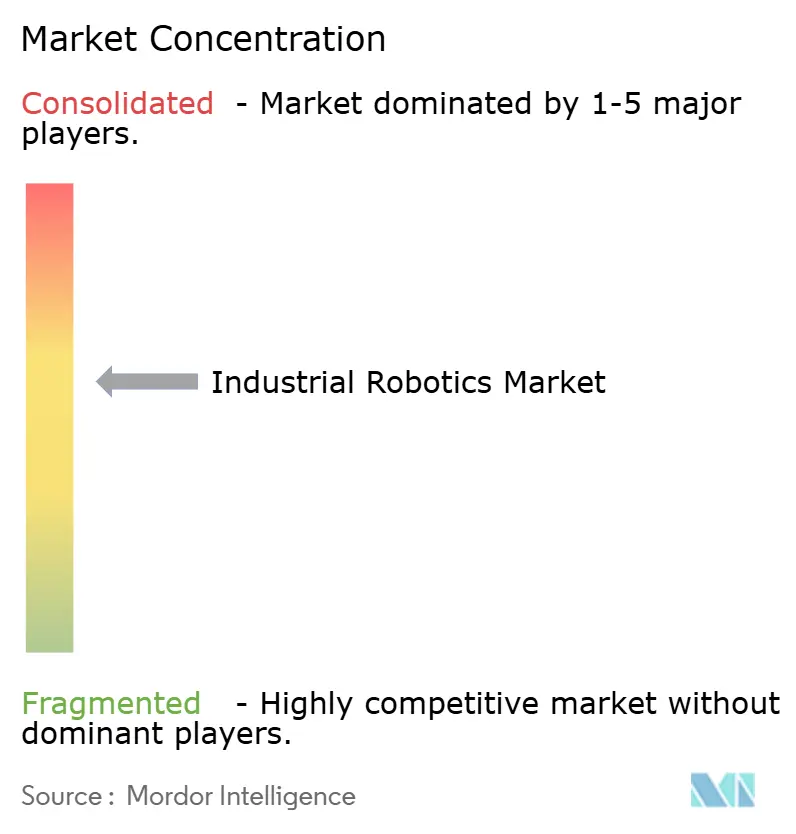
| Market Concentration | Medium |
Major Players *Disclaimer: Major Players sorted in no particular order Image © Mordor Intelligence. Reuse requires attribution under CC BY 4.0. | |
Industrial Robotics Market Analysis by Mordor Intelligence
The industrial robotics market size stands at USD 54.28 billion in 2026 and is projected to reach USD 94.38 billion by 2031, advancing at an 11.7% CAGR over the forecast period. Momentum stems from structurally higher factory wages, tighter reshoring economics, and government subsidies that collectively shorten automation payback periods. Adoption continues to broaden from the automotive core toward semiconductors, pharmaceuticals, and food processing, where robots address contamination, precision, and labor-scarcity issues. Vendors are integrating machine vision, edge analytics, and force-torque sensing to differentiate on total-cost-of-ownership rather than only payload or reach. Resurgent tariff barriers and cybersecurity mandates simultaneously raise switching costs, nudging users toward single-stack ecosystems from established suppliers.
Key Report Takeaways
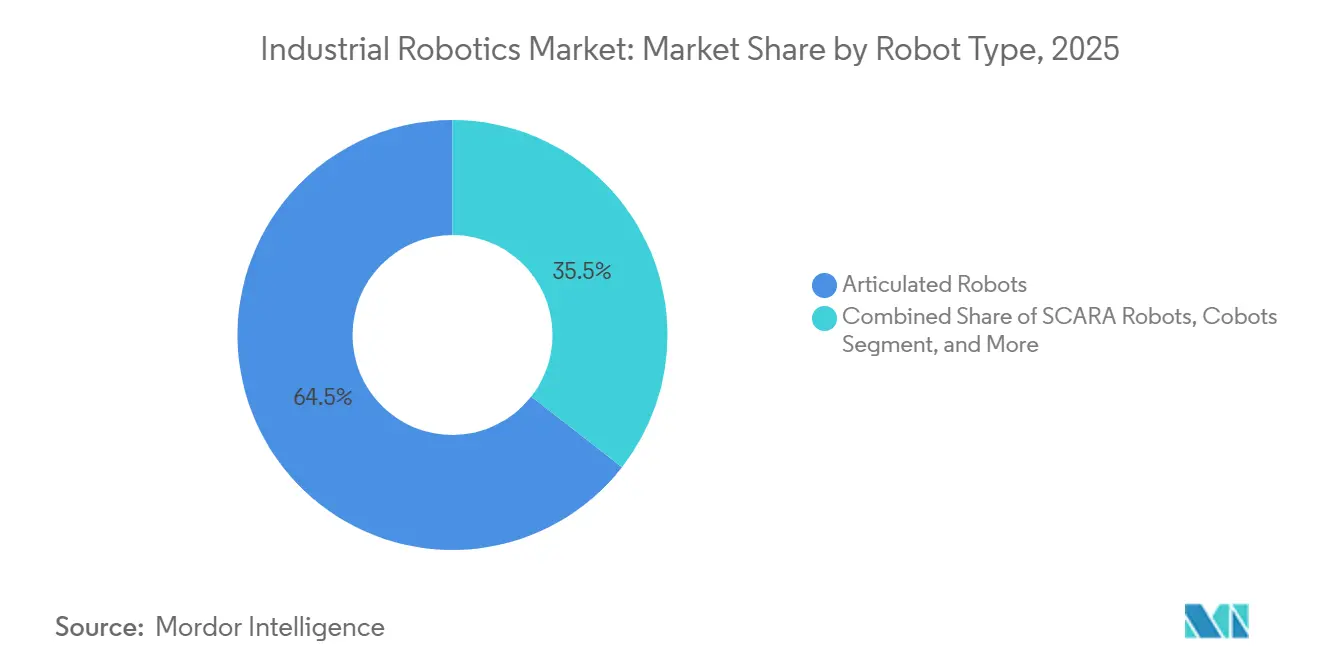
- By robot type, articulated units commanded 62.52% of industrial robotics market share in 2025, while collaborative robots post the fastest 12.92% CAGR through 2031.
- By payload capacity, the 16-225 kilogram bracket led with 49.54% of the industrial robotics market size in 2025, whereas sub-15 kilogram machines expand at a 13.72% CAGR to 2031.
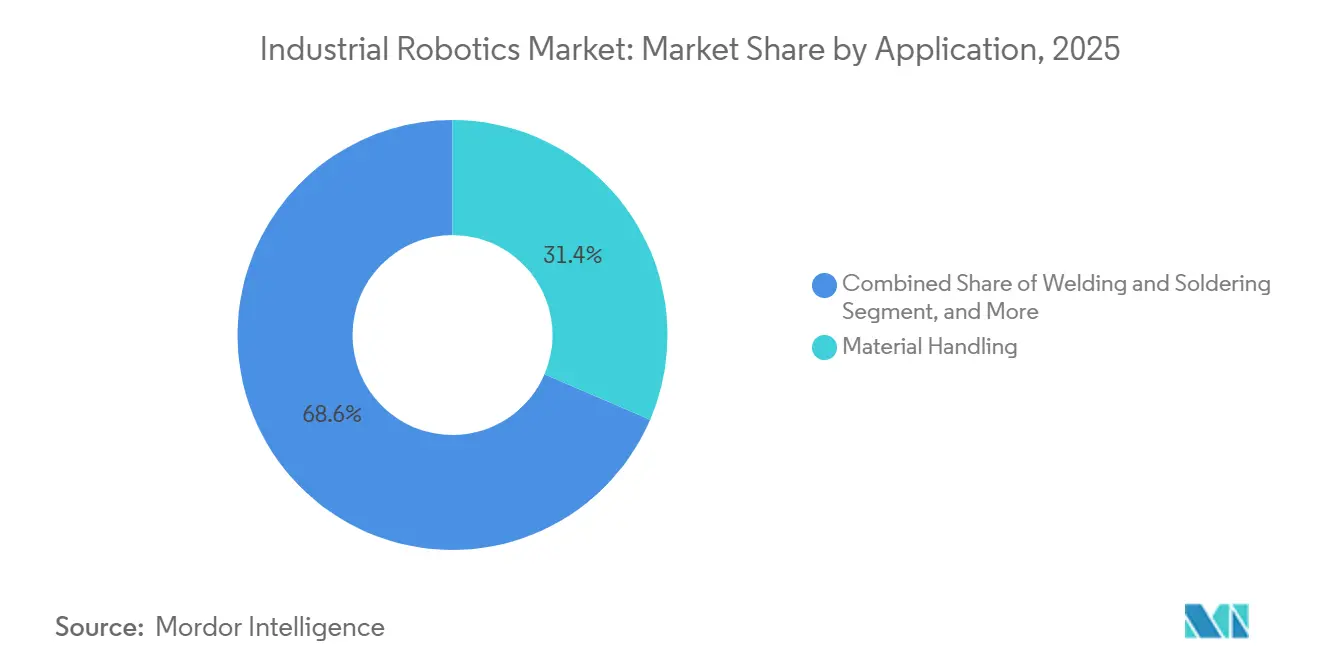
- By application, material handling and packaging captured 31.44% revenue in 2025; quality inspection is advancing at a 13.02% CAGR through 2031.
- By end-user, automotive contributed 35.86% of 2025 demand, yet pharmaceuticals and healthcare exhibit the highest 13.52% CAGR into 2031.
- By geography, Asia Pacific delivered 44.36% of 2025 revenue, while the Middle East records the strongest 12.22% CAGR forecast.
Note: Market size and forecast figures in this report are generated using Mordor Intelligence’s proprietary estimation framework, updated with the latest available data and insights as of January 2026.
Market Trends and Insights
Drivers Impact Analysis of Industrial Robotics Market*
| Driver | (~) % Impact on CAGR Forecast | Geographic Relevance | Impact Timeline |
|---|---|---|---|
| Rising Labor Costs and Ageing Workforce | +2.8% | Global, notably Japan, Germany, United States | Medium term (2-4 years) |
| Rapid Adoption of AI and IIoT-Enabled Smart Factories | +3.2% | Global, APAC and North America lead | Short term (≤ 2 years) |
| Government Cap-Ex Subsidies for Automation | +2.1% | China, South Korea, Germany | Medium term (2-4 years) |
| Tariff-Driven Reshoring Fuels U.S. Automation Spend | +1.5% | United States, Mexico, Canada | Short term (≤ 2 years) |
| ESG Push for Energy Efficient Robots | +1.2% | Europe, North America, select APAC | Long term (≥ 4 years) |
| Robot-as-a-Service Boosted by Depreciation Rules | +0.9% | United States, United Kingdom, Germany | Medium term (2-4 years) |
| Source: Mordor Intelligence | |||
Rising Labor Costs and Ageing Workforce
Manufacturing wage inflation outpaced consumer-price growth by 1.8 percentage points annually between 2020 and 2025 in OECD economies, squeezing margins for labor-intensive assembly and pushing businesses toward quick-payback automation.[1]Organisation for Economic Co-operation and Development, “Manufacturing Wage Inflation,” oecd.org Japan’s working-age population declined by 6.2 million over the same span, so tier-one automotive suppliers installed night-shift collaborative cells to offset hiring gaps. German factories reported 420,000 open skilled-trade positions in 2025, accelerating use of articulated welders that were once cost-prohibitive for mid-size shops. In the United States, a projected 2.1 million manufacturing-worker deficit by 2030 triggered federal tax credits worth 30% of qualified automation spend in designated zones. South Korea doubled subsidies for small manufacturers in 2025, covering half the robot bill when turnover exceeds 40% in key trades.
Rapid Adoption of AI and IIoT-Enabled Smart Factories
Edge processors embedded in robot controllers now execute closed-loop optimizations that lower scrap by up to 18% in automotive paint and pharma coating lines. Digital-twin simulations shorten commissioning by 28 days on average, cutting integration labor nearly one-fifth. Predictive maintenance flags bearing wear 72 hours before failure, slashing unplanned body-shop downtime by 41% at high-utilization plants. The IIC-PUB-G1 guideline standardized OPC UA for robot-to-PLC traffic, finally enabling vendor-agnostic cell orchestration. Machine-vision powered by convolutional neural networks achieved 98.4% accuracy in 2025 electronics inspection, surpassing human inspectors at six-hundred-part-per-minute line speeds.
Government Cap-Ex Subsidies for Automation
China’s Made in China 2025 program allotted CNY 180 billion (USD 25.2 billion) to robotics through 2026, reimbursing up to 40% of equipment outlays and mandating 70% local content. South Korea’s lease program now covers half the monthly robot payment for three years at firms under 300 employees. Germany’s Digital Now fund disburses EUR 500 million (USD 565 million) each year to 2027, provided new gear complies with Industrie 4.0 interoperability. The United States CHIPS and Science Act channels USD 11 billion toward semiconductor workforce and clean-room automation, spiking demand in Arizona, Ohio, and Texas fabs that ramp in 2026-2027.
Tariff-Driven Reshoring Fuels U.S. Automation Spend
Section 301 duties keep 25% tariffs on Chinese machinery imports through 2026, shrinking the offshoring cost gap to single digits for many assemblies. Announced U.S. factory investments totaled USD 47 billion during 2024-2026, most citing robotics to neutralize domestic wage premiums. Mexico attracted USD 28 billion in near-shoring pledges, where articulated units satisfy USMCA content rules yet retain labor savings. General Motors scheduled 1,200 additional robots for battery-module lines in Michigan and Tennessee as part of its tariff-mitigation strategy. Canada’s Strategic Innovation Fund committed CAD 2.1 billion (USD 1.55 billion) in 2025, prioritizing collaborative robot deployments in battery and chip facilities.
Restraints Impact Analysis of Industrial Robotics Market*
| Restraint | (~) % Impact on CAGR Forecast | Geographic Relevance | Impact Timeline |
|---|---|---|---|
| High Upfront Cap-Ex for SMEs | -1.8% | Global, acute South America, Africa, parts of Asia | Short term (≤ 2 years) |
| Scarcity of Robot-Integration Talent | -1.4% | Global, most severe North America, Europe | Medium term (2-4 years) |
| Cyber-Security Liabilities in Connected Cells | -0.9% | Global, regulatory pressure highest in Europe | Short term (≤ 2 years) |
| Rare-Earth Servo-Motor Supply Volatility | -1.1% | Global, non-China suppliers exposed | Medium term (2-4 years) |
| Source: Mordor Intelligence | |||
High Upfront Cap-Ex for SMEs
A full six-axis cell, including guarding and end-of-arm tools, costs USD 180,000-320,000, absorbing up to 70% of annual capital budgets at firms below USD 15 million revenue. Robot-as-a-Service leases cut the entry ticket, yet USD 1,800-3,200 monthly still tops single-shift labor in Mexico, Vietnam, and India. EIB data show 62% of SME automation-loan proposals were denied in 2025 for collateral shortfalls, bottlenecking uptake in Europe.[2] European Investment Bank, “SME Lending and Automation Finance,” eib.org Although accelerated depreciation permits year-one expensing in the United States and Germany, cash-flow limits persist for companies with margins under 15% EBITDA. Cobots priced at USD 35,000-50,000 help, but 10-15 kilogram payloads exclude heavy welding and metal forming.
Scarcity of Robot-Integration Talent
Open industrial-machinery mechanic vacancies reached 87,000 in the United States during 2025, with median time-to-fill above 90 days. Germany’s VDMA noted that 34% of planned 2025 projects slipped three months or more due to integrator shortages, especially for multi-vendor cells. Certified integrators bill USD 150-240 per hour in North America and Western Europe, adding USD 40,000-80,000 to a typical installation. Free online academies launched by Universal Robots and FANUC still see sub-18% completion because trainees lack test hardware. Meeting ISO 9283 and ISO/TS 15066 validation further requires costly metrology that many SMEs must outsource.[3]International Organization for Standardization, “ISO/TS 15066,” iso.org
*Our forecasts treat driver/restraint impacts as directional, not additive. The impact forecasts reflect baseline growth, mix effects, and variable interactions.
Industrial Robotics Market Segment Analysis
By Robot Type:
Cobots Challenge Articulated DominanceArticulated units retained 62.52% industrial robotics market share in 2025, reflecting their versatility across welding, painting, and palletizing. Their dominance holds in automotive and machinery, yet collaborative robots outpace with a 12.92% CAGR through 2031 as factories favor human-friendly cells that redeploy without fencing. Cobot deployments rose in late pick-and-place and small-batch assembly, where quick reprogramming trims changeovers under 20 minutes. Cartesian and gantry machines remain important for oversized aerospace panels and windshield installation, while SCARA and delta variants protect niches in electronics and food sorting through sub-0.4-second cycles. Cylindrical units keep a shrinking foothold in legacy machine tending because articulated models now match reach at similar prices.
ABB’s GoFa combines 12-kilogram payloads with 2.2 m/second speed, overlapping mid-reach articulated performance. Yaskawa’s HC series embeds vision and force sensors that previously required third-party kits. As ISO/TS 15066 caps contact force, software plays an outsized role, distinguishing vendors that can tune dynamic joint limits for simultaneous safety and throughput. Over the forecast, cobots are expected to infiltrate 35% of green-field cells, especially in electronics final assembly and medical-device kitting where daily product mixes oscillate sharply. Meanwhile, articulated stalwarts continue to rule heavy welding and paint booths due to payload and explosion-proof requirements.


By Payload Capacity:
Lightweight Robots Gain TractionMid-range 16-225 kilogram machines represented 49.54% of 2025 shipments, owing to ubiquitous automotive body-in-white tasks. Nevertheless, sub-15 kilogram designs log a 13.72% CAGR to 2031, translating miniaturized servo drives into slender arms fit for cramped electronics and pharma lines. Collaborative models dominate this weight class, capturing 68% of units as ISO/TS 15066 permits uncaged operation when forces stay under 150 newtons. Demand accelerates with smartphone and wearable volumes, in which ±0.01 millimeter repeatability is mandatory. The 226-500 kilogram band serves chassis lifting and aerospace tooling; above 500 kilograms, robots remain niche yet indispensable for press tending and wind-blade handling where loads exceed one metric ton.
Electronics assembly generated 58% of lightweight demand in 2025, driven by sub-1-second placement cycles. Pharmaceutical vial handling specifies stainless-steel variants in the 5-10 kilogram range to meet ISO 14644 class 5 clean-room rules. Battery-module lines adopt 50-100 kilogram robots capable of 0.05 millimeter bolt-tightening to avert thermal runaway risks. Food processors prefer delta arms under 3 kilograms for 200-plus picks per minute, leveraging IP65 casings against washdown chemicals. Heavy-duty arms above 500 kilograms are expected to lose share as integrators substitute clusters of synchronized mid-range units that simplify maintenance and spares.
By Application:
Quality Inspection AcceleratesMaterial handling and packaging composed 31.44% of 2025 revenue as robots palletized, case-packed, and shuttled goods in logistics and consumer lines. Despite this scale, quality inspection clocks the fastest 13.02% CAGR through 2031 because deep-learning vision now detects micron-level surface defects at 600-part-per-minute speeds without operator fatigue. Welding and soldering still account for 24% of installs, fortified by adaptive seam tracking that cuts rework 14%. Assembly and dispensing claim 19% share, where cobots slash changeovers from hours to minutes during high-mix production runs. Machine tending automates CNC loading, and painting robots sustain ±5 micrometer film thickness on contoured shells.
Looking forward, 3D scanners and hyperspectral cameras will expand inspection into semiconductor wafers and pharma closures at false-positive rates under 0.8%. Fraunhofer IPA projects AI-driven quality analytics could halve final-audit escapes by 2030. Welding cells integrate laser triangulation that auto-corrects torch position within 0.1 millimeter for thick-plate truck frames. On packaging lines, delta arms married to vision sort confectionery at 300 cycles per minute, achieving continuous flow that matches upstream ovens. In high-mix assembly, force-torque feedback enables precise press-fit connector insertion without part damage.
By End-User Industry:
Pharma Outpaces AutomotiveAutomotive retained 35.86% of the industrial robotics market size in 2025, underpinned by intensive welding, painting, and final assembly. Yet pharmaceuticals and healthcare show the leading 13.52% CAGR as sterile compounding and personalized medicine migrate from batch to continuous robotic lines. Electrical and electronics represented 22% of installs, driven by semiconductor packaging and smartphone assembly, where placement tolerance tightens to ±0.02 millimeter. Food and beverage lines captured 11%, adopting IP65 delta arms to meet sanitary rules and maintain 250-pick-per-minute bagging.
Pharma clean-rooms demand stainless-steel arms and FDA-compliant data logging that boost unit price 40-60% over general-purpose robots. Automotive electrification requires 0.05 millimeter positional accuracy when stacking lithium-ion cells to avert runaway events. Electronics miniaturization pushes vendors to develop sub-pixel camera integration and closed-loop force control. Food processors continue replacing manual case packing with compact cobot cells that redeploy between SKUs daily. Construction materials, rubber, and optics jointly held 7% of 2025 demand, remaining niche due to specialized tooling and smaller addressable volumes.
Geography Analysis
APAC Industrial Robotics Market
Asia Pacific generated 44.36% of 2025 revenue, anchored by China’s domestic manufacturers capturing 52% of local installations under subsidy schemes that cover up to 40% of robot costs. Japan reached a density of 399 units per 10,000 workers, the world’s highest, as automation offsets a shrinking labor base. India’s production-linked incentive pays 4-6% rebates tied to productivity lifts, spurring smartphone and appliance plants to add lightweight cobots.
North America Industrial Robotics Market
North America delivered 26% of the industrial robotics market in 2025, with United States factories absorbing 78% of regional shipments as CHIPS Act grants and tariff pressures prompt local wafer fabs and EV plants. Mexico’s USD 28 billion near-shoring inflow relies on articulated units to satisfy USMCA thresholds while maintaining cost advantages. Canada’s Strategic Innovation Fund earmarks CAD 2.1 billion for advanced manufacturing, demanding cobot integration in battery lines.
Europe Industrial Robotics Market
Europe accounted for 21% of global revenue in 2025, led by Germany, which booked 38% of continental installs helped by Digital Now reimbursement. Italy and France follow, where wage structures keep payback periods under 20 months. Rising cyber-security regulation, notably ISO/IEC 62443 mandates, compels buyers to favor suppliers with hardened controllers, indirectly elevating switching costs.
MEA and South America Industrial Robotics Market
The Middle East, while only 4% of 2025 value, unlocks the steepest 12.22% CAGR as Saudi Vision 2030 invests USD 3.2 trillion in non-oil capacity and the United Arab Emirates mandates 50% localized output by 2031. Government industrial zones offer zero-interest loans for automation, making robots cost-competitive with migrant labor. South America and Africa jointly held 9% in 2025; adoption remains hampered by financing models that require 40-50% down payments and thin integrator networks. Nonetheless, Chilean lithium and Brazilian agribusiness pilots signal nascent demand for wash-down and heavy-payload variants.
Mordor Intelligence provides coverage of the industrial robotics market across other key regional markets, including Asia Pacific, each with their regulatory frameworks and demand patterns.


Regulatory Landscape
Industrial robot suppliers and end users must navigate a tightening safety and cyber compliance stack that increasingly links machinery product safety with connected capabilities. In the European Union, the Machinery Regulation (EU) 2023/1230 is scheduled to apply from 20 January 2027, replacing the Machinery Directive 2006/42/EC and adding provisions relevant to IoT-connected equipment and autonomy features.
For industrial robots used with higher-autonomy software, compliance is also shaped by the EU AI Act (Regulation (EU) 2024/1689), which creates dual conformity expectations when high-risk AI functions are present. Globally, safety benchmarking is anchored by ISO 10218-1:2025 and ISO 10218-2:2025 (effective 1 April 2025). These incorporate collaborative application considerations that many buyers previously handled through ISO/TS 15066, and they raise requirements around functional safety and cybersecurity expectations for modern connected cells.
Value Chain Analysis
The industrial robotics value chain runs from upstream core components, including controllers, servo drives and motors, encoders, and precision reducers such as harmonic drives, to midstream robot body manufacturing and controller integration. Downstream, system integration and commissioning support plant-specific processes. As robot controllers embed more edge compute, vision, and connectivity, a larger portion of differentiation and value capture shifts toward software layers such as perception, motion planning, OPC UA-enabled interoperability, digital twins, and predictive maintenance, while integrators translate those capabilities into validated, application-ready cells.
Physical component availability remains a scaling constraint. In early 2026, lead times for certain mechanical subassemblies, notably precision gear assemblies and actuators, extended to roughly 14 months in some supply chains. That has contributed to multi-month schedule slippage for end users and encouraged OEMs and integrators to dual-source and regionalize procurement. Downstream, integration capacity and validation, including safety verification for collaborative operation and cybersecurity hardening for connected cells, continues to act as a practical bottleneck, increasing the strategic importance of integrator networks and standardized deployment toolchains from major suppliers.
Competitive Landscape
The top five suppliers (FANUC, ABB, Yaskawa, KUKA, and Mitsubishi Electric) collectively owned 38% of 2025 shipments. Price pressure intensifies as Chinese vendors bundle hardware and turnkey cells 30-40% cheaper, winning 52% of mainland volume yet struggling to replicate service footprints abroad. Incumbents respond by embedding vision, AI motion planning, and edge analytics into controllers, pitching lifecycle savings over upfront price.
Patent filings reached 12,400 in 2024; 34% focus on AI motion planning, while 28% address human-robot safety per ISO/TS 15066. This software tilt elevates barriers for hardware-only newcomers. ISO/TS 15066 validation alone can add USD 180,000-320,000 and up to 14 months, cementing incumbent lead times. Robot-as-a-Service offerings from Universal Robots and Techman slice capital barriers for smaller buyers, aligning cost with monthly OPEX budgets.
Sector-specific expansion persists. ABB is building a USD 180 million expansion in Shanghai to triple cobot capacity for electronics and pharma, set to come online in Q3 2026. FANUC pairs with Siemens Industrial Edge for real-time analytics, while Yaskawa’s Veltec acquisition boosts European servicing reach. KUKA’s USD 230 million Tesla contract exemplifies vertical integration into EV value chains. Amid rare-earth price spikes, Mitsubishi Electric’s new Japan R&D hub pursues servo designs that minimize neodymium dependence.
Industrial Robotics Industry Leaders
ABB Ltd.
FANUC Corporation
Yaskawa Electric Corp.
KUKA AG
Mitsubishi Electric Corp.
- *Disclaimer: Major Players sorted in no particular order
Industrial Robotics Market Companies Covered in this Report
- ABB Ltd.
- FANUC Corporation
- Yaskawa Electric Corp.
- KUKA AG
- Mitsubishi Electric Corp.
- Kawasaki Heavy Industries (Robotics)
- DENSO Corporation
- Omron Corporation
- Panasonic Corp.
- Epson Robots
- Staubli Robotics
- Comau S.p.A.
- Yamaha Robotics
- Universal Robots (Teradyne)
- Nachi-Fujikoshi Corp.
- Techman Robot Inc.
- Siasun Robot and Automation
- Doosan Robotics
- Hanwha Robotics

Market Opportunities and Future Outlook
A clear opportunity area is reducing deployment friction for high-mix plants, where integration talent shortages and commissioning time can slow adoption. Vendor moves toward AI-assisted operation and standardized digital engineering toolchains support this whitespace. For example, FANUCs May 2026 collaboration with Google focuses on Physical AI concepts intended to reduce the effort required to make robots act on higher-level intent, while ABBs OmniCore platform investment and controller transition, with IRC5 targeted to be phased out by June 2026, aligns with broader adoption of edge analytics, vision, and cloud connectivity in industrial cells.
Regional programs and factory build-outs also create identifiable demand pockets where industrial robots can be designed around compliance, traceability, and cleanroom constraints rather than generalized handling. In the United States, the CHIPS and Science Act, with USD 11 billion directed toward semiconductor workforce and clean-room automation, and the continuing impact of Section 301 tariffs through 2026 support localized automation programs. In Germany, the Digital Now fund (EUR 500 million per year through 2027) links reimbursement to Industrie 4.0 interoperability. In APAC, Made in China 2025 funding for robotics through 2026 and local-content rules continue to favor suppliers that can qualify local component stacks and integration partners, creating commercial room for localized manufacturing capacity expansions, such as ABBs Shanghai build-out for collaborative robots scheduled to commission in Q3 2026.
Recent Industry Developments in Industrial Robotics Market
- May 2026: FANUC announced a strategic collaboration with Google to advance Physical AI in robot systems, including the use of Google AI agents to operate robots. The initiative reinforces the shift of competitive advantage toward software and autonomy layers that shorten programming cycles and improve flexibility in high-mix production.
- March 2026: FANUC America announced a USD 90 million investment to build an 840,000 sq. ft. facility in Michigan to expand U.S.-based robot manufacturing capacity. The expansion supports localization of supply in a period of reshoring-driven demand and helps mitigate delivery risk when component lead times and trade frictions disrupt project schedules.
- June 2024: ABB launched the OmniCore robotics control platform following a USD 170 million investment, targeting tighter integration of AI, sensors, cloud, and edge computing. ABB also set a transition timeline in which the IRC5 controller is scheduled to be phased out by June 2026, encouraging customers and integrators to standardize on the newer control stack for future cell upgrades.


Industrial Robotics Market Report Scope and Research Methodology
Market Definition and Coverage
For this study, the market covers revenue from newly manufactured industrial robots used in factory and warehouse settings, including the robot unit, its native controller, and standard integration hardware needed to make the system run.
Scope exclusions: We exclude service robots, aftermarket spares, and extended maintenance contracts that sit outside new robot system sales.
Segments Covered in This Report
- By Robot Type
- Articulated Robots
- SCARA Robots
- Cartesian / Gantry Robots
- Parallel / Delta Robots
- Cylindrical Robots
- Collaborative Robots (Cobots)
- By Payload Capacity
- ≤15 kg
- 16-225 kg
- 226-500 kg
- Above 500 kg
- By Application
- Material Handling and Packaging
- Welding and Soldering
- Assembly and Dispensing
- Machine Tending and CNC
- Painting and Coating
- Quality Inspection
- By End-User Industry
- Automotive
- Electrical and Electronics
- Food and Beverage
- Machinery and Metal
- Pharmaceuticals and Healthcare
- Construction Materials
- Other End-User Industries
- By Geography
- North America
- United States
- Canada
- Mexico
- South America
- Brazil
- Argentina
- Rest of South America
- Europe
- Germany
- United Kingdom
- France
- Italy
- Russia
- Rest of Europe
- Asia Pacific
- China
- Japan
- South Korea
- India
- Rest of Asia Pacific
- Middle East
- GCC
- Turkey
- Rest of Middle East
- Africa
- South Africa
- Rest of Africa
- North America
Data Sources, Market Sizing, and Validation
Desk Research
Desk research was used to set the market boundary and build the starting data series that later gets pressure-tested in interviews. We pulled indicators such as industrial production and manufacturing output, trade flows of automation and machinery categories, and labor cost or productivity signals that help explain automation payback cycles.
Public and official sources used include International Federation of Robotics releases, World Bank and OECD manufacturing indicators, UN Comtrade trade statistics, US Bureau of Labor Statistics productivity and wage series, and Eurostat industrial production data. We also reviewed company annual reports, investor presentations, and credible press coverage to understand capacity expansions, factory automation spending themes, and demand by end-use industry. Where needed, paid subscriptions were used for company financials and intelligence, patent database checks, and shipment-level trade visibility to validate directionally consistent volumes and pricing. The sources listed here are illustrative only, and many other public and paid references were also used for cross-checks and clarification.
Primary Interviews and Surveys
Primary work focused on validating what portion of automation spending translates into industrial robot system revenue, and how pricing and lead times move when demand shifts. We spoke with a mix of robot ecosystem participants and large user-side stakeholders across APAC, EMEA, and the Americas to confirm adoption drivers, typical order patterns, and the realism of forecast assumptions used in the model.
Distribution of primary research fieldwork respondents
| Company type | Respondent position | Region |
|---|---|---|
| Top tier: 35% | CXOs: 14% | APAC: 46% |
| Mid tier: 47% | Functional/Unit leaders: 34% | EMEA: 35% |
| Smaller Players: 18% | Managers: 52% | Americas: 19% |
Market-Sizing & Forecasting
Sizing was built using a top-down reconstruction of demand where industrial activity and automation intensity are translated into annual robot system revenue by region. To keep the model grounded, we then used selective bottom-up approximations, such as sampled average selling price bands multiplied by implied shipment volumes, and cross-checks against supplier revenue splits. This helped adjust totals when the first pass looked too high or too low.
Key inputs used (illustrative) included annual industrial robot installation volumes and installed base signals, manufacturing output and capex cycles in robot-heavy industries, robot density and automation penetration trends, average system pricing movement by payload and application mix, and lead time and backlog direction to time revenue recognition. When a country or industry data series was thin, we bridged gaps using proxy indicators like industrial production growth and import intensity, then revalidated the implied trajectory through interviews.
For forecasting, scenario analysis was used because the market is sensitive to macro cycles and discrete jumps in adoption. The final path was anchored to expert consensus on variables such as factory investment outlook, electronics and automotive production plans, and expected price normalization.
Data Validation & Update Cycle
Outputs were checked against independent signals such as installation trends, manufacturing output direction, and the implied price-per-system range to ensure the result stayed realistic. Large variances triggered a second pass on assumptions, followed by analyst reviews focused on unit economics, regional mix, and whether the adoption curve matches what practitioners report.
The report is refreshed annually, and interim updates are made when material events occur, such as sharp demand reversals, major policy changes affecting manufacturing, or step changes in order lead times. Before delivery, we perform a final update pass so the published numbers reflect the latest available indicators and interview feedback.
Mordor Intelligence's Industrial Robotics Market Size Compared Against Other Published Estimates
Published market sizes for industrial robotics often do not match because the boundaries are not consistent, even when the titles look similar. The biggest differences usually come from what is counted as market revenue, the timing of currency conversion, and whether the estimate is tied to shipment and installation realities or stays purely model-driven.
Key gap drivers in this market are the treatment of integration and peripherals, whether software and services are bundled into the same value, and how fast prices are assumed to change as volumes rise. By tracking installation volumes, price bands, and backlog signals, Mordor Intelligence keeps the 2026 value tied to new industrial robot system revenue (robot unit plus native controller plus standard integration hardware) and avoids blending in service robotics or long-tail maintenance that can inflate totals.
Benchmark comparison
| Source | Market Size | Gaps in Research Methodology |
|---|---|---|
| Mordor Intelligence | USD 54.28 B (2026) | |
| Industry Association A | USD 50.00 B (2025) | This figure is stated as overall robotics turnover and can include software and peripherals beyond industrial robot system sales, and it also uses a different year which changes the pricing and currency timing. |
| Trade Journal B | USD 62.40 B (2026) | This estimate appears to include a broader delivered-system scope by bundling more integration content and adjacent services, and the price progression is often treated more aggressively when volumes scale. |
The spread across sources is mainly explained by scope and timing, not by a disagreement that robots are growing in factories. When the count is limited to new industrial robot system revenue and checked against installation and price signals, the resulting size becomes easier to reproduce and update as demand conditions change.


Key Questions Answered in the Report
How fast is the industrial robotics market expected to grow between 2026 and 2031?
The sector is forecast to expand at an 11.7% CAGR, lifting revenue from USD 54.28 billion in 2026 to USD 94.38 billion by 2031.
Which robot category is gaining share most quickly?
Collaborative robots lead growth, posting a 12.92% CAGR as manufacturers favor flexible, uncaged cells.
What is driving robot spending in North America?
CHIPS Act funding, Section 301 tariffs, and EV battery investments encourage reshoring and accelerate automation deployments.
Why are lightweight robots important in electronics and pharma?
Sub-15 kilogram models fit tight clean-room spaces, achieve ±0.01 millimeter precision, and can operate without safety fencing alongside technicians.
How are government subsidies influencing adoption?
Programs in China, Germany, South Korea, and the United States reimburse up to 50% of eligible automation costs, sharply reducing payback periods.
What challenges do small manufacturers face when adopting robots?
High upfront costs and limited integrator availability extend payback beyond 24 months, though Robot-as-a-Service and accelerated depreciation mitigate some barriers.
Page last updated on:


