Market Overview
| Study Period | 2021 - 2031 |
|---|---|
| Forecast Data Period | 2026 - 2031 |
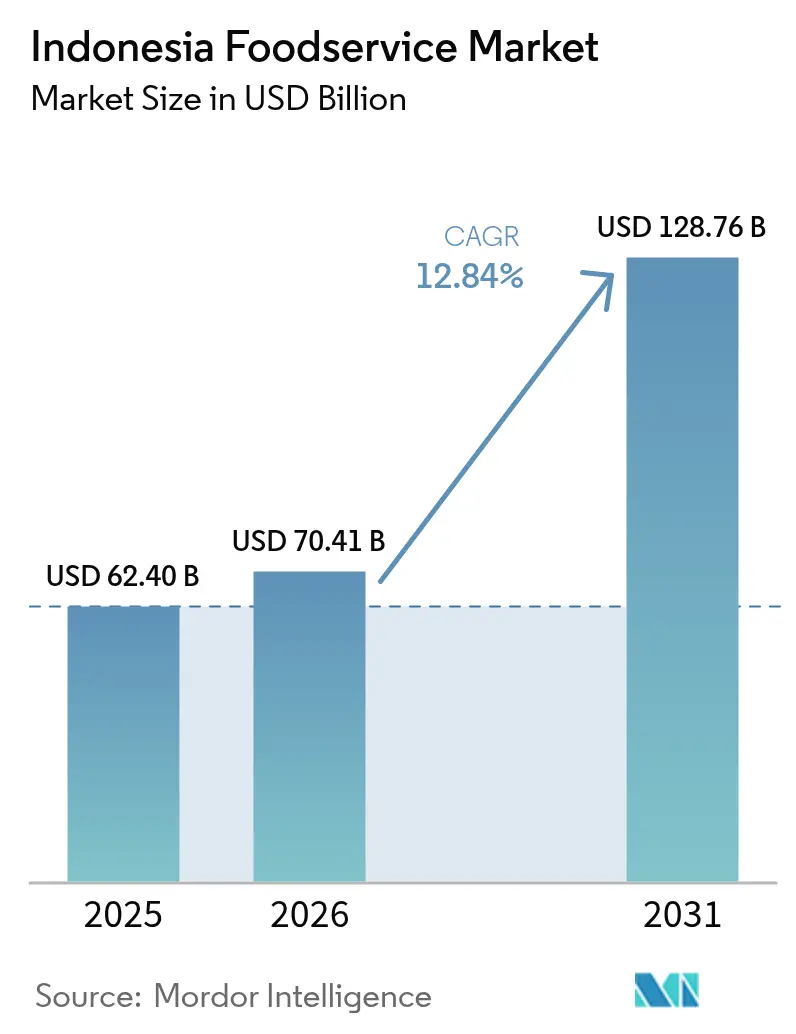
| Base Year Market Size (2025) | USD 62.40 Billion |
| Market Size (2026) | USD 70.41 Billion |
| Market Size (2031) | USD 128.76 Billion |
| Growth Rate (2026 - 2031) | 12.84% CAGR |
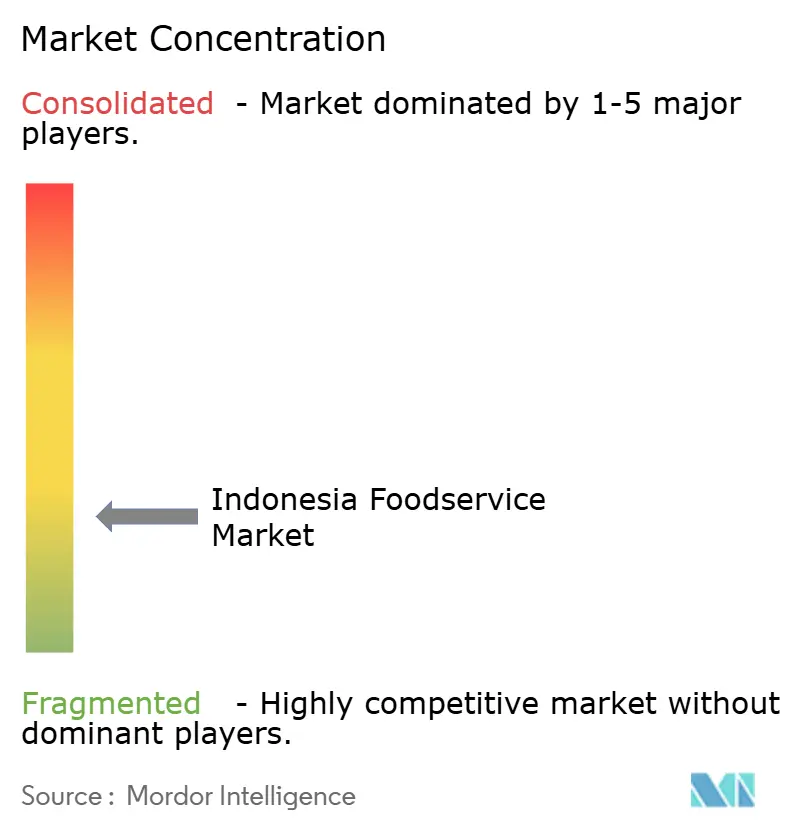
| Market Concentration | Low |
Major Players
*Disclaimer: Major Players sorted in no particular order Image © Mordor Intelligence. Reuse requires attribution under CC BY 4.0. |
|
Indonesia Foodservice Market Analysis by Mordor Intelligence
The Indonesia Foodservice Market size in 2026 is estimated at USD 70.41 billion, growing from 2025 value of USD 62.40 billion with 2031 projections showing USD 128.76 billion, growing at 12.84% CAGR over 2026-2031. This growth trajectory positions Indonesia as Southeast Asia's largest foodservice market, driven by the convergence of full-service and quick service restaurants with emerging digital delivery ecosystems and evolving consumer preferences [1]Source: U.S Department of Agriculture, "Food Service - Hotel Restaurant Institutional Annual", apps.fas.usda.gov. The upward trajectory of the Indonesia foodservice market is underpinned by resilient household consumption, rapid digital delivery adoption, and the steady recovery of hospitality and tourism activity. Full-service restaurants command over half of current sales, while cafés and bars, propelled by specialty coffee chains, register the fastest expansion. Independent operators still dominate outlet counts, yet chained brands are scaling quickly through standardized formats and franchise financing. Stand-alone locations remain the primary venue type, but hotel-based dining is benefiting from strengthening visitor arrivals and new lodging supply. Ongoing halal certification reforms and front-of-pack nutrition labeling rules are reshaping menus, procurement, and branding, reinforcing trust among increasingly health-aware urban consumers.
Key Report Takeaways
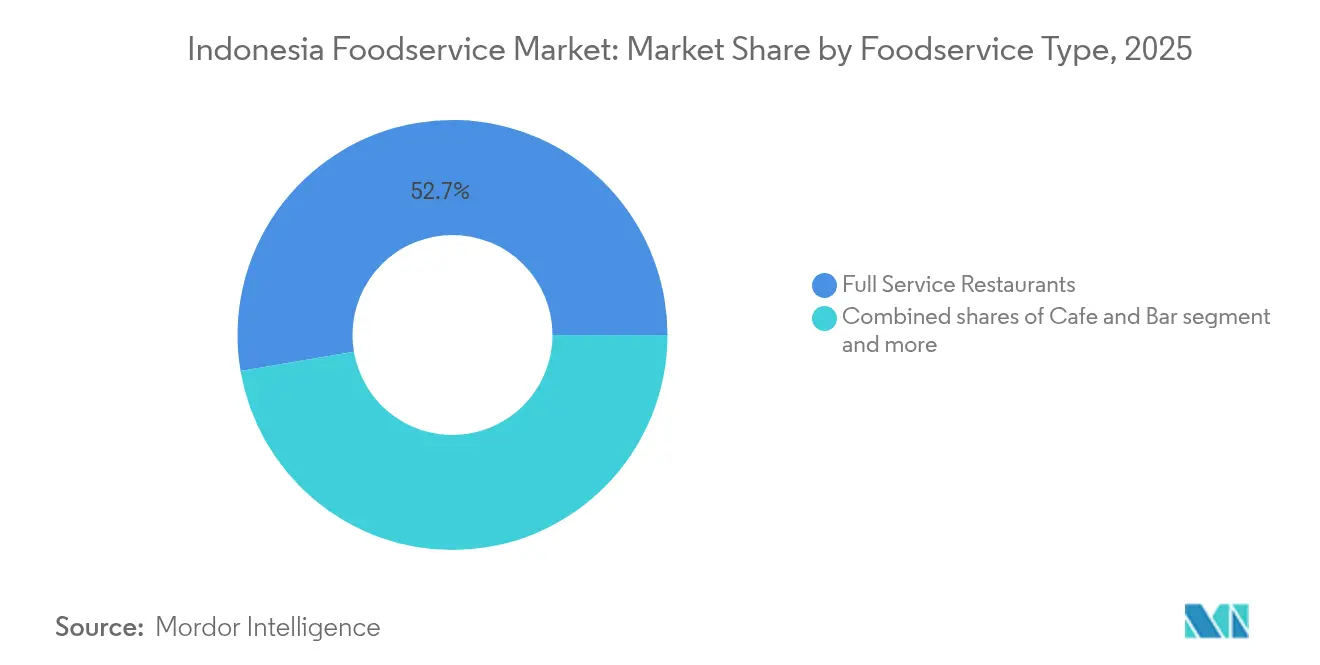
- By foodservice type, full-service restaurants held 52.67% of the Indonesia foodservice market share in 2025, cafés and bars are projected to post the highest 15.23% CAGR to 2031.
- By outlet, independent operators accounted for 62.41% of the Indonesia foodservice market size in 2025, chained formats are forecast to grow at a 13.76% CAGR through 2031.
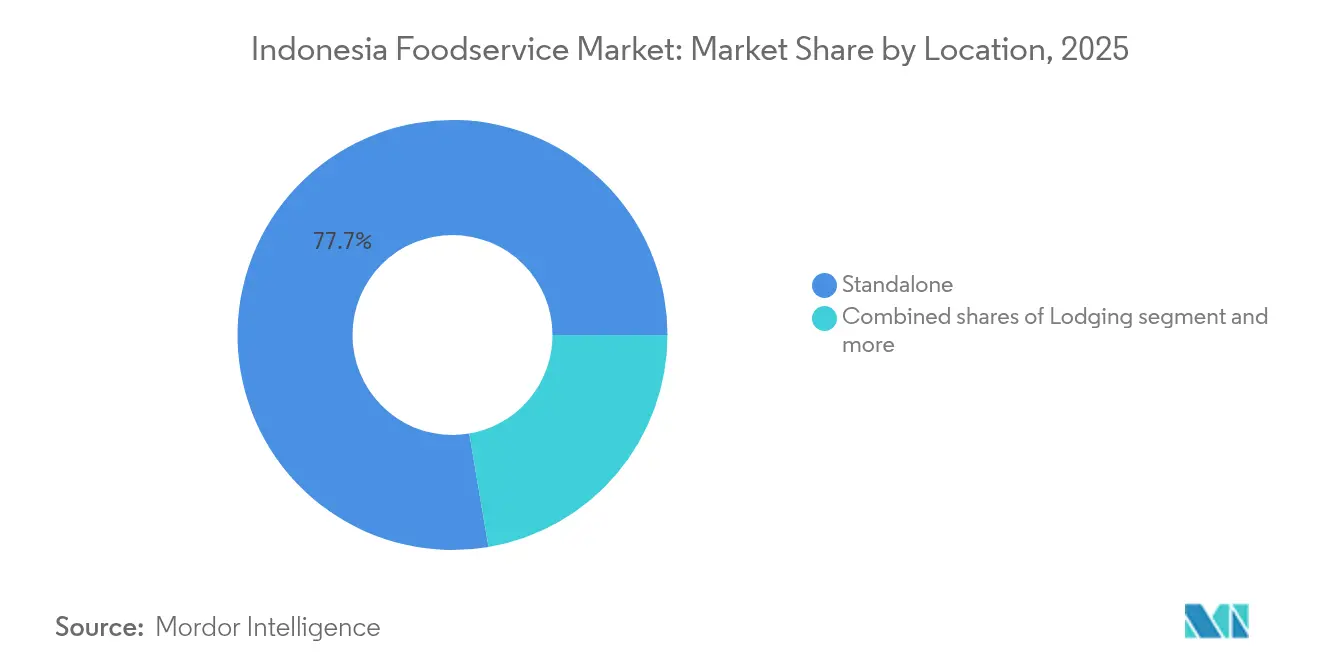
- By location, standalone held 77.68% of the share, lodging is expected to expand at a 15.05% CAGR through 2031.
- By service type, Dine-in occupies 47.96% of the service type share in 2025, takeaway transactions are predicted to rise at a 12.98% CAGR through 2031.
Note: Market size and forecast figures in this report are generated using Mordor Intelligence’s proprietary estimation framework, updated with the latest available data and insights as of 2026.
Indonesia Foodservice Market Trends and Insights
Drivers Impact Analysis*
| Driver | (~) % Impact on CAGR Forecast | Geographic Relevance | Impact Timeline |
|---|---|---|---|
| Rapid café culture and coffee-chain proliferation | +2.8% | Java-centric with expansion to Tier-2 cities | Medium term (2-4 years) |
| Menu localization by global chains | +1.9% | National, with early gains in Jakarta, Surabaya, Bandung | Short term (≤ 2 years) |
| Strong 'Dine-Out' and socializing culture | +2.1% | Urban centers nationwide, strongest in Jakarta and Bali | Long term (≥ 4 years) |
| Dark / cloud kitchen expansion | +3.2% | Metropolitan areas, led by Jakarta and surrounding regions | Short term (≤ 2 years) |
| Rise of halal-assurance branding | +1.7% | National coverage with premium positioning in urban markets | Medium term (2-4 years) |
| High mobile-app ordering literacy | +2.5% | Urban and suburban areas with strong digital infrastructure | Short term (≤ 2 years) |
| Source: Mordor Intelligence | |||
Rapid Café Culture and Coffee-Chain Proliferation
Indonesia's coffee culture transformation is reshaping the foodservice landscape through rapid specialty chain expansion and premiumization trends. Local coffee chains like Kopi Kenangan have scaled to over 900 outlets while Tomoro Coffee operates approximately 600 stores, demonstrating the market's appetite for differentiated coffee experiences beyond traditional warung kopi, according to the USDA Foreign Agricultural Service. This proliferation extends beyond domestic players, with international brands like Flash Coffee and Fore Coffee establishing significant footprints through franchise models and strategic partnerships. The segment's growth is amplified by Indonesian consumers' increasing willingness to pay premium prices for artisanal coffee experiences, with specialty coffee shops commanding higher average transaction values than traditional food outlets. This trend creates opportunities for equipment suppliers, specialty ingredient importers, and real estate developers targeting high-traffic urban locations.
Menu Localization by Global Chains
International foodservice brands are accelerating localization strategies to compete effectively against Indonesia's deeply embedded culinary traditions and price-sensitive consumer segments. Global chains are incorporating Indonesian flavors, ingredients, and cooking methods into their core offerings, moving beyond superficial adaptations to fundamental menu restructuring that resonates with local palates. This localization extends to pricing strategies, with international brands developing value-tier products specifically for Indonesian markets while maintaining premium positioning for aspirational consumers. The approach reflects lessons learned from successful regional players who have built market share by combining international operational standards with authentic local flavors. Menu localization also addresses Indonesia's diverse regional preferences, with chains adapting offerings for Javanese, Sumatran, and other regional taste profiles to maximize market penetration. The strategy becomes particularly critical as Indonesian consumers demonstrate strong loyalty to familiar flavors, making authentic localization a competitive necessity rather than a marketing enhancement.
Strong 'Dine-Out' and Socializing Culture
Indonesia's robust socializing culture continues to drive foodservice demand despite economic pressures, with dining out serving as a primary social activity across demographic segments. The cultural emphasis on communal dining and social gatherings creates sustained demand for group-friendly restaurant formats and shared-portion menu items, supporting the growth of full-service establishments that facilitate extended social interactions. This behavior pattern has proven resilient through economic cycles, with Indonesians prioritizing food experiences as essential social infrastructure rather than discretionary spending. The trend is particularly pronounced among younger demographics who view restaurants and cafes as social hubs for both personal and professional networking. This cultural foundation provides stability for foodservice operators and creates opportunities for concepts that enhance social experiences through ambiance, seating arrangements, and menu formats designed for sharing.
Dark / Cloud Kitchen Expansion
Cloud kitchen proliferation is revolutionizing Indonesia's foodservice supply chain by enabling operators to serve multiple delivery brands from single locations while minimizing real estate costs. This model has gained traction in Jakarta and surrounding metropolitan areas, where high commercial rents and traffic congestion make traditional restaurant locations economically challenging. Cloud kitchens allow established restaurants to expand their delivery radius without additional front-of-house investments, while enabling new entrants to test market demand with lower capital requirements. The model also enables rapid geographic expansion, with successful cloud kitchen operators scaling to multiple cities without the complexities of traditional restaurant site selection and buildout. This trend creates opportunities for commercial real estate developers, kitchen equipment suppliers, and logistics providers serving the delivery ecosystem.
Restraints Impact Analysis*
| Restraint | (~) % Impact on CAGR Forecast | Geographic Relevance | Impact Timeline |
|---|---|---|---|
| Intense competition from independent and street Food | -2.3% | National, most pronounced in urban centers with high street food density | Long term (≥ 4 years) |
| Inconsistent food safety and hygiene standards | -1.8% | Rural and semi-urban areas with limited regulatory enforcement | Medium term (2-4 years) |
| Menu copycatting and concept fatigue | -1.4% | Urban markets with high restaurant density | Short term (≤ 2 years) |
| Cold-chain and perishables reliability gaps | -2.1% | Eastern Indonesia and remote islands with infrastructure limitations | Long term (≥ 4 years) |
| Source: Mordor Intelligence | |||
Intense Competition from Independent and Street Food
Indonesia's vast network of independent restaurants and street food vendors creates persistent pricing pressure that limits formal foodservice operators' ability to capture market share in price-sensitive segments. Traditional warung and street food stalls operate with minimal overhead costs, enabling them to offer authentic local dishes at price points that formal restaurants cannot match while maintaining profitability. This competitive dynamic is particularly challenging in urban areas where street food density is highest and consumer familiarity with local vendors runs deepest. The competition extends beyond pricing to authenticity perceptions, with many Indonesian consumers viewing street food as a more genuine representation of local culinary traditions compared to formal restaurant offerings. Street food operators also benefit from flexible operating models that allow rapid menu adjustments, location changes, and seasonal adaptations that formal restaurants cannot replicate due to regulatory and operational constraints. The challenge intensifies as street food vendors increasingly adopt digital payment systems and delivery partnerships, reducing the convenience advantages that previously differentiated formal foodservice operators.
Inconsistent Food Safety and Hygiene Standards
Regulatory enforcement variations across Indonesia's diverse geographic regions create operational complexities that increase compliance costs and limit scalability for multi-location foodservice operators. BPOM's (Indonesian Food and Drug Administration) food safety oversight capabilities vary significantly between major urban centers and remote areas, creating inconsistent standards that complicate supply chain management and quality assurance protocols [2]Source: Indonesian Food and Drug Authority, "Strengthening Consumer Protection in Online Drug and Food Product Transactions", pom.go.id. This inconsistency particularly affects chains seeking to expand beyond Java, where regulatory infrastructure and enforcement capabilities may be less developed. The challenge is compounded by Indonesia's archipelagic geography, which makes centralized quality control and supply chain monitoring difficult and expensive to implement effectively. Inconsistent standards also create consumer confusion about food safety expectations, with some markets accepting lower hygiene standards while others demand international-level compliance. The regulatory uncertainty increases operational risks and insurance costs for foodservice operators while creating barriers to entry for international brands accustomed to uniform regulatory environments.
*Our forecasts treat driver/restraint impacts as directional, not additive. The impact forecasts reflect baseline growth, mix effects, and variable interactions.
Segment Analysis
By Foodservice Type: Full-Service Restaurants Lead Amid Café Acceleration
Full-service restaurants maintain market dominance with a 52.67% share in 2025, reflecting Indonesian consumers' preference for comprehensive dining experiences that accommodate social gatherings and family meals. However, the café and bars segment demonstrates the strongest growth trajectory at 15.23% CAGR through 2031, driven by urbanization trends and evolving lifestyle preferences among younger demographics. Quick service restaurants occupy a significant but stable position, benefiting from convenience demands and delivery integration, while cloud kitchens represent an emerging category that leverages delivery platforms without traditional front-of-house investments. The segment dynamics reflect Indonesia's economic development, with full-service establishments serving established middle-class consumers while café concepts capture emerging affluent segments seeking premium experiences.
Specialty coffee and tea shops within the café segment are experiencing particularly robust expansion through aggressive franchising and strategic location selection. This growth reflects Indonesian consumers' increasing sophistication in coffee consumption, moving beyond traditional kopi tubruk to specialty brewing methods and premium bean varieties. The bars and pubs subcategory faces regulatory constraints in some regions but demonstrates strong performance in tourism-focused areas like Bali and Jakarta's entertainment districts. Juice, smoothie, and dessert bars are capitalizing on health consciousness trends, particularly among urban millennials and Gen Z consumers who prioritize wellness-oriented food choices.


By Outlet: Independent Dominance Challenged by Chain Expansion
Independent outlets command 62.41% market share in 2025, reflecting Indonesia's entrepreneurial food culture and the prevalence of family-owned restaurants, warungs, and street food operations. This dominance stems from independent operators' ability to offer authentic local flavors at competitive price points while maintaining operational flexibility that enables rapid menu adjustments and location changes. Independent establishments also benefit from deep community connections and customer loyalty that chain operators struggle to replicate, particularly in smaller cities and rural areas where personal relationships drive dining decisions.
Chained outlets, despite holding a smaller market share, demonstrate superior growth momentum at 13.76% CAGR through 2031, indicating ongoing market consolidation and professionalization trends. The Ministry of Trade reports that food and beverage franchises represent 47.92% of all franchised businesses in Indonesia, highlighting the sector's appeal for structured expansion models . Chain growth is driven by superior access to capital, standardized operational systems, and marketing capabilities that enable rapid geographic expansion and brand recognition development. International chains benefit from proven business models and supply chain efficiencies, while domestic chains leverage local market knowledge and cultural authenticity to compete effectively against global brands.
By Locations: Standalone Operations Face Lodging Sector Competition
Standalone restaurants represent 77.68% of market share in 2025, demonstrating the continued viability of independent location strategies that prioritize accessibility and community integration over integrated hospitality offerings. This segment includes traditional street-front restaurants, shopping center food courts, and purpose-built dining destinations that rely on foot traffic and local customer bases. Standalone operations benefit from lower rental costs compared to premium locations and greater operational independence that enables customized service approaches and menu offerings.
The lodging segment, while smaller in absolute terms, exhibits the highest growth rate at 15.05% CAGR through 2031, reflecting Indonesia's tourism recovery and hospitality sector expansion. Hotel occupancy rates recovered to approximately 51.1% annually in 2023, supporting increased food and beverage revenue within hospitality properties. This growth is supported by Indonesia's hotel inventory expansion from 16,685 properties in 2013 to 29,005 in 2023, creating substantial new foodservice capacity within integrated hospitality environments. Retail locations maintain steady performance through shopping mall partnerships, while travel locations benefit from airport expansions and transportation hub developments that increase passenger traffic and dwell time.
By Service Type: Takeaway Gains Ground Despite Dine-In Resilience
Dine-in services maintain the largest market share at 47.96% in 2025, reflecting Indonesian cultural preferences for social dining experiences and the importance of restaurants as community gathering spaces. This resilience demonstrates that despite digital transformation trends, physical dining experiences remain central to Indonesian food culture, particularly for family celebrations, business meetings, and social occasions that require extended interaction time. Dine-in establishments benefit from higher average transaction values and opportunities for upselling through beverage pairings, appetizers, and dessert offerings that delivery formats cannot easily replicate.
Takeaway services demonstrate the strongest growth trajectory at 12.98% CAGR through 2031, driven by urbanization, traffic congestion, and evolving lifestyle patterns that prioritize convenience and time efficiency. This growth is supported by Indonesia's position as Southeast Asia's largest food delivery market, and platforms like GrabFood and GoFood facilitating seamless ordering and payment processes. Delivery services occupy a complementary position, enabling restaurants to extend their reach beyond physical locations while serving consumers who prioritize convenience over dining ambiance. The service type segmentation reflects Indonesia's economic development, with takeaway growth concentrated in urban areas where time constraints and traffic conditions make delivery more attractive than traditional dine-in experiences.
Competitive Landscape
The Indonesia foodservice market exhibits significant fragmentation, creating opportunities for both established players and new entrants to capture market share through differentiated positioning and operational excellence. This fragmentation reflects the market's diverse consumer segments, ranging from price-sensitive mass market consumers to affluent urban diners seeking premium experiences. International chains like McDonald's, KFC, and Pizza Hut maintain prominent positions through brand recognition and standardized operations.
Local chains are gaining ground through aggressive expansion strategies, with coffee specialists like Kopi Kenangan achieving over 900 outlets and demonstrating the viability of domestic brands that combine international operational standards with local market insights. Strategic patterns in the competitive landscape emphasize technology adoption, delivery integration, and format innovation as key differentiators. Cloud kitchen operators are leveraging Indonesia's robust delivery ecosystem to serve multiple brands from single locations, while traditional restaurants are investing in digital ordering systems and loyalty programs to compete with app-native concepts.
Opportunities exist in underserved geographic markets, particularly in eastern Indonesia and smaller cities where infrastructure development is creating new consumer segments with growing disposable incomes. Emerging disruptors include specialty coffee chains expanding beyond Java, health-focused concepts targeting wellness-conscious consumers, and hybrid formats that combine retail and foodservice elements. The competitive intensity is amplified by low barriers to entry for independent operators, but successful scaling requires sophisticated supply chain management, brand development, and regulatory compliance capabilities that favor more established players with access to capital and operational expertise.
Indonesia Foodservice Industry Leaders
-
JCO DONUT & COFFEE
-
Inspire Brands, Inc.
-
Solaria Indonesia
-
Jiwa Group
-
The Wendy's Company
- *Disclaimer: Major Players sorted in no particular order

Recent Industry Developments
- September 2025: Fore expanded its footprint by launching Fore Donut, inaugurating its first outlet at Supermal Karawaci in Tangerang, Java. The menu at Fore Donut showcased creations like Pistachio Dreamin’ and Berry Matcha, along with coffee-infused options such as Butterscotch Than Never. Additionally, the menu featured local twists, including the Ayam Pop doughnut.
- July 2025: Chili's, the American casual diner, opened its inaugural restaurant in Indonesia, setting up shop in Tribeca Central Park Mall, West Jakarta. With a presence spanning over 1,600 outlets across 30+ countries, Chili's sought to introduce its signature generous portions and "good-value" dining experience to the Indonesian audience.
- January 2025: Vietnam's Pizza 4P's inaugurated its inaugural outlet in Indonesia, marking a significant step in the brand's global expansion. Situated in Jakarta's Mori Tower, the new store boasts eco-friendly elements, such as handwoven water hyacinth wallpaper, indigo-dyed cotton cushions, and seashell-embedded terrazzo flooring.


Indonesia Foodservice Market Report Scope
The foodservice market is the industry encompassing businesses that prepare and serve meals for immediate consumption outside the home. The Indonesia foodservice market is segmented by foodservice type, outlet, location, and service type. By foodservice type, the market is divided into cafes and bars, cloud kitchens, full-service restaurants, and quick-service restaurants. By outlet, it is divided into outlet-chained outlets and independent outlets. By location, it is segmented into leisure, lodging, retail, standalone, and travel. By service type, it is bifurcated into dine-in, takeaway, and delivery.
By Foodservice Type
| Café and Bars | By Cuisine | Bars and Pubs |
| Café | ||
| Juice/Smoothie/Desserts Bars | ||
| Specialist Coffee and Tea Shops | ||
| Cloud Kitchen | ||
| Full Service Restaurants | By Cuisine | Asian |
| European | ||
| Latin American | ||
| Middle Eastern | ||
| North American | ||
| Other FSR Cuisines | ||
| Quick Service Restaurants | By Cuisine | Bakeries |
| Burger | ||
| Ice Cream | ||
| Meat-based Cuisines | ||
| Pizza | ||
| Other QSR Cuisines |
By Outlet
| Chained Outlets |
| Independent Outlets |
By Locations
| Leisure |
| Lodging |
| Retail |
| Sandalone |
| Travel |
By Service Type
| Dine-in |
| Takeaway |
| Delivery |
| By Foodservice Type | Café and Bars | By Cuisine | Bars and Pubs |
| Café | |||
| Juice/Smoothie/Desserts Bars | |||
| Specialist Coffee and Tea Shops | |||
| Cloud Kitchen | |||
| Full Service Restaurants | By Cuisine | Asian | |
| European | |||
| Latin American | |||
| Middle Eastern | |||
| North American | |||
| Other FSR Cuisines | |||
| Quick Service Restaurants | By Cuisine | Bakeries | |
| Burger | |||
| Ice Cream | |||
| Meat-based Cuisines | |||
| Pizza | |||
| Other QSR Cuisines | |||
| By Outlet | Chained Outlets | ||
| Independent Outlets | |||
| By Locations | Leisure | ||
| Lodging | |||
| Retail | |||
| Sandalone | |||
| Travel | |||
| By Service Type | Dine-in | ||
| Takeaway | |||
| Delivery | |||


Market Definition
- FULL-SERVICE RESTAURANTS - A foodservice establishment where customers are seated at a table, give their order to a server and are served food at a table.
- QUICK SERVICE RESTAURANTS - A foodservice establishment that provides customers convenience, speed, and food offerings at lower prices. Customers usually help themselves and carry their own food to their tables.
- CAFES & BARS - A type of foodservice business that include bars and pubs that are licensed to serve alcoholic drinks for consumption, cafes that serve refreshments and light food items, as well as specialty tea and coffee shops, dessert bars, smoothie bars, and juice bars.
- CLOUD KITCHEN - A foodservice business that utilizes a commercial kitchen for the purpose of preparing food for delivery or takeout only, with no dine-in customers.
| Keyword | Definition |
|---|---|
| Albacore Tuna | It is one of the smallest species of tuna found in the six distinct stocks known globally in the Atlantic, Pacific, and Indian oceans, as well as the Mediterranean Sea. |
| Angus beef | It is beef derived from a specific breed of cattle indigenous to Scotland. It requires certification from the American Angus Association to receive the "Certified Angus Beef" quality mark. |
| Asian cuisine | It includes full-service offerings in restaurants that serve cuisines from cultures such as Chinese, Indian, Korean, Japanese, Bengali, Southeast Asian, etc. |
| Average Order Value | It is the average value of all orders made by the customers at a foodservice establishment. |
| Bacon | It is salted or smoked meat that comes from the back or sides of a pig. |
| Bars & Pubs | It is a drinking establishment that is licensed to serve alcoholic drinks for consumption on the premises. |
| Black Angus | It is beef derived from a black-hided breed of cows that don't have horns. |
| BRC | British Retail Consortium |
| Burger | It is a sandwich consisting of one or more cooked beef patties, placed inside a sliced bread roll or bun roll. |
| Café | It is a foodservice establishment serving various refreshments (mainly coffee) and light meals. |
| Cafes & Bars | It is a type of foodservice business that include bars and pubs that are licensed to serve alcoholic drinks for consumption, cafes that serve refreshments and light food items, as well as specialty tea and coffee shops, dessert bars, smoothie bars, and juice bars. |
| Cappuccino | It is an Italian coffee drink that is traditionally prepared with equal parts double espresso, steamed milk, and steamed milk foam. |
| CFIA | Canadian Food Inspection Agency |
| Chained Outlet | It refers to a foodservice establishment that shares brands, operates in several locations, has central management, and standardized business practices. |
| Chicken Tender | It refers to chicken meat prepared from the pectoralis minor muscles of a chicken bird. |
| Cloud Kitchen | It is a foodservice business that utilizes a commercial kitchen for the purpose of preparing food for delivery or takeout only, with no dine-in customers. |
| Cocktail | It is an alcoholic mixed drink made with either a single spirit or a combination of spirits, mixed with other ingredients such as juices, flavored syrups, tonic water, shrubs, and bitters. |
| Edamame | It is a Japanese dish prepared with soybeans (harvested before they ripen or harden) and cooked in its pod. |
| EFSA | European Food Safety Authority |
| ERS | Economic Research Service of the USDA |
| Espresso | It is a concentrated form of coffee, served in shots. |
| European cuisine | It includes full-service offerings in restaurants that serve cuisines from cultures such as Italian, French, German, English, Dutch, Danish, etc. |
| FDA | Food and Drug Administration |
| Fillet Mignon | It is a cut of meat taken from the smaller end of the tenderloin. |
| Flank Steak | It is a cut of beef steak taken from the flank, which lies forward of the rear quarter of a cow. |
| Foodservice | It refers to the part of the food industry which includes businesses, institutions, and companies which prepare meals outside the home. It includes restaurants, school and hospital cafeterias, catering operations, and many other formats. |
| Franks | Also known as frankfurter or Würstchen, it is a type of highly seasoned smoked sausage popular in Austria and Germany. |
| FSANZ | Food Standards Australia New Zealand |
| FSIS | Food Safety and Inspection Service |
| FSSAI | Food Safety and Standards Authority of India |
| Full service restaurant | It refers to a foodservice establishment where customers are seated at a table, give their order to a server, and are served food at a table. |
| Ghost Kitchen | It refers to a cloud kitchen. |
| GLA | Gross Leasable Area |
| Gluten | It is a family of proteins found in grains, including wheat, rye, spelt, and barley. |
| Grain-fed beef | It is beef derived from cattle that have been fed a diet supplemented with soy and corn and other additives. Grain-fed cows can also be given antibiotics and growth hormones to fatten them up more quickly. |
| Grass-fed beef | It is beef derived from cattle that have only been fed grass as feed. |
| Ham | It refers to the pork meat taken from the leg of a pig. |
| HoReCa | Hotels, Restaurants and Cafes |
| Independent Outlet | It refers to a foodservice establishment that operates with a single outlet or is structured as a small chain with no more than three locations. |
| Juice | It is a drink made from the extraction or pressing of the natural liquid contained in fruit and vegetables. |
| Latin American | It includes full-service offerings in restaurants that serve cuisines from cultures such as Mexican, Brazilian, Argentinian, Colombian, etc. |
| Latte | It is a milk-based coffee that is made up of one or two shots of espresso, steamed milk, and a thin layer of frothed milk. |
| Leisure | It refers to foodservice offered as a part of a recreation business, such as sports arenas, zoos, movie theaters, and museums. |
| Lodging | It refers to foodservice offerings at hotels, motels, guesthouses, holiday homes, etc. |
| Macchiato | It is an espresso coffee drink with a small amount of milk, usually foamed. |
| Meat-based cuisines | This inlcudes food items like fried chicken, steak, ribs, etc. where meat is the primary ingredient for the dish. |
| Middle Eastern cuisine | It includes full-service offerings in restaurants that serve cuisines from cultures such as Arabic, Lebanese, Iranian, Israeli, etc. |
| Mocktail | It is an non-alcoholic mixed drink. |
| Mortadella | It is a large Italian sausage or luncheon meat made of finely hashed or ground heat-cured pork, which incorporates at least 15% small cubes of pork fat. |
| North American | It includes full-service offerings in restaurants that serve cuisines from cultures such as American, Canadian, Caribbean, etc. |
| Pastrami | It refers to a highly seasoned smoked beef, typically served in thin slices. |
| PDO | Protected Designation of Origin: It is the name of a geographical region or specific area that is recognized by official rules to produce certain foods with special characteristics related to location. |
| Pepperoni | It is an American variety of spicy salami made from cured meat. |
| Pizza | It is a dish made typically of flattened bread dough spread with a savory mixture usually including tomatoes and cheese and often other toppings and baked. |
| Primal cuts | It refers to the major sections of the carcass. |
| Quick service restaurant | It refers to a foodservice establishment that provides customers convenience, speed, and food offerings at lower prices. Customers usually help themselves and carry their own food to their tables. |
| Retail | It refers to a foodservice outlet inside a mall. shopping complex or a commercial real estate building, where there are other businesses operating as well. |
| Salami | It is a cured sausage consisting of fermented and air-dried meat. |
| Saturated fat | It is a type of fat in which the fatty acid chains have all single bonds. It is generally considered unhealthy. |
| Sausage | It is a meat product made of finely chopped and seasoned meat, which may be fresh, smoked, or pickled and which is then usually stuffed into a casing. |
| Scallop | It is an edible shellfish that is a mollusk with a ribbed shell in two parts. |
| Seitan | It is a plant-based meat substitute made out of wheat gluten. |
| Self-service kiosk | It refers to a self-order point-of-sale (POS) system through which customers place and pay for their own orders at kiosks, enabling totally contactless and frictionless service. |
| Smoothie | It is a beverage made by placing all the ingredients in a container and processing them together, without removing the pulp. |
| Specialty coffee & tea shops | It refers to a foodservice establishment that serves only various types of tea or coffee. |
| Standalone | It refers to a restaurants that have an independent infrastructure setup and not connected to any other business. |
| Sushi | It is a Japanese dish of prepared vinegared rice, usually with some sugar and salt, accompanied by a variety of ingredients, such as seafood—often raw—and vegetables. |
| Travel | It refers to foodservice offerings such as airplane food, dining on long-distance trains, and foodservice on cruise ships. |
| Virtual Kitchen | It refers to a cloud kitchen. |
| Wagyu Beef | It is beef derived from any of four strains of a breed of black or red Japanese cattle that are valued for their highly marbled meat. |


Research Methodology
Mordor Intelligence follows a four-step methodology in all our reports.
- Step-1: Identify Key Variables: In order to build a robust forecasting methodology, the variables and factors identified in Step 1 are tested against available historical market numbers. Through an iterative process, the variables required for the market forecast are set, and the model is built on the basis of these variables.
- Step-2: Build a Market Model: Market size estimations for the forecast years are in nominal terms. Inflation is considered for average order value, and it is forecasted as per predicted inflation rates in the countries.
- Step-3: Validate and Finalize: In this important step, all market numbers, variables, and analyst calls are validated through an extensive network of primary research experts from the market studied. The respondents are selected across levels and functions to generate a holistic picture of the market studied.
- Step-4: Research Outputs: Syndicated Reports, Custom Consulting Assignments, Databases & Subscription Platforms


