Market Overview
| Study Period | 2020 - 2031 |
|---|---|
| Forecast Data Period | 2026 - 2031 |
| Historical Data Period | 2020 - 2024 |
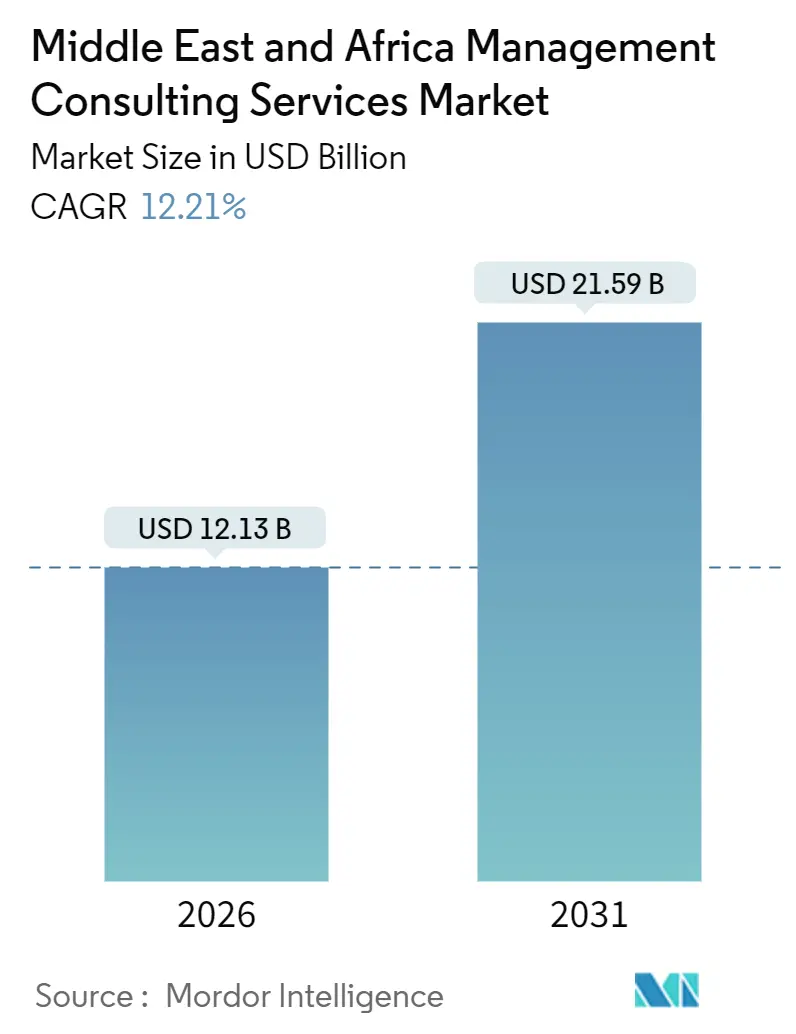
| Market Size (2026) | USD 12.13 Billion |
| Market Size (2031) | USD 21.59 Billion |
| Growth Rate (2026 - 2031) | 12.21% CAGR |
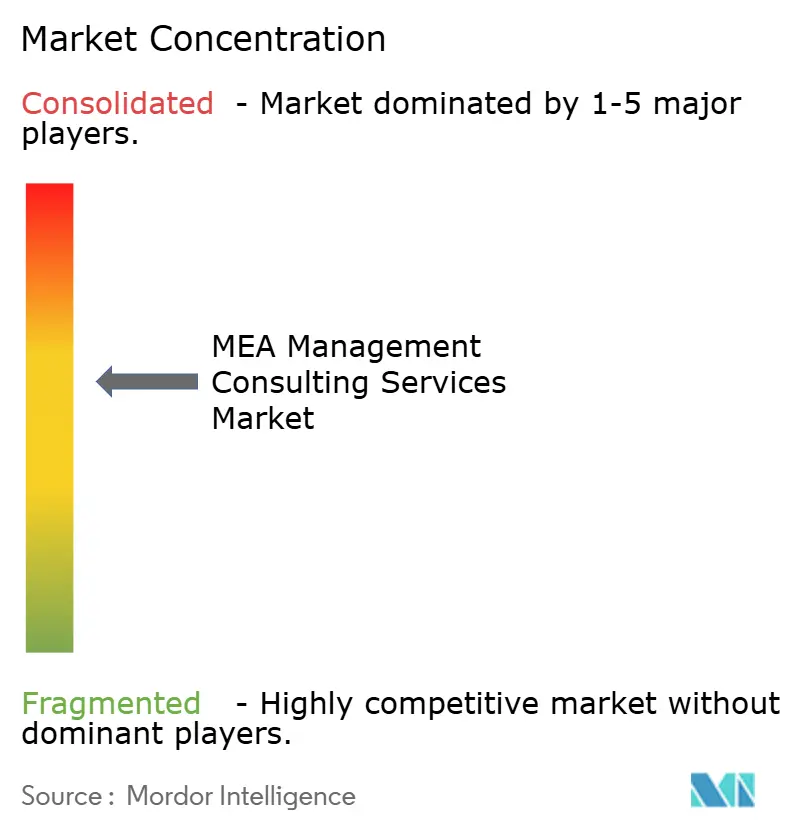
| Market Concentration | Medium |
Major Players *Disclaimer: Major Players sorted in no particular order Image © Mordor Intelligence. Reuse requires attribution under CC BY 4.0. | |
Middle East And Africa Management Consulting Services Market Analysis by Mordor Intelligence
The Middle East and Africa management consulting services market size is USD 12.13 billion in 2026 and is forecast to reach USD 21.59 billion by 2031, translating into a CAGR of 12.21% over the period. Robust public-sector transformation programs across the Gulf Cooperation Council, a sharp rise in private-equity deployment in sub-Saharan Africa, and widening adoption of environmental, social, and governance reporting frameworks form the backbone of this expansion. A widening digital-skills gap, growing demand for artificial-intelligence use cases, and stricter data-protection mandates are pushing clients to seek external expertise, thereby enlarging the addressable pool for the MEA management consulting services market. Competitive strategies revolve around sector specialization, in-country delivery capacity, and proprietary technology platforms, all aimed at securing long-term, multi-function mandates with sovereign entities and multinational corporations. Saudi Arabia and the United Arab Emirates remain the spending epicenter, yet Nigeria, South Africa, and Egypt are emerging as growth nodes on the back of private-capital inflows and infrastructure build-outs.
Key Report Takeaways
- By service type, technology advisory captured 29.11% of revenue share in 2025 and is also projected to post a 12.67% CAGR through 2031.
- By theme, digital transformation accounted for 38.29% of spending in 2025; the AI-driven transformation subset is set to accelerate at a 12.88% CAGR through 2031.
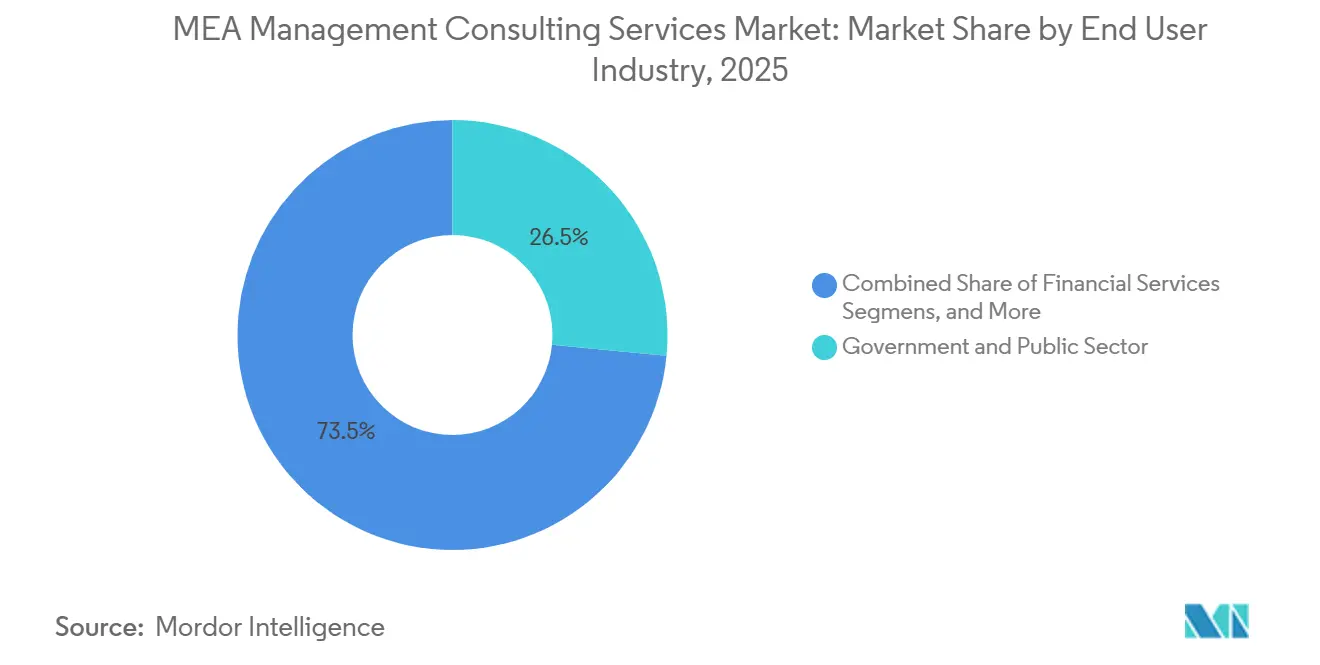
- By end-user industry, government and public-sector clients retained 26.54% of the MEA management consulting services market share in 2025; energy and utilities are projected to expand at a 12.93% CAGR between 2026-2031.
- By enterprise, large organizations accounted for 78.31% of 2025 billings, yet small and medium enterprises are forecast to grow at a 13.54% CAGR through 2031.
- By country, Saudi Arabia held 51.23% of the revenue share in 2025 and is also expected to log the fastest 13.15% CAGR to 2031.
Note: Market size and forecast figures in this report are generated using Mordor Intelligence’s proprietary estimation framework, updated with the latest available data and insights as of January 2026.
Middle East And Africa Management Consulting Services Market Trends and Insights
Drivers Impact Analysis*
| Driver | (~) % Impact on CAGR Forecast | Geographic Relevance | Impact Timeline |
|---|---|---|---|
| Digital-transformation budgets rise under GCC vision programs | +3.2% | Saudi Arabia, United Arab Emirates, Qatar, Bahrain, Oman, Kuwait | Medium term (2-4 years) |
| Public-sector outsourcing of strategy formulation accelerates | +2.8% | Saudi Arabia, United Arab Emirates, Egypt, South Africa | Medium term (2-4 years) |
| Private-equity deployment into Africa boosts demand for due-diligence advisory | +2.1% | Nigeria, South Africa, Egypt, Kenya, Ghana | Short term (≤ 2 years) |
| Race for ESG and green-finance compliance consulting | +1.9% | GCC and South Africa | Long term (≥ 4 years) |
| Global capability centers relocating to Middle East drive multi-function consulting needs | +1.5% | United Arab Emirates, Saudi Arabia, Qatar | Short term (≤ 2 years) |
| SME uptake of online and virtual consulting platforms expands TAM | +0.7% | United Arab Emirates, South Africa, Egypt and wider MEA | Long term (≥ 4 years) |
| Source: Mordor Intelligence | |||


Digital-Transformation Budgets Rise Under GCC Vision Programs
Saudi Arabia has earmarked SAR 120 billion (USD 32 billion) for information-technology infrastructure between 2024-2029, including a mandate that 70% of government services migrate to cloud platforms by 2025. Ministries, therefore, turn to advisors for enterprise architecture design, legacy system migration, and change management. The United Arab Emirates is pursuing 100% digital service delivery under its Digital Government Strategy 2025, prompting complex tenders that favor firms with deep public-sector credentials. Qatar’s Digital Agenda 2030 allocates QAR 8 billion (USD 2.2 billion) to smart-city pilots and AI-enabled citizen services, again bringing in consultants for multi-year strategic roles. Localization clauses that require in-country data residency and a nationalized workforce further tilt awards toward practices with local delivery hubs. Together, these initiatives ensure a steady pipeline for the Middle East and Africa management consulting services market.
Public-Sector Outsourcing of Strategy Formulation Accelerates
The Public Investment Fund in Saudi Arabia has engaged external advisors on more than 40 gigaprojects with combined capital outlays exceeding USD 500 billion[1]Public Investment Fund, “Annual Report 2024,” pif.gov.sa. In 2024, the United Arab Emirates directed all federal entities with budgets above AED 500 million (USD 136 million) to conduct independent strategic reviews triennially, instantly creating a recurring need for third-party consultants. Egypt’s Sovereign Fund outsourced feasibility studies for infrastructure and healthcare assets worth EGP 200 billion (USD 6.5 billion), while South Africa now obliges state-owned enterprises seeking turnaround funds to procure external advice. Although price-weighted procurement compresses margins, the volume and complexity of these mandates enlarge total spending, thereby widening the Middle East and Africa management consulting services market.
Private-Equity Deployment into Africa Boosts Demand for Due-Diligence Advisory
African private-equity fundraising touched USD 6.1 billion in 2024, with 68% of capital committed to South Africa, Nigeria, and Egypt. Sponsors increasingly seek commercial, operational, and ESG diligence to secure quality assets. Nigeria’s fintech sector logged 12 PE-backed deals in 2025 requiring regulatory assessments under revised Central Bank guidelines. South Africa drew USD 1.8 billion into renewables, driving advisory demand for technical and social-impact evaluations. Egypt’s privatization pipeline also relies on advisors for valuation and investor readiness, reinforcing the expansion of the Middle East and Africa management consulting services market.
Race for ESG and Green-Finance Compliance Consulting
The United Arab Emirates raised USD 2 billion through its inaugural green bond in 2024 and rolled out a Sustainable Finance Framework that obliges listed firms to publish annual ESG disclosures[2]UAE Ministry of Finance, “Sustainable Finance Framework 2024,” mof.gov.ae. Saudi Arabia’s Capital Market Authority introduced phased ESG reporting requirements in 2024. South Africa aligned its stock-exchange guidance with IFRS S1 and S2 in 2025, while Egypt rolled out a green taxonomy the year prior. Consultants have therefore become essential for gap analyses, data management systems, and assurance readiness, further expanding the Middle East and Africa management consulting services market.
Restraints Impact Analysis*
| Restraint | (~) % Impact on CAGR Forecast | Geographic Relevance | Impact Timeline |
|---|---|---|---|
| Shortage of senior bilingual consultants inflates fee rates | -1.8% | Saudi Arabia, United Arab Emirates, Qatar, Egypt | Short term (≤ 2 years) |
| Procurement-led price compression at state-owned enterprises | -1.4% | Saudi Arabia, United Arab Emirates, Egypt, South Africa | Medium term (2-4 years) |
| Cross-border data localisation rules complicate multi-country projects | -0.9% | United Arab Emirates, Saudi Arabia, South Africa, Nigeria | Medium term (2-4 years) |
| Fragmented regulatory licensing for foreign-owned boutiques | -0.6% | GCC states, Nigeria, Egypt | Long term (≥ 4 years) |
| Source: Mordor Intelligence | |||
Shortage of Senior Bilingual Consultants Inflates Fee Rates
Demand for Arabic-English bilingual directors outpaces supply by roughly 30%, forcing firms to raise billing rates by up to 20% year on year. Emiratisation quotas in the United Arab Emirates require 2% of skilled roles to be held by nationals by 2026, spurring signing bonuses of AED 200,000 (USD 54,000). Saudi Arabia’s Nitaqat program tightens domestic hiring targets, compelling firms to establish costly training academies. Higher fee structures and delivery delays temper the addressable demand for Middle East and Africa management consulting services.
Procurement-Led Price Compression at State-Owned Enterprises
Saudi Arabia’s 2024 procurement law mandates that price account for 60% of bid evaluation, prompting aggressive discounting and margin squeeze. Egypt aims to trim advisory spend by 25% over three years, while South Africa caps daily consulting rates for senior staff at ZAR 8,000 (USD 440). The resulting price pressure restrains overall value growth in the MEA management consulting services market.
*Our forecasts treat driver/restraint impacts as directional, not additive. The impact forecasts reflect baseline growth, mix effects, and variable interactions.
Segment Analysis
By Service Type: Technology Advisory Maintains Leadership
The technology-advisory segment accounted for 29.11% of 2025 revenue, securing the largest share of the MEA management consulting services market. It is also projected to compound at 12.67% through 2031, marking it a cornerstone driver of the MEA management consulting services market size in absolute terms. Saudi Arabia’s National Cybersecurity Authority mandated that all government agencies localize sensitive workloads by 2027, sparking USD 800 million in architecture and compliance engagements. The United Arab Emirates’ AI Strategy 2031 aims to deploy machine learning across nine sectors, fueling high-margin advisory on data governance and bias testing.
Strategy consulting accounted for just under one-quarter of 2025 spend, buoyed by economic diversification agendas and African turnaround projects. Financial-advisory mandates clustered around privatizations and distressed-asset restructurings, securing an 18% share. Human-capital consulting supports workforce nationalization and hybrid-work transitions, while operations consulting attends to supply-chain and procurement redesign. Collectively, these service lines underscore the multi-disciplinary nature of the MEA management consulting services market.


By Consulting Theme: Digital Transformation Dominates
Digital transformation accounted for 38.29% of thematic revenue in 2025, making it the largest pillar in the MEA management consulting services market. Within that umbrella, AI-driven transformation is poised to grow 12.88% a year to 2031, reflecting clients’ shift from digitization to algorithmic automation. The MEA management consulting services market for operational-excellence programs remains sizable, though lean initiatives are plateauing as low-hanging efficiencies are realized.
Risk and compliance consulting thrives on proliferating data-protection statutes, while ESG mandates propel sustainability advisory. In 2025, the United Arab Emirates recorded the highest enterprise adoption rate for generative AI in the region at 42%. Saudi Arabia’s USD 40 billion AI investment vehicle further inflates opportunity pipelines. These developments amplify demand for consultancies able to synthesize technology, regulatory, and change-management competencies.
By End-User Industry: Government Remains Anchor, Energy Races Ahead
Government and public-sector entities accounted for 26.54% of 2025 billings, the largest share in the MEA management consulting services market. The segment continues to commission multi-year programs for digital government, macroeconomic diversification, and performance management. Energy and utilities, though smaller in absolute terms, are growing fastest at a 12.93% CAGR, underpinned by renewable generation targets and grid modernization.
Saudi Arabia intends to increase renewable capacity to 58.7 GW by 2030, a leap that catalyzes project-finance advisory and grid-integration studies. The United Arab Emirates’ clean-energy push and Egypt’s solar and wind contracts broaden the opportunity set. Financial services, telecom, and healthcare round out the mix, each facing sector-specific technology and regulatory disruptions that necessitate advisory support.
By Enterprise: Large Clients Dominate, SMEs Catch Up through Virtual Delivery
Large enterprises accounted for 78.31% of 2025 revenue, anchoring the MEA management consulting services market. They commission broad, multi-function engagements spanning strategy, technology, and organizational redesign. Yet small and medium enterprises will expand at 13.54% CAGR to 2031 as virtual consulting platforms slash engagement thresholds by 30-40%. Programs such as Saudi Arabia’s Monsha’at voucher scheme and the Khalifa Fund in the United Arab Emirates subsidize advisory fees, nudging smaller firms toward professional consulting services and enlarging the MEA management consulting services market.
The rising SME contribution brings shorter project cycles but higher client counts, increasing operational complexity for providers. Firms able to package modular, cloud-delivered toolkits are positioned to capture this incremental growth without diluting margins.
Geography Analysis
Saudi Arabia’s consulting demand rests on its transition from operator to investor and regulator. Projects such as NEOM and The Red Sea are stand-alone economic zones with separate legal and tax regimes, each necessitating advisory on regulatory design and performance metrics[3]NEOM, “Project Overview,” neom.com. The Public Investment Fund’s USD 700 billion portfolio, therefore, requires continuous sector selection and capital-allocation counsel.
The United Arab Emirates spreads spending across federal and emirate-level programs. Abu Dhabi’s economic vision emphasizes heavy-industry diversification, while Dubai remains committed to tourism, logistics, and knowledge-economy agendas. The interplay of overlapping jurisdictions complicates procurement but enlarges the scope for governance and integration consulting.
Qatar’s consulting market is tightly linked to three anchor clients, QatarEnergy, Qatar Investment Authority, and the Ministry of Finance, making revenue sensitive to hydrocarbon cycles. Nonetheless, the North Field East expansion and the National Development Strategy trigger recurring mandates in joint venture structuring and digital government.
South Africa relies on advisory for state-owned-enterprise reform and renewable-energy procurement. Egypt’s privatization roadmap through 2027 invites valuation and investor-marketing engagements, while Nigeria’s fintech and telecom ecosystems dominate spending even as security and currency volatility curb on-the-ground expansion by foreign firms. Kenya, Morocco, and Ghana offer niche opportunities, especially in automotive and aerospace supply chains, but currently lack the scale to shift the overall MEA management consulting services market.
Competitive Landscape
The top ten global firms together account for about 60% of revenue, indicating a medium concentration in the MEA management consulting services market. Accenture acquired Inspirage in 2024 to bolster cloud-consulting capacity in Riyadh and Dubai, adding sector expertise in manufacturing and supply chain[4]Accenture, “Latest Acquisitions,” newsroom.accenture.com. Deloitte opened a Riyadh office in 2025, focused on ESG and sovereign wealth advisory. PwC partnered with the Saudi Digital Government Authority to craft an AI-governance framework and, in turn, secured preferred-advisor status for AI policy design.
Regional boutiques thrive in niches such as Islamic finance, sovereign-wealth structuring, and francophone Africa. Technology platforms also drive differentiation, with firms deploying proprietary data analytics engines that shorten engagement cycles by 25% and improve margin capture. Meanwhile, ISO 20700 adoption by GCC governments benchmarks delivery quality, pushing low-cost offshore entrants to invest in certification or risk exclusion. The ability to marry sector depth, local talent, and digital delivery is becoming decisive in winning complex, multi-year mandates within the MEA management consulting services market.
Middle East And Africa Management Consulting Services Industry Leaders
Accenture plc
Boston Consulting Group
Bain and Company
Deloitte Touche Tohmatsu Ltd
McKinsey and Company
- *Disclaimer: Major Players sorted in no particular order

Recent Industry Developments
- December 2025: MHA plc has formally entered into an agreement to acquire Moore Stephens LLC, an audit practice, and Moore Stephens Consulting LLC, a tax and consulting services firm. Both entities are headquartered in Dubai and are collectively referred to as MS UAE.
- September 2025: EY announced the integration of BI Consulting into its MENA Consulting team. The expertise of the MENA-based management consulting firm, specializing in people, organization, strategy implementation, and more, will strengthen EY’s People Consulting and Business Consulting solutions.
- April 2025: EY-Parthenon broadened its global brand to cover 25,000 professionals across 150 countries backed by a USD 250 million AI-platform investment, reinforcing integrated delivery in MEA.
- January 2025: Searce, the AI-powered, engineering-led modern tech consultancy, expanded its presence into the Middle East, with its headquarters in the UAE.


Research Methodology Framework and Report Scope
Market Definitions and Key Coverage
Our study defines the Middle East & Africa management consulting services market as fee-based, third-party advisory engagements that deliver strategic, operational, financial, human-capital, and technology counsel to public- and private-sector clients; revenue is recorded when consulting effort is rendered or retained.
Scope exclusion: Pure IT outsourcing, audit, tax, legal opinion, temporary staffing, and facilities management are outside the frame.
Segmentation Overview
- By Service Type
- Operations Consulting
- Strategy Consulting
- Financial Advisory
- Technology Advisory
- Human-Capital and Change Management
- By Consulting Theme
- Digital Transformation
- ESG / Sustainability
- Operational Excellence
- Risk and Compliance
- Other Themes
- By End-user Industry
- Financial Services
- Life Sciences and Healthcare
- IT and Telecommunications
- Government and Public Sector
- Energy and Utilities
- Retail and E-commerce
- By Enterprise
- Large Enterprises
- Small and Medium Enterprises
- By Country
- Saudi Arabia
- United Arab Emirates
- Qatar
- South Africa
- Egypt
- Nigeria
- Rest of the Middle East and Africa
Detailed Research Methodology and Data Validation
Primary Research
Analysts next hold structured calls with partners and practice leads at regional consulting firms, procurement chiefs in ministries, and CIOs across finance, healthcare, energy, and telecom hubs from Riyadh to Lagos. These discussions validate utilization rates, average daily bill rates, emerging service themes, and anticipated budget swings, giving us live sentiment that refines secondary assumptions.
Desk Research
We start by extracting baseline spending signals from governmental statistics offices such as Saudi GASTAT, UAE FCSC, Statistics South Africa, and Nigeria's NBS, and then link them with trade-weighted GDP, AfCFTA customs filings, and World Bank development-budget trackers. Annual reports and 10-Ks filed by listed advisory networks supply segment revenue that we mine through D&B Hoovers and Dow Jones Factiva, while GCC tender portals and African Infrastructure Project Preparation Facility notices surface public-sector contract values. Macro stability indicators, oil price averages, sovereign capital-expenditure lines, and enterprise digital-transformation allocations published by entities such as OPEC, IMF, and Smart Dubai anchor our demand drivers. The sources cited above illustrate the spectrum used; many more inputs were reviewed during desk work.
Market-Sizing & Forecasting
We adopt a top-down build: consultant-fee pools are reconstructed from non-oil GDP, government operating budgets, and private capital-expenditure series, which are then cross-checked through a bottom-up sample of partner head-count × average billable days × blended bill rate collected during interviews. Key variables include 1) non-oil GDP growth, 2) Vision-program development spend, 3) enterprise digital-transformation outlays, 4) cross-border M&A deal count, and 5) consultant bill-rate index. A multivariate regression links these indicators to historical fee pools, while scenario analysis stress-tests oil-price and FX shocks. Gaps in bottom-up samples are bridged by applying median utilization and pricing gleaned from peers of similar scale.
Data Validation & Update Cycle
Outputs pass three-layer checks: statistical outlier scans, peer-value comparison, and senior-analyst review. We refresh the model annually and trigger mid-cycle revisions when material policy, currency, or megaproject announcements emerge; a final pre-publication sweep ensures readers receive the most current view.
Why Mordor's MEA Management Consulting Services Baseline Deserves Confidence
Published estimates often diverge because firms choose differing geographic cuts, include adjacent IT services, or freeze exchange rates at contrasting points.
Key gap drivers here stem from whether Africa is fully covered, if staff-augmentation revenue is folded in, and how bill-rate inflation is projected; this is where Mordor Intelligence maintains disciplined scope control, yearly refreshes, and transparent variable selection.
Benchmark comparison
| Market Size | Anonymized source | Primary gap driver |
|---|---|---|
| USD 10.75 B | Mordor Intelligence | - |
| USD 10.27 B | Regional Consultancy A | excludes small enterprise segment; uses three-year currency average |
| USD 8.30 B | Trade Journal B | covers GCC only; omits Africa and project-based technology advisory |
The comparison shows that while other publishers either narrow geography or smooth currency swings, our analysts keep the full region in scope and mirror current-year exchange rates, giving decision-makers a balanced, traceable baseline.


Key Questions Answered in the Report
How fast is consulting spend growing in the Middle East and Africa?
The MEA management consulting services market is projected to register a 12.21% CAGR between 2026 and 2031, outpacing global averages.
Which country accounts for the largest share of advisory fees?
Saudi Arabia led with 51.23% of regional revenue in 2025 and is forecast to keep expanding at a 13.15% CAGR.
Which service line brings in the most revenue?
Technology advisory held a 29.11% share of 2025 billings and remains the highest-earning segment.
What is driving the surge in energy-sector consulting?
National renewable-energy targets and grid-modernization programs across Saudi Arabia, the United Arab Emirates, and South Africa are lifting demand for strategy, financing, and implementation support.
Are small firms benefiting from the consulting boom?
Yes, SME engagement is expected to grow at 13.54% a year through 2031 as virtual consulting platforms lower cost and access barriers.
How concentrated is the market among global majors?
The top ten firms capture about 60% of regional revenue, leaving room for specialized local practices to address niche mandates.
Page last updated on:


