Market Overview
| Study Period | 2021 - 2031 |
|---|---|
| Forecast Data Period | 2026 - 2031 |
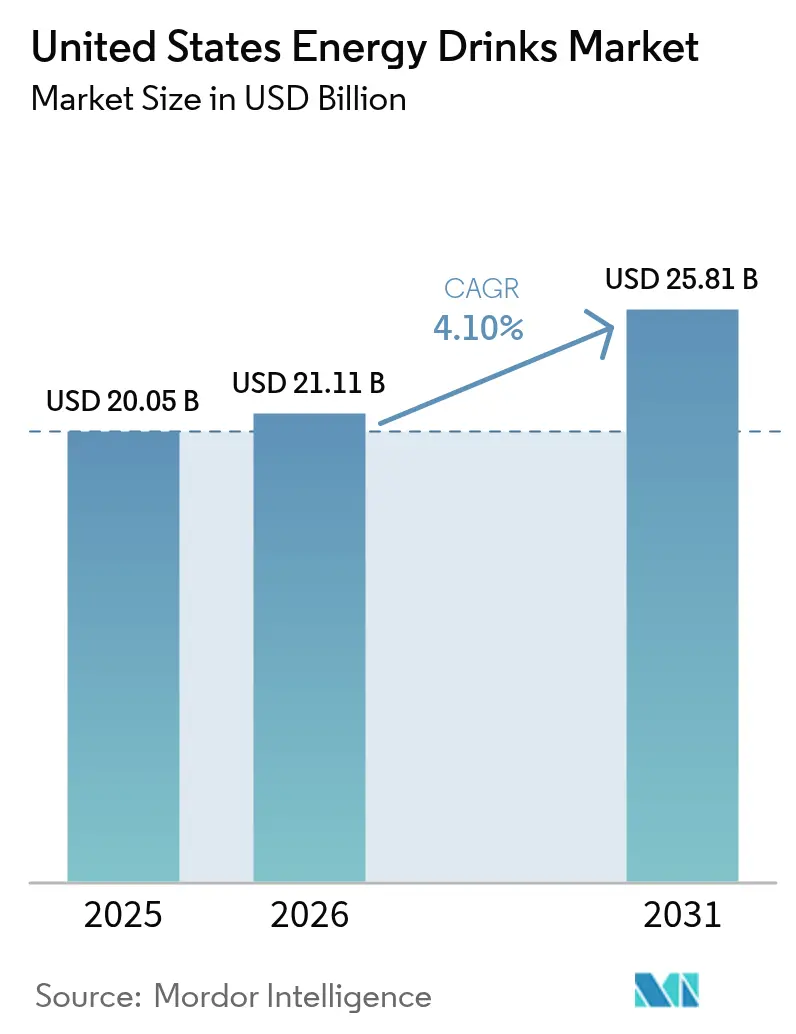
| Base Year Market Size (2025) | USD 20.05 Billion |
| Market Size (2026) | USD 21.11 Billion |
| Market Size (2031) | USD 25.81 Billion |
| Growth Rate (2026 - 2031) | 4.10% CAGR |
| Market Concentration | High |
Major Players
*Disclaimer: Major Players sorted in no particular order Image © Mordor Intelligence. Reuse requires attribution under CC BY 4.0. |
|
United States Energy Drinks Market Analysis by Mordor Intelligence
The United States energy drinks market size is projected to reach from USD 20.05 billion in 2025, to USD 21.11 billion in 2026, and USD 25.81 billion by 2031, with a CAGR of 4.10% from 2026 to 2031. Consumer demand is shifting from high-volume products to premium offerings that incorporate cognitive benefits, botanical caffeine sources, and sugar-free formulations. Natural and organic variants are experiencing rapid growth, while metal cans remain the dominant packaging format. However, glass bottles are gaining popularity in on-premise venues. Off-trade retail continues to be the primary distribution channel, but on-trade outlets such as gyms, bars, and entertainment spaces are recovering as social activities resume. Increasing regulations and changing nutrient-content guidelines in the United States are driving formulators to develop lower-dose, multifunctional blends with region-specific claims.
Key Report Takeaways
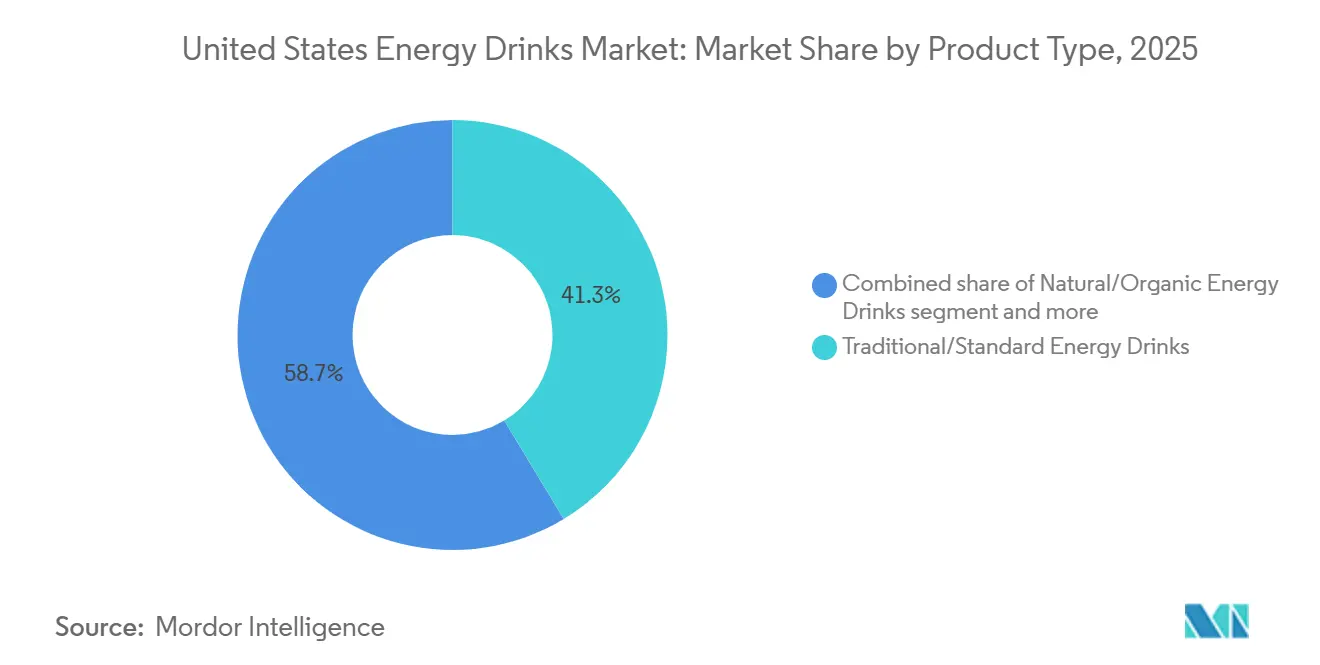
- By product type, traditional/standard formulations led with a 41.34% Energy drinks market share in 2025, whereas natural/organic lines are advancing at a 5.89% CAGR through 2031.
- By packaging, metal cans accounted for 55.19% of the Energy drinks market size in 2025, while glass bottles are projected to expand at a 5.45% CAGR to 2031.
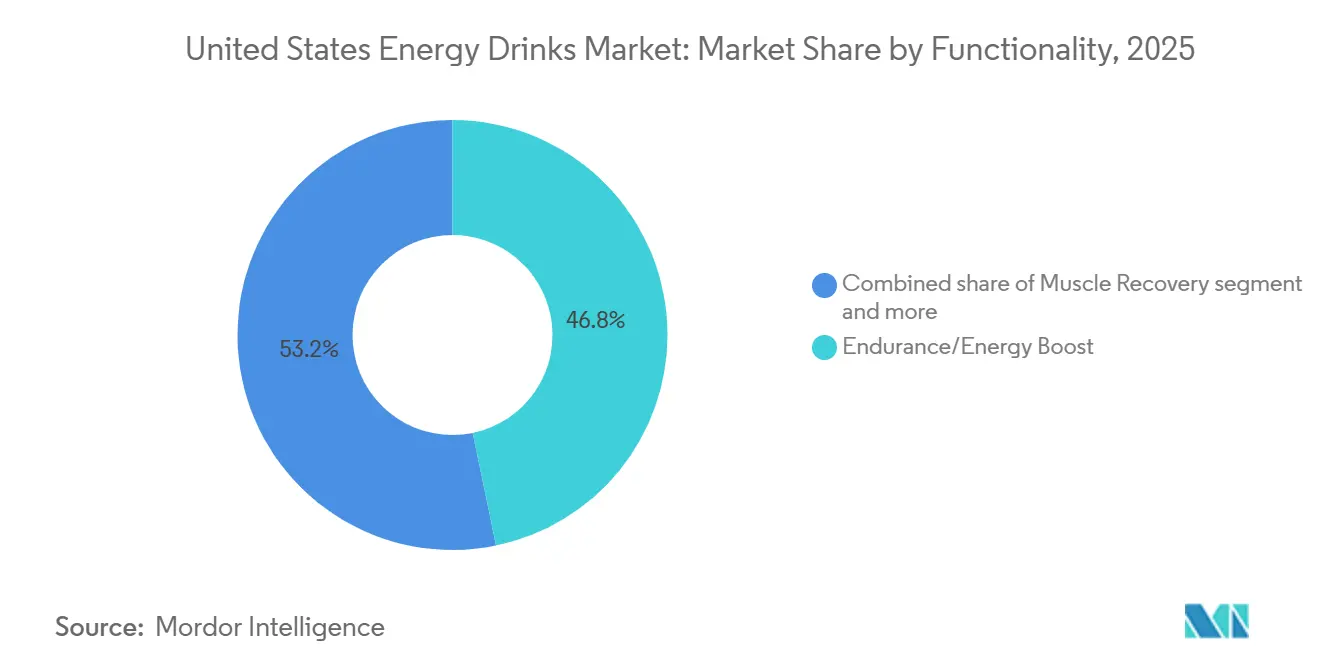
- By functionality, endurance/energy boost-focused SKUs captured 46.76% revenue in 2025, yet muscle-recovery drinks enriched with amino acids are forecast to grow at a 5.37% CAGR.
- By distribution, off-trade channels generated 93.40% of 2025 sales, while on-trade venues are expected to grow at a 5.71% CAGR through 2031.
Note: Market size and forecast figures in this report are generated using Mordor Intelligence’s proprietary estimation framework, updated with the latest available data and insights as of 2026.
United States Energy Drinks Market Trends and Insights
Drivers Impact Analysis*
| Driver | (~) % Impact on CAGR Forecast | Geographic Relevance | Impact Timeline |
|---|---|---|---|
| Functional-health positioning and cognitive-performance claims | +0.8% | New York, Los Angeles, and Chicago | Medium term (2-4 years) |
| Sugar-free line extensions targeting Gen-Z wellness seekers | +0.6% | Major urban markets with health-conscious youth, including Boston, San Francisco, and Austin | Short term (≤ 2 years) |
| Rapid rise of clean-label natural caffeine sources | +0.5% | California, New York, and Pacific Northwest | Medium term (2-4 years) |
| Digital adoption enhancing direct-to-consumer sales | +0.4% | Nationwide | Short term (≤ 2 years) |
| Strong influence of digital marketing and social media | +0.5% | Nationwide, particularly among Gen Z and Millennial | Short term (≤ 2 years) |
| Rising popularity of energy shots and specialized performance-focused formulations | +0.4% | Los Angeles, Miami, Boston, and Austin | Medium term (2-4 years) |
| Source: Mordor Intelligence | |||


Functional-health positioning and cognitive-performance claims
The energy drinks market is transitioning from stimulant-focused beverages to multifunctional wellness solutions, influenced by changing consumer preferences for holistic health. Consumers now seek drinks that provide more than hydration and energy boosts, with added benefits like immune support, cognitive enhancement, and stress management. This shift is driving innovation in product development and marketing strategies within the category. Younger demographics, particularly Gen Z and Millennials, are leading this change. Instead of relying solely on high caffeine content, they prefer balanced functionality that promotes productivity, mental clarity, and emotional well-being [1]Source: Treatt, "USA Consumer driver: Functional", treatt.com. Ingredients such as nootropics, L-theanine, B vitamins, adaptogens, and botanical extracts are increasingly included to improve focus, memory, and sustained cognitive performance without causing excessive jitters or energy crashes.
Sugar-free line extensions targeting Gen-Z wellness seekers
The growing consumer preference for clean-label products is becoming a significant growth driver in the United States energy drinks market. In 2025, clean-label preference increased to 13%, up from 11% in 2024, indicating a consistent rise in demand for transparency, recognizable ingredients, and minimally processed formulations [2]Source: Centers for Disease Control and Prevention. , "Diagnosed Diabetes -Total, Adults Aged 18+ Years, Age-Adjusted Percentage, National", gis.cdc.gov. This trend highlights a broader shift in purchasing behavior, with ingredient scrutiny playing a critical role in beverage choices, particularly among younger and health-conscious consumers. In the energy drinks segment, this trend is influencing caffeine sourcing strategies. Synthetic caffeine is increasingly being replaced or supplemented with natural alternatives such as green coffee extract, guarana, yerba mate, and tea-derived caffeine. These natural sources enable brands to promote a "naturally derived energy" message, which appeals to consumers concerned about artificial additives and chemical-sounding ingredients. Additionally, the perception of natural caffeine as smoother, cleaner, and less likely to cause jitters enhances its attractiveness to the target audience.
Rapid rise of “clean-label” natural caffeine sources
The increasing prevalence of metabolic health concerns in the United States is driving significant changes in consumer preferences within the energy drinks market, accelerating the demand for sugar-free formulations. In 2024, approximately 1.58 million individuals in the U.S. were newly diagnosed with diabetes, compared to 1.49 million in 2023 [3]Source: International Food Information Council (IFIC), "A Focus On Dietary Guidance & Food Labeling", ific.org. This consistent rise in diagnoses is heightening awareness of sugar consumption, insulin resistance, and long-term metabolic health, particularly among younger demographics who are increasingly focused on preventative wellness. Gen Z consumers are playing a pivotal role in reshaping energy drink demand. Unlike previous generations, who were primarily attracted to high-caffeine products and bold branding, Gen Z emphasizes functional performance combined with health-conscious consumption. This group actively reviews ingredient lists, tracks macronutrients, and utilizes digital health platforms to understand the risks associated with excessive sugar intake. Consequently, sugar-free energy drinks are no longer viewed solely as "diet alternatives" but are now considered standard options that align
Digital adoption is enhancing direct-to-consumer sales
E-commerce and direct-to-consumer channels are transforming distribution economics by allowing niche brands to bypass traditional retail intermediaries. This approach enables these brands to achieve higher profit margins while collecting first-party consumer data. Subscription models and personalized bundles, which provide curated assortments based on factors such as flavor preferences, functional goals, or dietary restrictions, are becoming increasingly popular among digitally native consumers. However, challenges persist in managing fulfillment costs and last-mile logistics, particularly for single-serve, refrigerated products. In response, convenience retailers are adopting strategies such as mobile ordering and rapid-delivery partnerships. For example, 7-Eleven's proprietary 7NOW app offers energy drinks with delivery times under 30 minutes. This approach allows 7-Eleven to compete with platforms like Amazon Fresh and DoorDash while maintaining control over customer relationships and merchandising.
Restraint Impact Analysis*
| Restraint | (~) % Impact on CAGR Forecast | Geographic Relevance | Impact Timeline |
|---|---|---|---|
| Health concerns regarding high caffeine and sugar | -0.5% | Nationwide, especially in health-conscious urban markets like New York, San Francisco, and Boston | Short term (≤ 2 years) |
| Negative perception surrounding synthetic additives | -0.3% | Los Angeles, New York, and Seattle | Medium term (2-4 years) |
| Increasing competition from healthier beverage categories | -0.4% | Nationwide | Medium term (2-4 years) |
| Increasing regulatory and labeling pressures | -0.4% | Across the United States | Long term (≥ 4 years) |
| Source: Mordor Intelligence | |||
Health concerns regarding high caffeine and sugar
Health concerns related to excessive caffeine and sugar consumption remain a significant challenge in the United States energy drinks market. The category has consistently faced scrutiny from public health organizations, healthcare professionals, and consumer advocacy groups due to its links to elevated heart rate, high blood pressure, sleep disturbances, and metabolic risks. As health literacy improves and consumers become more conscious of product ingredients, these concerns are increasingly shaping purchasing behavior. The high sugar content in traditional energy drinks has been associated with obesity, type 2 diabetes, and other metabolic disorders, which are already widespread in the U.S. population. Additionally, high caffeine levels raise concerns about dependency, anxiety, cardiovascular strain, and adverse effects, particularly among adolescents and young adults. Media coverage and regulatory focus on caffeine-related incidents further contribute to negative perceptions, especially among parents and older consumers.
Negative perception surrounding synthetic additives
In the United States, an increasing number of consumers are expressing concerns about artificial ingredients and synthetic additives in beverages. Energy drinks, which often include synthetic sweeteners, artificial colors, preservatives, and chemical stimulants, have come under scrutiny due to potential health risks such as cardiovascular strain, sleep disturbances, and long-term metabolic effects. This trend is particularly pronounced among millennials and Gen Z consumers, who emphasize the importance of "clean-label" and naturally sourced products. The negative perception of synthetic additives reduces purchase intent, limiting the market's ability to appeal to both mainstream and health-conscious consumers. Brands that rely heavily on chemical formulations may face challenges in building trust and expanding their customer base, especially as products with natural ingredients and organic certifications gain popularity. As a result, the dependence on synthetic additives poses a barrier to market growth and may impede adoption among wellness-focused and safety-conscious consumers.
*Our forecasts treat driver/restraint impacts as directional, not additive. The impact forecasts reflect baseline growth, mix effects, and variable interactions.
Segment Analysis
By Product Type: Traditional Formulations Face Natural Innovation
Traditional/standard energy drinks accounted for 41.34% of global revenue in 2025, driven by the widespread distribution and established brand equity of companies like Red Bull, Monster, and Rockstar. However, natural/organic energy drinks are projected to grow at an annual rate of 5.89% through 2031, supported by increasing demand for clean-label products and premium pricing. Energy shots, typically concentrated 2-ounce formats popularized by brands such as 5-Hour Energy, cater to time-constrained professionals and long-haul drivers seeking portability and quick effects. Despite this, their growth has stagnated as larger ready-to-drink cans now offer similar functional ingredients at a lower cost per serving.
Non-carbonated energy drinks are gaining traction among consumers who prefer beverages without carbonation, particularly during or after physical activity. These products are often formulated with added electrolytes, branched-chain amino acids, and adaptogens, bridging the gap between energy drinks and sports hydration solutions. Additionally, other energy drink formats, such as fortified waters, sparkling energy waters, and hybrid coffee-energy blends, are emerging as manufacturers explore new formats and occasion-based positioning. However, the increasing fragmentation across these micro-categories presents challenges for retail assortment planning and consumer navigation.


By Packaging Type: Sustainability Drives Glass Innovation
Metal cans accounted for 55.19% of the global packaging market share in 2025, driven by aluminum's recyclability, lightweight properties, and compatibility with high-speed canning lines. PET bottles continue to dominate in value-oriented and larger-format SKUs, offering cost benefits and shatter resistance for multi-serve or take-home occasions. However, they face challenges from the increasing implementation of single-use plastics bans and deposit-return schemes across certain U.S. states.
Glass bottles, while holding a smaller market share, are projected to grow at a rate of 5.45% through 2031. This growth is supported by demand from on-premise venues such as bars, restaurants, and nightclubs, where glass packaging conveys a sense of premiumization and supports higher per-serve pricing. Additionally, niche brands are promoting glass as a sustainable and inert packaging material that preserves flavor integrity. In the United States, aluminum's recycling rate declined to 43% in 2023 from a previous peak of 52%, due to contamination issues and gaps in municipal collection infrastructure. However, global recycling rates remain higher at 71%, with closed-loop recycling, where beverage cans are recycled back into beverage cans, accounting for 33% of throughput.
By Functionality: Muscle Recovery Formulations Gain Share
Endurance/energy-boost formulations are projected to account for 46.76% of 2025 revenue, driven by the well-established ergogenic effects of caffeine and the widespread inclusion of taurine in traditional recipes. However, muscle-recovery variants are growing at an annual rate of 5.37%, incorporating ingredients such as branched-chain amino acids, creatine, and beta-alanine to attract gym-goers and athletes seeking post-workout recovery alongside stimulation. Other functional claims, including cognitive enhancement, hydration, and immune support, are becoming more prevalent as manufacturers integrate vitamins, electrolytes, and botanical extracts into their formulations. This trend is blurring category boundaries and creating consumer confusion, which may ultimately lead to a preference for simplified, single-benefit products.
The International Society of Sports Nutrition's position highlights that energy drink doses containing 80 milligrams of caffeine and 1,000 milligrams of taurine may not significantly enhance performance compared to higher doses. This suggests that brands must either increase active ingredient concentrations to clinically effective levels or acknowledge that their products primarily serve as caffeinated refreshments rather than true ergogenic aids. The tension between marketing claims and scientific evidence is expected to escalate as regulatory agencies and legal challenges increasingly scrutinize functional claims.
By Distribution Channels: On-Trade Recovery Lags Off-Trade Dominance
Off-trade channels, including supermarkets/hypermarkets, convenience stores, specialty retailers, and online platforms, accounted for 93.40% of global energy drink revenue in 2025. This dominance reflects the impulse-purchase nature of the category, widespread availability, and cost-per-serving advantages that support take-home consumption. Supermarkets and hypermarkets provide a wide assortment and frequent promotions; however, their energy drink sales per square foot are lower compared to convenience stores due to less frequent shopping trips and reduced impulse-purchase rates.
On-trade venues, such as bars, nightclubs, restaurants, gyms, and entertainment complexes, are projected to grow at a rate of 5.71% through 2031. This growth is driven by recovery from pandemic-related closures, increasing demand for experiential consumption, higher per-serve margins, and the resurgence of social occasions where energy drinks are either mixed with alcohol or consumed alongside food. Online retail, which includes e-commerce marketplaces, direct-to-consumer brand websites, and rapid-delivery applications, is expanding rapidly but from a relatively low base. Growth in this channel is limited by factors such as refrigeration requirements, shipping costs, and consumer preference for immediate product availability.
Geography Analysis
The United States is the largest and most established energy drinks market globally, driven by extensive urbanization, high disposable incomes, and a preference for convenience-oriented consumption. Major urban centers such as New York, Los Angeles, Chicago, and Houston act as key hubs for energy drink sales due to their dense populations, significant working-age demographic, and the presence of fitness, gaming, and college communities, key consumer groups for energy beverages. Retail distribution in these cities includes convenience stores, supermarkets, online platforms, and fitness outlets, making them vital revenue sources for market participants.
The West and Northeast regions exhibit higher per capita energy drink consumption, primarily due to greater health awareness, brand visibility, and active lifestyles. Conversely, the South and Midwest regions show steady growth potential, supported by expanding urban populations and increasing awareness of energy drinks among younger consumers. Cities with a strong college and university presence, such as Boston, Austin, and Raleigh, demonstrate concentrated demand for ready-to-drink and performance-oriented formulations, underscoring the impact of educational hubs on consumption patterns.
Geographic distribution of energy drink consumption is closely tied to lifestyle trends and retail infrastructure. Coastal states like California and New York tend to favor premium and natural ingredient-based energy drinks, reflecting a consumer preference for clean-label products. In contrast, central states primarily consume traditional, mainstream energy drink formulations. The growth of e-commerce across all regions has improved access to niche and emerging brands, reducing regional disparities over time. However, noticeable differences remain in flavor preferences, packaging choices, and pricing sensitivity across various areas.
Competitive Landscape
The U.S. energy drinks market is highly concentrated, with a mix of global leaders and innovative regional players dominating the landscape. Prominent brands such as Red Bull GmbH, Monster Beverage Corporation, and Rockstar, Inc. hold a significant market share through extensive marketing efforts, diverse product portfolios, and robust distribution networks. These companies allocate substantial resources to sponsorships, sports events, and digital campaigns to sustain brand visibility and appeal to young adult consumers, who represent the primary target demographic.
Emerging and niche players are reshaping the competitive environment by focusing on natural, organic, and functional energy drinks. These products cater to health-conscious consumers seeking alternatives to traditional synthetic formulations. Brands like Bang Energy and Reign Total Body Fuel are gaining traction by offering unique flavor profiles, added functional benefits such as electrolytes or amino acids, and influencer-driven marketing strategies. This shift is intensifying competition, compelling established players to innovate or introduce cleaner, "better-for-you" product lines.
Price competitiveness, distribution reach, and brand loyalty are critical factors for success in the U.S. energy drinks market. While global brands leverage economies of scale and strong retail presence, smaller regional players capitalize on niche positioning, direct-to-consumer channels, and localized marketing campaigns. As consumer preferences increasingly favor healthier and more sustainable options, the competitive landscape is expected to evolve. Both established and emerging brands are likely to focus on product innovation, sustainability initiatives, and personalized marketing strategies to differentiate themselves and capture market share.
United States Energy Drinks Industry Leaders
-
Living Essentials, LLC
-
Monster Beverage Corporation
-
PepsiCo, Inc.
-
Red Bull GmbH
-
Congo Brands LLC.
- *Disclaimer: Major Players sorted in no particular order

Recent Industry Developments
- February 2026: Mocean, a functional energy drink brand established by industry veteran Tony Vieira, has partnered with the wholesale marketplace Faire to expand its distribution network. This partnership enables independent retailers and shop owners to access Mocean products via Faire's wholesale platform, enhancing product availability and supporting the brand's growth beyond direct-to-consumer sales.
- October 2025: Grupo Jumex and AriZona Beverages have introduced Jumex Energy, a new energy drink line that combines Jumex’s fruit nectar blends with a performance formula designed to provide energy support. The product line includes lightly carbonated Mango and Strawberry flavors, each offering 150 mg of caffeine, along with vitamins C, B5, B6, B12, and a blend of taurine, guarana, and ginseng.
- July 2025: O'Neill Vintners & Distillers has launched Catalyst, an energy drink aimed at health-conscious consumers. Catalyst contains 120 mg of caffeine, 10 calories, zero sugar, and no artificial sweeteners, colors, or flavors. Its formula incorporates premium nootropics to enhance focus, mental clarity, and cognitive performance, complemented by plant-based caffeine and vitamins B12 and B6 to support metabolism and natural energy production.
- July 2025: Liquid Death has introduced Death Sparkling Energy Drink, featuring four flavors: Tropical Terror, Scary Strawberry, Orange Horror, and Murder Mystery. Each flavor contains 100 mg of caffeine, naturally sourced from coffee beans, along with added vitamins B12 and C.


United States Energy Drinks Market Report Scope
Energy Shots, Natural/Organic Energy Drinks, Sugar-free or Low-calories Energy Drinks, Traditional Energy Drinks are covered as segments by Soft Drink Type. Glass Bottles, Metal Can, PET Bottles are covered as segments by Packaging Type. Off-trade, On-trade are covered as segments by Distribution Channel.
By Product Type
| Traditional / Standard Energy Drinks |
| Energy Shots |
| Natural/Organic Energy Drinks |
| Sugar-Free/Low-Calorie Energy Drinks |
| Non‑Carbonated Energy Drinks |
| Other Energy Drinks |
By Packaging Type
| PET Bottles |
| Glass Bottles |
| Metal Can |
By Functionality
| Endurance/Energy Boost |
| Muscle Recovery |
| Others |
By Distribution Channels
| On-Trade | |
| Off-Trade | Supermarkets/Hypermarkets |
| Convenience Stores | |
| Specialty Stores | |
| Online Retail | |
| Other Distribution Channel |
| By Product Type | Traditional / Standard Energy Drinks | |
| Energy Shots | ||
| Natural/Organic Energy Drinks | ||
| Sugar-Free/Low-Calorie Energy Drinks | ||
| Non‑Carbonated Energy Drinks | ||
| Other Energy Drinks | ||
| By Packaging Type | PET Bottles | |
| Glass Bottles | ||
| Metal Can | ||
| By Functionality | Endurance/Energy Boost | |
| Muscle Recovery | ||
| Others | ||
| By Distribution Channels | On-Trade | |
| Off-Trade | Supermarkets/Hypermarkets | |
| Convenience Stores | ||
| Specialty Stores | ||
| Online Retail | ||
| Other Distribution Channel | ||


Market Definition
- Carbonated Soft Drinks (CSDs) - Carbonated soft drinks (CSDs) refer to non-alcoholic beverages that are carbonated and typically flavored, containing dissolved carbon dioxide to create effervescence. These beverages commonly include cola, lemon-lime, orange, and various fruit-flavored sodas. Marketed in cans, bottles, or fountain dispense.
- Juices - We have considered packaged juices which encompass non-alcoholic beverages derived from fruits, vegetables, or a combination thereof, processed and sealed in various packaging formats such as bottles, cartons, or pouches. Excluding fresh juices, this market segment involves commercially prepared and preserved juices, often with added preservatives and flavors.
- Ready-to-Drink (RTD) Tea and RTD Coffee - Ready-to-Drink (RTD) tea and RTD coffee are pre-packaged, non-alcoholic beverages that are brewed and prepared for consumption without further dilution. RTD tea typically includes various tea varieties, infused with flavors and sweeteners, and comes in bottles, cans, or cartons. Similarly, RTD coffee involves pre-brewed coffee formulations, often mixed with milk, sugar, or flavorings, and is conveniently packaged for on-the-go consumption.
- Energy Drinks - Energy drinks are non-alcoholic beverages formulated to provide a quick boost of energy and alertness. Whereas, sports drinks are beverages designed to hydrate and replenish electrolytes, particularly after physical exertion, exercise, or intense activity
| Keyword | Definition |
|---|---|
| Carbonated Soft Drinks | Carbonated soft drinks (CSDs) are a combination of carbonated water and flavouring, sweetened by sugar or a non-sugar sweeteners. |
| Standard Cola | Standard Cola is defined as the original flavor of cola soda. |
| Diet Cola | A cola-based soft drink containing no or low amounts of sugar |
| Fruit Flavored Carbonates | A carbonated beverage prepared from fruit juice/fruit flavor with carbonated water and containing sugar, dextrose, invert sugar or liquid glucose either singly or in combination. It may contain peel oil and fruit essences. |
| Juice | Juice is a drink made from the extraction or pressing of the natural liquid contained in fruit and vegetables. |
| 100% Juice | Fruit/vegetable juice made from fruit in the form of its juice with no water added to make up the volume. It is not permitted to add sugars, sweeteners, preservatives, flavourings or colourings to fruit juice. |
| Juice Drinks (up to 24% Juice) | Fruit/vegetable juice drinks with up to 24% fruits/vegetable extract. |
| Nectars (25-99% Juice) | Juices that can have between 25 and 99% of fruit, with the minimum legal limits defined depending on the type of fruit |
| Juice concentrates | Juice Concentrates are those form of juices when most of this liquid is removed resulting in a thick, syrupy product known as juice concentrate. |
| RTD Coffee | Packaged coffee beverages that are sold in a prepared form and are ready for consumption at the time of purchase. |
| Iced Coffee | An iced coffee is a cold version of coffee, usually a combination of hot espresso and milk with ice added to it. |
| Cold Brew Coffee | Cold brew also called cold water extraction or cold pressing is made by steeping ground coffee in room-temperature water for several hours. |
| RTD Tea | Ready-to-drink (RTD) tea is a packaged tea product ready for immediate consumption without brewing or preparation |
| Iced Tea | Ice tea or iced tea is a drink made from tea without milk but with sugar and sometimes fruit flavourings, drunk cold. |
| Green Tea | Green tea is a tea beverage which promotes mental alertness, relieving digestive symptoms and promoting weight loss. |
| Herbal Tea | Herbal tea beverages are made from the infusion or decoction of herbs, spices, or other plant material in hot water. |
| Energy Drink | A type of drink containing stimulant compounds, usually caffeine, which is marketed as providing mental and physical stimulation. They may or may not be carbonated and may also contain sugar, other sweeteners, or herbal extracts, among numerous possible ingredients. |
| Sugar-free or Low-calories Energy Drinks | Sugar-free or Low-calories Energy Drinks are sugar-free, artificially sweetened energy drinks with few or no calories. |
| Traditional Energy Drink | Traditional Energy Drinks are functional soft drinks containing ingredients designed to boost the consumer's energy. |
| Natural/Oraganic Energy Drinks | Natural/Organic energy drinks are energy drinks free of artificial sweeteners and synthetic colorings. Instead, they contain naturally derived ingredients such as green tea, yerba mate, and botanical extracts. |
| Energy Shots | A small but highly concentrated energy drink that contains large amounts of caffeine and/or other stimulants. The quantity is comparatively smaller compared to energy drinks. |
| Sports Drink | Sports drinks are beverages designed specifically for the rapid supply of fluid, carbohydrates, and electrolytes before, during or after exercise. |
| Isotonic | Isotonic drinks contain similar concentrations of salt and sugar as in the human body, and are designed to quickly replace fluids lost during exercise but with an increase of carbohydrate. |
| Hypertonic | Hypertonic drinks have a higher concentration of salt and sugar than the human body. They are best drunk after exercise as it is important to replace glycogen levels quickly after exercise. |
| Hypotonic | Hypotonic drinks are designed to quickly replace fluids lost during exercise. They have very low carbohydrate content and a lower concentration of salt and sugar than the human body. |
| Electrolyte-Enhanced Water | Electrolyte water is water infused with electrically-charged minerals, such as sodium, potassium, calcium, and magnesium. |
| Protein-based Sport Drinks | Protein-based sports drinks are those sports drinks which has added protein in it that will improve performance and reduce muscle protein breakdown. |
| On-Trade | The on-trade refers to places that sell beverages for immediate consumption on the premises like bars, restaurants, and pubs |
| Off-Trade | Off-trade usually means places like liquor stores, supermarkets and other places where you don't consume the beverage right away. |
| Convenience Store | A retail business that provides the public with a convenient location to quickly purchase a wide variety of consumable products and services, generally food and gasoline. |
| Specialty store | A specialty store is a shop/store that carries a deep assortment of brands, styles, or models within a relatively narrow category of goods |
| Online Retail | Online retail is a type of eCommerce whereby a business sells goods or services directly to consumers from a website. |
| Aseptic Packaging | Aseptic packaging refers to the filling of a cold, commercially sterile product under sterile conditions into a presterilized container and closure under sterile conditions to form a seal that effectively excludes microorganisms. These includes tetra packs, cartons, pouches etc. |
| PET Bottle | PET bottle means a bottle made of polyethylene terephthalate. |
| Metal Cans | Metal containers made of aluminum or tin- plated or zinc-plated steel, which are commonly used for packaging food, beverages or other products. |
| Disposable Cups | Disposable Cup means a cup or other container designed for single use to serve beverages, such as water, cold drinks, hot drinks and alcoholic beverages. |
| Gen Z | A way of referring to the group of people who were born in the late 1990s and early 2000s. |
| Millenial | Anyone born between 1981 and 1996 (ages 23 to 38 in 2019) is considered a Millennial |
| Taurine | Taurine is an amino acid that supports immune health and nervous system function. |
| Bars & Pubs | It is a drinking establishment licensed to serve alcoholic drinks for consumption on the premises. |
| Café | It is a foodservice establishment serving refreshments (mainly coffee) and light meals. |
| On the go | It means doing / dealing with while busily engaged with something and not diverting plans in order to accommodate. |
| Internet Penetration | The Internet Penetration Rate corresponds to the percentage of the total population of a given country or region that uses the Internet. |
| Vending Machine | A machine that dispenses small articles such as food, drinks, or cigarettes when a coin or token is inserted |
| Discount store | A discount store or discounter offers a retail format in which products are sold at prices that are in principle lower than an actual or supposed "full retail price". Discounters rely on bulk purchasing and efficient distribution to keep down costs. |
| Clean Label | Clean label on the beverage market are drinks that are made from few ingredients of natural origin and are not or only slightly processed. |
| Caffeine | An alkaloid compound which is a stimulant of the central nervous system. It is mainly used recreationally, as a mild cognitive enhancer to increase alertness and attentional performance. |
| Extreme sport | Action sports, adventure sports or extreme sports are activities perceived as involving a high degree of risk. |
| High-intensity interval training | It incorporates several rounds that alternate between several minutes of high intensity movements to significantly increase the heart rate to at least 80% of one's maximum heart rate, followed by short periods of lower intensity movements. |
| Shelf life | The length of time for which an item remains usable, fit for consumption, or saleable. |
| Cream Soda | Cream soda is a sweet soft drink. Generally flavored with vanilla and based on the taste of an ice cream float |
| Root Beer | Root beer is a sweet North American soft drink traditionally made using the root bark of the sassafras tree Sassafras albidum or the vine of Smilax ornata as the primary flavor. Root beer is typically, but not exclusively, non-alcoholic, caffeine-free, sweet, and carbonated. |
| Vanilla Soda | A carbonated soft drink flavoured with vanilla. |
| Dairy-Free | A product that does not contain any milk or milk products from cows, sheep or goats. |
| Caffeine-Free Energy Drinks | Caffeine-free energy drinks rely on other ingredients to boost the energy. Popular choices include amino acids, B vitamins, and electrolytes. |


Research Methodology
Mordor Intelligence follows a four-step methodology in all our reports.
- Step-1: IDENTIFY KEY VARIABLES: In order to build a robust forecasting methodology, the variables and factors identified in Step 1 are tested against available historical market numbers. Through an iterative process, the variables required for market forecast are set, and the model is built on the basis of these variables.
- Step-2: Build a Market Model: Market-size estimations for the forecast years are in nominal terms. Inflation is not a part of the pricing, and the average selling price (ASP) is kept constant throughout the forecast period for each country.
- Step-3: Validate and Finalize: In this important step, all market numbers, variables, and analyst calls are validated through an extensive network of primary research experts from the market studied. The respondents are selected across levels and functions to generate a holistic picture of the market studied.
- Step-4: Research Outputs: Syndicated reports, custom consulting assignments, databases & subscription platforms


