
Market Overview
| Study Period | 2021 - 2031 |
|---|---|
| Forecast Data Period | 2026 - 2031 |
| Historical Data Period | 2021 - 2024 |
| Market Size (2026) | USD 6.73 Billion |
| Market Size (2031) | USD 15.17 Billion |
| Growth Rate (2026 - 2031) | 17.65 % |
| Market Concentration | Medium |
Major Players *Disclaimer: Major Players sorted in no particular order Image © Mordor Intelligence. Reuse requires attribution under CC BY 4.0. | |
India Lithium-ion Battery Market Analysis by Mordor Intelligence
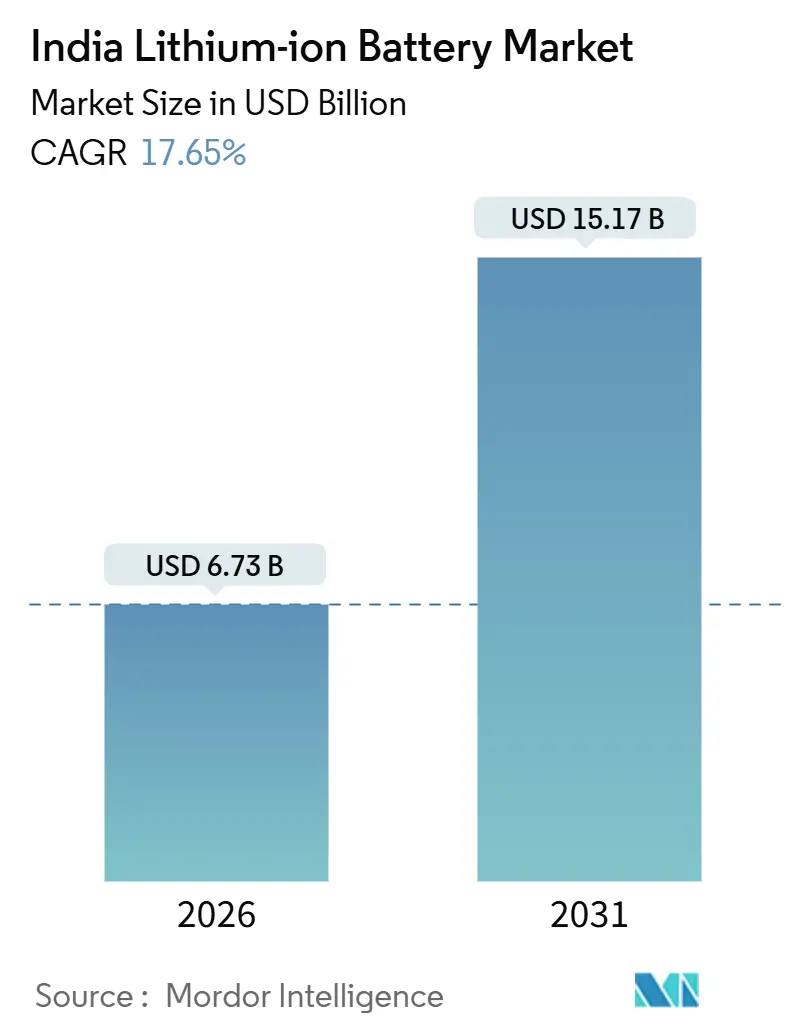
The India Lithium-ion Battery Market size is estimated at USD 6.73 billion in 2026, and is expected to reach USD 15.17 billion by 2031, at a CAGR of 17.65% during the forecast period (2026-2031).
This steep growth trajectory is rooted in strong policy incentives, accelerating localization of cell production, and a dramatic shift in mobility and energy-storage economics. FAME-II subsidies trimmed upfront prices of electric two-wheelers and buses by up to 30%, pushing electric models to 48% of new two-wheeler sales in India’s largest cities. On the supply side, the Production-Linked Incentive (PLI) scheme committed INR 18,100 crore (USD 2.17 billion) to 11 cell makers, cutting the landed-cost gap with imported cells to less than 5%. Parallel grid-scale energy-storage auctions from SECI and NTPC are anchoring long-term demand, while corporate renewable power-purchase agreements bundled with storage have pushed levelized storage costs below INR 5 per kWh in 2025. Intensifying domestic competition, backed by aggressive capital expenditure, is expected to unlock cost reductions that favorably reshape the India lithium-ion battery market through the decade.
Key Report Takeaways
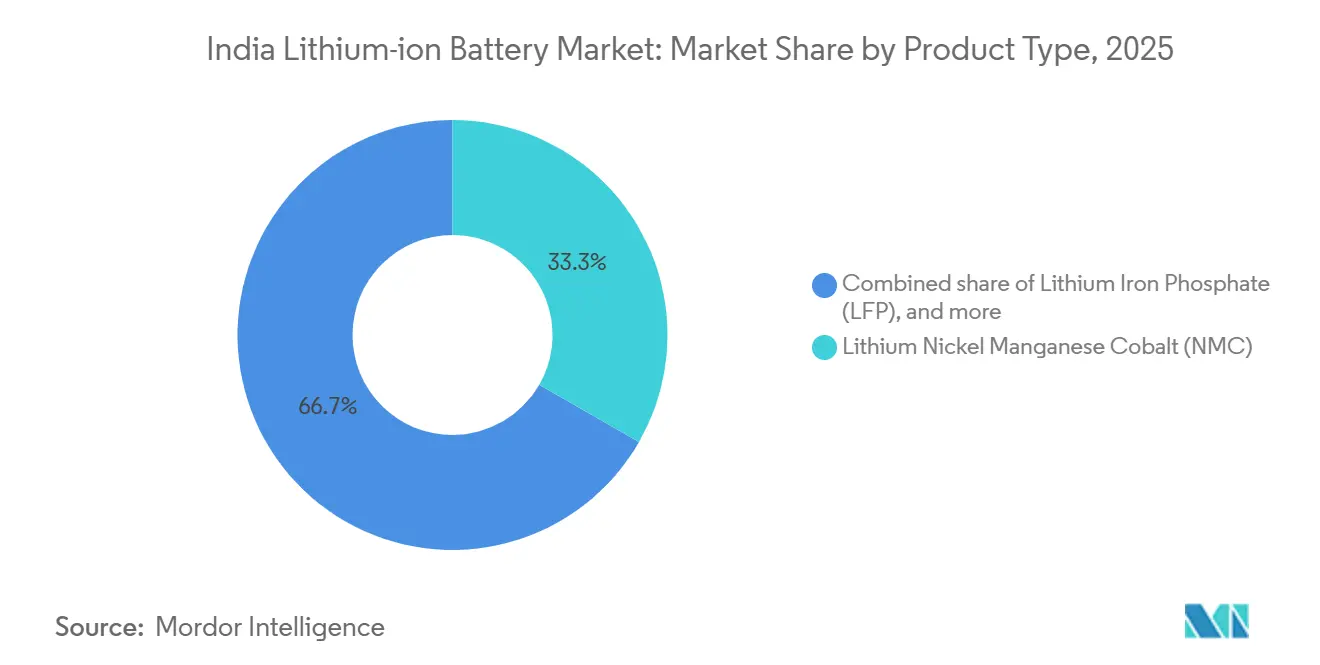
- By chemistry, Lithium Nickel Manganese Cobalt (NMC) retained 33.3% revenue share in 2025, while Lithium Iron Phosphate (LFP) is projected to expand at a 27.1% CAGR to 2031.
- By form factor, cylindrical cells held 55.8% of India's lithium-ion battery market share in 2025; pouch cells exhibit the fastest projected CAGR at 24.3% through 2031.
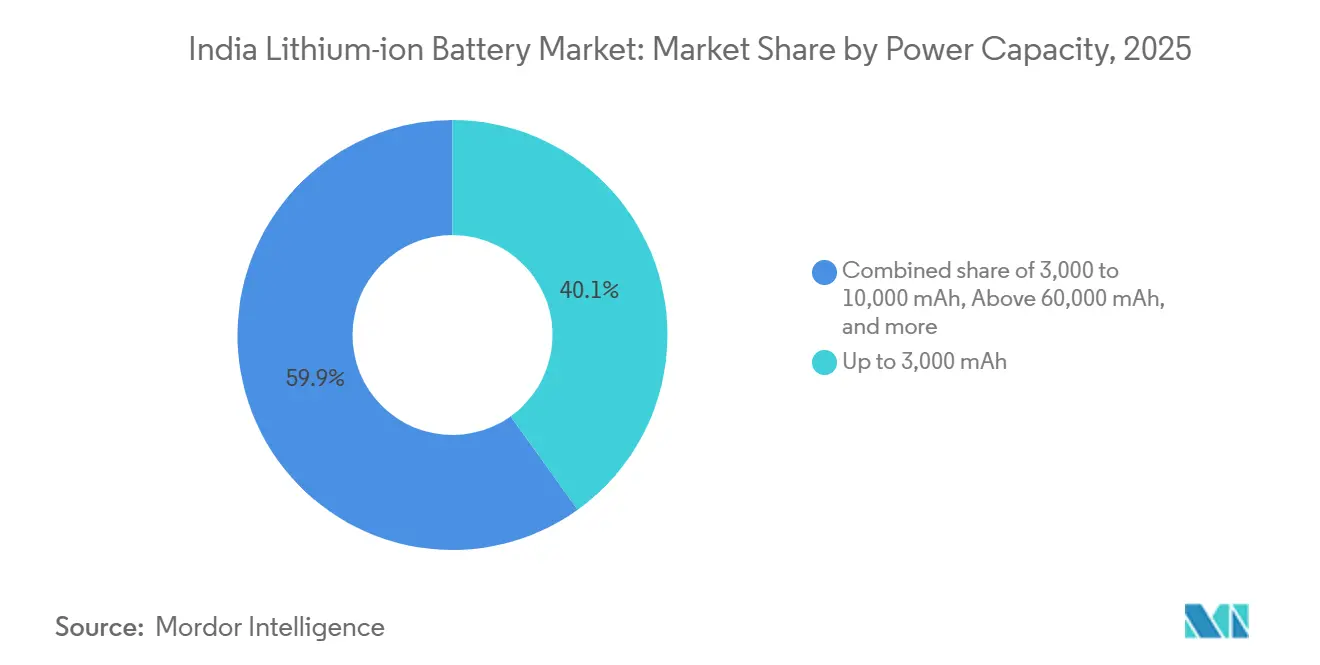
- By power capacity, the up-to-3,000 mAh bracket led with 40.1% contribution to the India lithium-ion battery market size in 2025; the above-60,000 mAh segment is forecast to surge at a 28.5% CAGR between 2026 and 2031.
- By end-use industry, consumer electronics commanded 35.5% of demand in 2025; automotive applications are advancing at a 25.9% CAGR and are on track to become the largest segment by 2029.
- Ola Electric, Exide Industries, Amara Raja, LG Energy Solution, and Reliance New Energy collectively accounted for roughly 48% of domestic cell capacity commitments in 2025.
Note: Market size and forecast figures in this report are generated using Mordor Intelligence’s proprietary estimation framework, updated with the latest available data and insights as of January 2026.
India Lithium-ion Battery Market Trends and Insights
Drivers Impact Analysis*
| Driver | (~) % Impact on CAGR Forecast | Geographic Relevance | Impact Timeline |
|---|---|---|---|
| Declining lithium-ion battery cost curve acceleration | +3.2% | National, with early gains in Maharashtra, Tamil Nadu, Gujarat | Medium term (2-4 years) |
| Government FAME-II subsidies and PLI schemes | +4.8% | National, concentrated in urban centers and PLI-designated manufacturing zones | Short term (≤ 2 years) |
| Electric two-wheeler boom in urban mobility | +3.9% | Urban India, led by Tier-1 and Tier-2 cities | Short term (≤ 2 years) |
| Grid-scale energy-storage tenders by SECI & NTPC | +2.1% | National, with project clusters in Rajasthan, Gujarat, Karnataka | Medium term (2-4 years) |
| Localization of cell manufacturing under Atmanirbhar Bharat | +2.6% | Manufacturing hubs in Tamil Nadu, Gujarat, Maharashtra, Karnataka | Long term (≥ 4 years) |
| Corporate renewable + storage PPAs in C&I segment | +1.5% | Industrial corridors in Gujarat, Maharashtra, Andhra Pradesh | Medium term (2-4 years) |
| Source: Mordor Intelligence | |||


Declining Lithium-ion Battery Cost Curve Acceleration
Battery-pack prices in India fell to USD 115 per kWh in 2025 from USD 132 per kWh a year earlier as raw-material prices cooled and domestic scale improved. By early 2026, locally produced NMC cells cost USD 95 per kWh, almost matching imported Chinese equivalents once freight and GST are added. This rapid deflation is tipping total-cost-of-ownership equations in favor of electric two- and three-wheelers, where price sensitivity is high. LFP, representing 22% of 2025 demand, offers an 18-22% bill-of-materials discount over NMC, though its energy density is roughly 15-20% lower. Cost parity is also enabling 4-hour stationary systems to undercut diesel gensets on levelized cost in commercial buildings, a milestone crossed in 2025.
Government FAME-II Subsidies and PLI Schemes
The government disbursed INR 7,500 crore (USD 900 million) in FAME-II incentives by March 2025, underwriting 1.2 million electric two-wheelers and 18,000 e-buses and slicing sticker prices by 25-30%. Extension through March 2027 locks in demand visibility, helping OEMs align with phased manufacturing mandates. Complementing demand pull, the ACC-PLI program earmarked INR 18,100 crore (USD 2.17 billion) to catalyze 50 GWh of domestic capacity by 2030. Reliance New Energy’s 10 GWh Jamnagar plant and Ola Electric’s 20 GWh Tamil Nadu gigafactory headline the beneficiaries, each capturing more than INR 2,900 crore (USD 350 million) in incentives. The 20% value-addition subsidy during the first five years compresses the landed-cost gap with imports to below 5%, galvanizing localization decisions by major OEMs.
Electric Two-Wheeler Boom in Urban Mobility
Electric two-wheelers seized 48% of all two-wheeler sales across India’s top 10 cities in 2025, up from 38% in 2024. Ola Electric, Ather Energy, and TVS Motor sold a combined 1.8 million e-scooters, each packing 2.5–4 kWh NMC batteries that deliver 100–150 km real-world range. While high-nickel cathodes fuel urban models, limited public charging in Tier-2 and Tier-3 cities still restrains inter-city adoption, underscoring infrastructure gaps highlighted by the Ministry of Power. Elevated demand for cylindrical 21700 cells mirrors the segment’s preference for thermally benign pack architectures that can be rapidly assembled at scale.
Grid-Scale Energy-Storage Tenders by SECI & NTPC
SECI awarded 4 GWh of BESS contracts in 2025 at an average tariff of INR 4.8 per kWh (USD 0.058) for two-hour LFP systems in Rajasthan and Gujarat. In January 2026, NTPC floated the nation’s first 10-year performance-linked tender covering 2 GWh, signaling a pivot from capex to lifecycle-cost metrics. Reliability clauses favor LFP cells rated for 6,000+ cycles, nudging domestic manufacturers toward iron-phosphate cathode lines. With a 12 GWh pipeline through 2027, utility bids are triggering second-life opportunities as retired EV packs are repurposed, although regulatory clarity for reuse remains nascent under the Ministry of Power.
Restraints Impact Analysis*
| Restraint | (~) % Impact on CAGR Forecast | Geographic Relevance | Impact Timeline |
|---|---|---|---|
| Critical-mineral import dependence | -2.8% | National, affecting all manufacturing clusters | Long term (≥ 4 years) |
| Under-developed battery-recycling ecosystem | -1.4% | National, with acute gaps in collection logistics | Medium term (2-4 years) |
| High GST differential on cells vs. packs | -1.2% | National, impacting domestic cell manufacturers | Short term (≤ 2 years) |
| Safety & fire incidents eroding consumer confidence | -1.6% | Urban centers, particularly in two-wheeler and e-rickshaw segments | Short term (≤ 2 years) |
| Source: Mordor Intelligence | |||
Critical-Mineral Import Dependence
India imported 18,200 t of lithium compounds worth USD 1.2 billion in 2025, with 68% dependent on China and 24% on Chile.[3]Ministry of Mines, “Critical Minerals Strategy,” mines.gov.in Cobalt shipments of 4,800 t arrived almost exclusively via Chinese refineries sourcing from the Democratic Republic of Congo, exposing a single-node risk for NMC supply. Although exploratory finds in Karnataka’s Mandya district indicate 14,100 t lithium oxide equivalent, commercial extraction is unlikely before 2028. The Critical Mineral Mission has earmarked INR 2,500 crore (USD 300 million) for overseas mine stakes, yet until operational, cell manufacturers will continue to hedge by stockpiling three-month inventories, inflating working-capital cycles.
Under-Developed Battery-Recycling Ecosystem
National recycling capacity reached only 12,000 t pa in 2025, equal to processing 8% of end-of-life packs.[4]Central Pollution Control Board, “Battery Waste Management Review,” cpcb.nic.in Extended producer responsibility rules delivered just 22% compliance due to patchy enforcement, leaving informal channels to handle most returned batteries. Hydrometallurgical plants need a 25,000 t pa break-even scale, yet Attero Recycling and Lohum Cleantech together processed only 8,400 t in 2025. Lithium carbonate recovered via recycling costs USD 18 per kg, roughly 30% above virgin imports, discouraging uptake. Absence of a rural reverse-logistics network deepens the problem as 38% of electric two-wheelers now sell beyond metro areas.
*Our forecasts treat driver/restraint impacts as directional, not additive. The impact forecasts reflect baseline growth, mix effects, and variable interactions.
Segment Analysis
By Product Type: LFP Gains on NMC’s Dominance
India's lithium-ion battery market size for NMC chemistry was USD 1.87 billion in 2025, equal to a 33.3% share. LFP's superior cycle life and cobalt-free design underpin its forecast 27.1% CAGR, propelling it to near-parity with NMC by 2031, especially in stationary storage and commercial EVs. Exide Industries and Ola Electric both aim to shift 60% of sourcing to LFP by 2027. Although NMC retains an edge in premium passenger cars demanding 400 km+ range, stricter thermal-propagation tests under AIS-156 tilt mass-market models toward LFP. Minor chemistries like LTO and LMO will remain niche, serving public buses and power tools where rapid charging and temperature resilience override energy density.
India's lithium-ion battery market share for LFP is projected to close the gap as SECI and NTPC tenders mandate iron-phosphate chemistry for safety and lifecycle reasons. Consumer-electronics OEMs still prefer high-density NMC and LCO cells, but rising smartphone battery capacities are gradually cannibalizing LCO volumes. Panasonic Energy's small NCA niche supplies luxury EVs, yet volumes stay marginal due to cost and supply-risk issues.


By Form Factor: Pouch Cells Challenge Cylindrical Hegemony
Cylindrical formats generated USD 3.13 billion of the India lithium-ion battery market size in 2025, equal to 55.8% share, reflecting deep legacy supply chains and automated assembly lines. The 21700 cell, widely used by Ather and Ola, delivers 35% more energy than 18650, lowering per-kWh pack cost by 8–10%. Pouch cells, while only 16.2% share now, are forecast to grow 24.3% CAGR as skateboard EV platforms demand thin, high-utilization modules. LG Energy Solution’s 5 GWh Pune plant, due in 2026, will feed this trend with 250 Wh/kg NMC pouches.
Thermal-expansion risks in India’s 45 °C summers necessitate enhanced cooling, adding USD 20-30 per kWh to pouch-pack costs, but weight savings of 12-18% are compelling for two-wheeler OEMs chasing sub-100 kg designs. Prismatic cells dominate stationary storage as they simplify racking and BMS integration, despite an 8–12% cost premium. BYD’s blade battery technology is under evaluation by Indian bus OEMs for structural integration benefits.
By Power Capacity: Large-Format Cells Accelerate
Cells up to 3,000 mAh held 40.1% of India's lithium-ion battery market share in 2025, thanks to the 180 million smartphones shipped every year. Larger above-60,000 mAh formats will post a 28.5% CAGR through 2031 as OEMs shift to large prismatic modules that lower assembly labor by nearly one-third. Exide's 12 GWh Bengaluru plant will prioritize these large-format cells, aligning with the phased manufacturing requirement for 60% domestic value addition by 2027.
Mid-range 10,000–60,000 mAh cells, used in e-rickshaws and light commercial vehicles, face price pressure from Chinese imports that undercut domestic offers by 15–20% even after the GST differential. As carmakers migrate to 100,000 mAh modules, economies of scale in coating and formation are expected to trim per-kWh costs by another 15% by 2028.
By End-Use Industry: Automotive Overtakes Consumer Electronics
Consumer electronics consumed 35.5% of shipments in 2025, but automotive demand is set to dominate by 2029, expanding at a 25.9% CAGR as two-wheeler electrification spreads from Tier-1 cities to peri-urban districts. Passenger EV sales tripled to 120,000 units in 2025, each carrying 30–50 kWh packs that dwarf phone batteries in material terms. The India lithium-ion battery market size for stationary storage reached USD 1.01 billion in 2025 and is the fastest-growing non-mobility application thanks to tender-led visibility.
Industrial power tools, at 12% share, continue migrating from nickel-cadmium to lithium-ion as OEMs chase 40% weight savings. Aerospace and defense volumes remain niche but lucrative, with Bharat Electronics shipping LTO packs that meet MIL-STD-810 vibration requirements. Marine applications such as Kerala’s 500 kWh ferry demonstrate untapped potential as inland waterways modernize.
Geography Analysis
Tamil Nadu, Gujarat, and Maharashtra together host 72% of announced cell capacity, underpinning regional specialization within the India lithium-ion battery market. Tamil Nadu’s Krishnagiri district houses Ola Electric’s 20 GWh gigafactory, backed by a 15% capital subsidy capped at INR 150 crore. Proximity to Chennai and Bengaluru EV assembly plants and streamlined port logistics shorten raw-material lead times. Gujarat’s Jamnagar cluster, led by Reliance New Energy’s 10 GWh project, benefits from renewable-energy surpluses that shave formation-stage electricity costs by up to 20%.
Maharashtra leverages industrial infrastructure and skilled labor, anchoring Exide’s 12 GWh Chakan site and Amara Raja’s 16 GWh Pune plan, both eligible for state-level fiscal incentives. Karnataka is carving a recycling and second-life niche, with Attero Recycling’s 18,000 t pa hydrometallurgical plant in Bengaluru reclaiming 92-95% of metals from spent packs. Rajasthan and Gujarat dominate grid-scale storage demand, hosting 68% of SECI-awarded BESS capacity, thanks to high solar output and network congestion. The diffusion of electric two-wheelers into Tier-2 and Tier-3 cities creates logistics challenges for battery-swapping networks, a gap Sun Mobility addresses via 9 kWh LFP swap stations now spanning eight cities.
Regulatory Landscape
India's lithium-ion battery market is shaped by overlapping demand-side and manufacturing programs, alongside rising safety and quality compliance requirements. On the demand and grid-integration side, the Ministry of Power's National Framework for Promoting Energy Storage Systems (August 2023) provides an enabling structure for energy storage obligations and related grid facilitation measures. Procurement momentum also builds through government-led storage tenders in the report scope, including via SECI and NTPC. On the manufacturing side, the Ministry of Heavy Industries administers the National Programme on Advanced Chemistry Cell (ACC) Battery Storage with a total outlay of INR 18,100 crore to build 50 GWh of domestic ACC capacity by 2030, creating a central anchor for localization decisions across cell makers and OEM supply chains.
Product compliance requirements for lithium cells and batteries sold in India continue to tighten. The Bureau of Indian Standards (BIS) mandates compliance for portable sealed secondary lithium cells and batteries under IS 16046 (Part 2). Separately, MeitY issued an order on February 3, 2026 requiring verified rated capacity compliance for covered products by April 30, 2027, referencing IS 16047 (Part 3). In July 2026, the Ministry of Heavy Industries invited global bids for 10 GWh of ACC manufacturing capacity for grid-scale stationary storage, reinforcing policy focus on utility-scale battery supply within the existing PLI framework.
Competitive Landscape
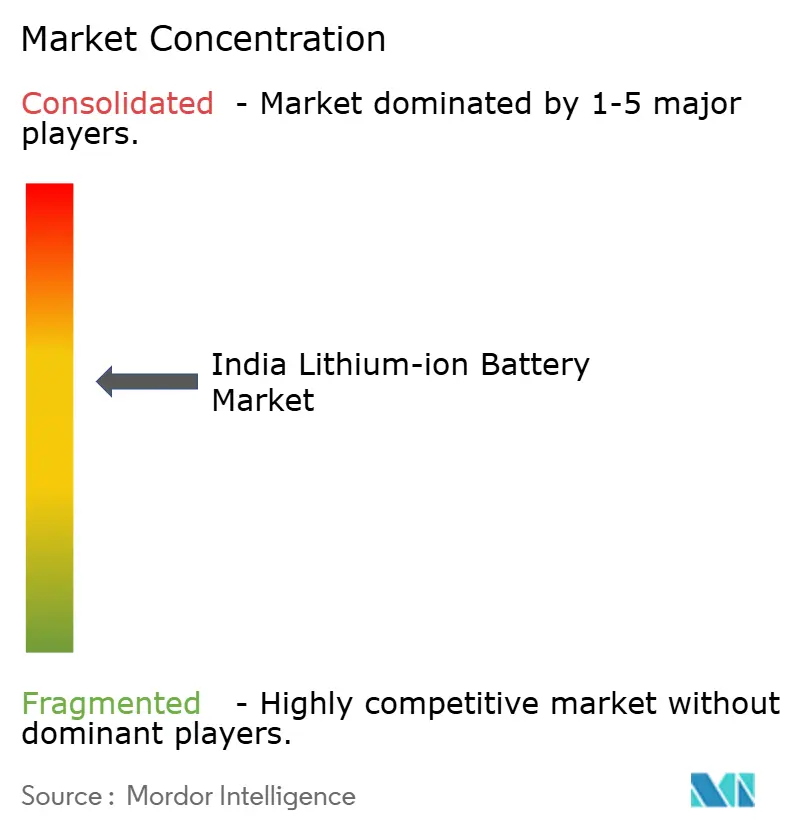
India’s lithium-ion battery arena is moderately fragmented, with the top five players controlling roughly 48% of committed domestic capacity. Vertically integrated challengers like Ola Electric and Reliance New Energy seek to internalize cell output, using PLI incentives to insulate supply and capture margin, whereas traditional lead-acid leaders Exide and Amara Raja pivot via technology partnerships with Leclanché and others. LG Energy Solution’s 5 GWh Pune entry signals that global majors prefer localized production to bypass GST headwinds.
Value-chain whitespaces persist in battery-management systems (BMS) and thermal solutions. Inverted Energy’s cloud-connected BMS, rolled out in 45,000 electric three-wheelers, commands a 12–15% premium by offering predictive maintenance. Process innovation is also underway: Tata AutoComp’s dry-electrode coating line in Chennai trimmed solvent use by 85%, reducing cell costs by 8–10%. Stricter AIS-156 Amendment 3 mandates heightened compliance requirements, favoring players with in-house safety labs and pushing smaller assemblers toward consolidation. International cell giants eye joint ventures as an entry wedge, but technology transfer terms remain tight amid IP-protection concerns.
India Lithium-ion Battery Industry Leaders
TDS Lithium-Ion Battery Gujarat Pvt. Ltd.
Nexcharge (Exide & Leclanché)
Amperex Technology Ltd. (ATL)
Exicom Tele-Systems Ltd.
Okaya Power Group
- *Disclaimer: Major Players sorted in no particular order

Market Opportunities and Future Outlook
Grid-scale stationary storage is a clear whitespace for both domestic cell manufacturing and system integration, as government procurement and planning move from broad enabling frameworks to targeted capacity creation. The Ministry of Heavy Industries July 2026 tender for 10 GWh of ACC manufacturing capacity dedicated to grid-scale stationary storage, under the INR 18,100 crore ACC-PLI program, offers a route for new and existing manufacturers to supply utility and renewable firming demand with India-made cells. This is supported by the Central Electricity Authority estimate of 41.6 GW/208.3 GWh of battery energy storage required by 2030, which widens opportunity across LFP cell lines, long-duration performance warranties, and domestic testing and certification services tied to utility procurement.
Compliance and localization frictions also translate into product and service opportunities in quality assurance, performance verification, and supply-chain substitution. With MeitY's February 2026 order tightening rated-capacity verification for portable sealed secondary lithium cells and batteries by April 30, 2027, manufacturers and importers have a more concrete incentive to invest in BIS-aligned testing, traceability, and consistent cell-to-pack performance validation. At the same time, the low commissioned share under the ACC-PLI program as of October 2025 (about 1.4 GWh) leaves room for equipment suppliers, process-optimization providers, and contract manufacturing models that can help committed projects ramp faster and improve yields, particularly for LFP lines aligned with utility tenders and safety-driven adoption in mass-market mobility.
Recent Industry Developments
- July 2026: Exide Industries announced plans to invest an additional INR 1,400 crore in the first phase of its Bengaluru lithium-ion cell manufacturing project. The Phase 1 build-out targets 6 GWh and the company indicated the plant is scheduled to start generating revenue from Q3 of the fiscal year, strengthening the domestic cell-supply base for EV and energy-storage value chains.
- December 2025: Exicom Tele-Systems signed an MoU with EONEX Energy for deployment of lithium-ion based battery energy storage systems (BESS). The tie-up aligns Exicom's power solutions footprint with the growing pipeline of stationary storage deployments, supporting faster commercialization pathways for containerized BESS offerings.
- June 2024: Exide Industries invested INR 450 crore into its lithium-ion battery subsidiary, Exide Energy Solutions Ltd., to support commissioning requirements for the Bengaluru gigafactory. The capital infusion improved readiness for domestic cell manufacturing scale-up and helped underpin backward integration away from imported cells for pack operations.


Research Methodology Framework and Report Scope
Market Definition and Coverage
This market is defined as the total revenue generated from lithium-ion batteries sold and used within India across major end-use demand, captured in USD for the stated study period.
Scope exclusions: We exclude non-lithium rechargeable chemistries and primary (non-rechargeable) batteries, and we also avoid counting upstream raw materials as part of battery market value.
Segmentation Overview
- By Product Type
- Lithium Cobalt Oxide (LCO)
- Lithium Iron Phosphate (LFP)
- Lithium Nickel Manganese Cobalt (NMC)
- Lithium Nickel Cobalt Aluminium (NCA)
- Lithium Manganese Oxide (LMO)
- Lithium Titanate (LTO)
- By Form Factor
- Cylindrical
- Prismatic
- Pouch
- By Power Capacity
- Up to 3,000 mAh
- 3,000 to 10,000 mAh
- 10,000 to 60,000 mAh
- Above 60,000 mAh
- By End-use Industry
- Automotive (EV, HEV, PHEV)
- Consumer Electronics
- Industrial and Power Tools
- Stationary Energy Storage
- Aerospace and Defense
- Marine
Data Sources, Market Sizing, and Validation
Desk Research
Desk research is used to build a clean fact base on India demand drivers, supply additions, and price movement before any assumptions are set in the model. We referred to public sources such as Ministry of Heavy Industries announcements (EV programs), NITI Aayog papers, Central Electricity Authority releases for storage and grid planning, and DGFT and customs trade statistics for cell and pack import and export direction.
To reduce missed signals, we also reviewed company annual reports, investor presentations, and credible press coverage on capacity additions and sourcing tie-ups, followed by patent databases to track activity around cell chemistry and pack design. In some cases, paid subscriptions for company financials and intelligence, shipment-level import and export data, and patent search were used to cross-check volumes and timing. These sources are illustrative only, and many other public documents were also used for data collection, validation, and clarification.
Primary Interviews and Surveys
Primary work focused on validating what is actually being shipped and adopted in India, and how pricing and mix changes are showing up across the ecosystem. We covered battery value chain participants and demand-side users, and the discussions were used to test assumptions on EV adoption momentum, stationary storage tender activity, and the split between cells and packs across key application clusters.
Distribution of primary research fieldwork respondents
| Company type | Respondent position |
|---|---|
| Top tier: 27% | CXOs: 12% |
| Mid tier: 59% | Functional/Unit leaders: 34% |
| Smaller Players: 14% | Managers: 54% |
Market-Sizing & Forecasting
The sizing starts with a top-down build where India demand is reconstructed using application-level adoption signals and battery intensity, and then translated into value using observed price bands. To keep totals realistic, results are corroborated with selective bottom-up approximations, such as sampled ASP multiplied by estimated volumes, channel checks on cells versus packs, and a reasonableness check against trade and capacity markers.
Key inputs used in the model include EV sales momentum by vehicle category, average battery capacity per vehicle and for stationary systems, the share of local assembly versus imports, and the mix shift across common chemistries that changes cost and performance expectations. We also track indicative battery pack pricing trends, tender and project announcements tied to storage rollouts, and lead times and duty changes that can create short-term demand pulls.
For forecasting, scenario analysis is applied around EV adoption pace, policy execution timing, and price declines, and then the chosen base case is aligned with expert consensus gathered in interviews. Where bottom-up visibility is limited for smaller channels, we apply conservative penetration and mix assumptions that are re-checked against import direction and on-ground supply feedback before the final numbers are locked.
Data Validation & Update Cycle
Outputs are validated through several passes so that the final market value matches what is realistically possible for India within the stated scope. We compare results against independent signals such as import intensity, known capacity additions, and demand-side adoption indicators, and then investigate any jumps that look out of line with pricing or volume movement.
Before sign-off, assumptions and calculations are reviewed by another analyst, and follow-up calls are triggered when a gap is found in pricing, mix, or timing. The report is refreshed annually, and interim updates are added when material events occur, such as policy shifts, major capacity commissioning, or visible price resets. Just before delivery, a fresh check is completed so clients receive the latest updated view.
Mordor Intelligence's India Lithium Ion Battery Market Size Compared Against Other Published Estimates
Published values for this market can vary widely, even when the country name and product label look the same. The main reasons tend to be differences in what is counted (cells only versus cells plus packs), the application set included, the year used as the starting point, and how pricing is translated into USD.
By tracking import-linked supply signals and end-use adoption indicators, Mordor Intelligence keeps the market total tied to batteries actually placed in India during the forecast window, which limits inflation from adjacent electronics components or broad energy storage system spend.
Benchmark comparison
| Source | Market Size | Gaps in Research Methodology |
|---|---|---|
| Mordor Intelligence | USD 6.73 B (2026) | |
| Industry Publisher A | USD 3.59 B (2025) | Uses a different base year and a longer forecast horizon, and its definition appears to lean on broader regional splits and application groupings that can undercount fast-moving EV-led demand when ramp-up timing shifts. |
| Trade News Digest B | USD 0.38 B (2025) | The estimate looks closer to a narrower tracked pool, which may reflect only selected battery categories or reported demand channels, thereby missing a large share of EV and stationary storage volume routed through imports and assembly. |
Overall, the spread is largely explained by scope boundaries and what gets treated as battery value versus adjacent system spend, followed by differences in the starting year and how quickly price declines are assumed. Our approach stays traceable to a defined India demand pool with clear checks on volume and pricing, so the number can be repeated and stress-tested when assumptions change.


Key Questions Answered in the Report
How fast is India shifting to electric two-wheelers?
Electric two-wheelers captured 48% of total two-wheeler sales in India's top 10 cities during 2025, boosted by FAME-II incentives and rising fuel prices.
What chemistry will dominate Indian battery plants by 2031?
LFP is projected to grow 27.1% CAGR, overtaking NMC in utility storage and commercial EVs due to cost and safety advantages mandated by SECI and NTPC tenders.
Why are pouch cells gaining share?
Pouch cells offer 10-15% higher volumetric energy density and weigh 12-18% less than cylindrical equivalents, suiting new skateboard EV platforms despite the need for advanced cooling.
Which states lead in battery manufacturing investment?
Tamil Nadu, Gujarat, and Maharashtra account for 72% of committed cell capacity, thanks to state incentives, port access, and existing automotive clusters.
How is India addressing critical-mineral reliance?
The Critical Mineral Mission allocates INR 2,500 crore for overseas mine stakes and domestic processing, but commercial output is unlikely before 2028, keeping near-term supply dependent on imports.
What is the projected size of India’s lithium-ion battery market by 2031?
The India lithium-ion battery market is expected to reach USD 15.17 billion by 2031, growing at a 17.65% CAGR from 2026 to 2031.
Page last updated on:


 Your data is secure and never sold or shared.


