
Warehousing And Storage Services Market Size and Share
Market Overview
| Study Period | 2020 - 2031 |
|---|---|
| Market Size (2026) | USD 544.11 Billion |
| Market Size (2031) | USD 672.36 Billion |
| Growth Rate (2026 - 2031) | 4.33 % |
| Fastest Growing Market | Asia Pacific |
| Largest Market | North America |
| Market Concentration | Medium |
Major Players *Disclaimer: Major Players sorted in no particular order Image © Mordor Intelligence. Reuse requires attribution under CC BY 4.0. | |
Warehousing And Storage Services Market Analysis by Mordor Intelligence
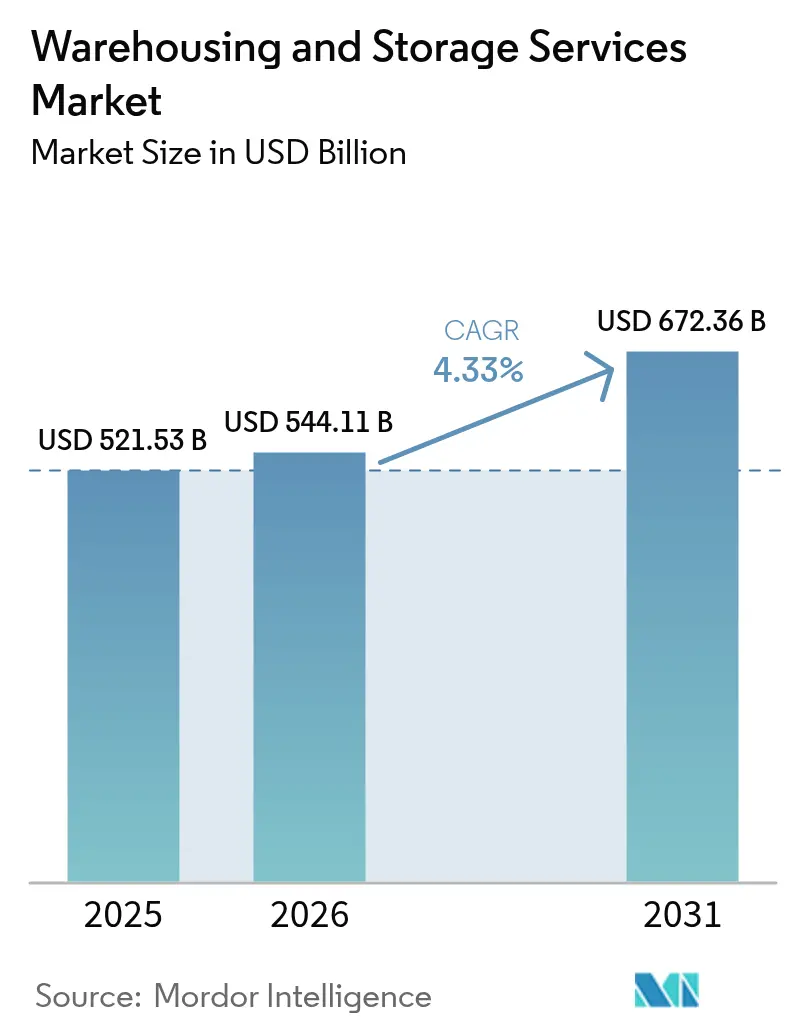
The warehousing and storage services market size was valued at USD 521.53 billion in 2025 and estimated to grow from USD 544.11 billion in 2026 to reach USD 672.36 billion by 2031, at a CAGR of 4.33% during the forecast period (2026-2031). Robust e-commerce volumes, supply-chain modernization, and sustained investment in automation anchor this growth trajectory, while diversification of sourcing locations and heightened cold-chain requirements broaden demand across service types. Market participants expand urban micro-fulfillment footprints to shorten last-mile routes, and power-intensive automation installs accelerate sustainability retrofits as operators seek energy savings and carbon-reduction credits. The sector’s moderate consolidation underscores the value of scale as leading companies pursue multi-country platforms, yet ample fragmentation persists, preserving entry lanes for regionally focused specialists. Structural tailwinds outweigh headwinds from capital costs and labor scarcity, keeping the warehousing and storage services market on a steady upward path.
Key Report Takeaways
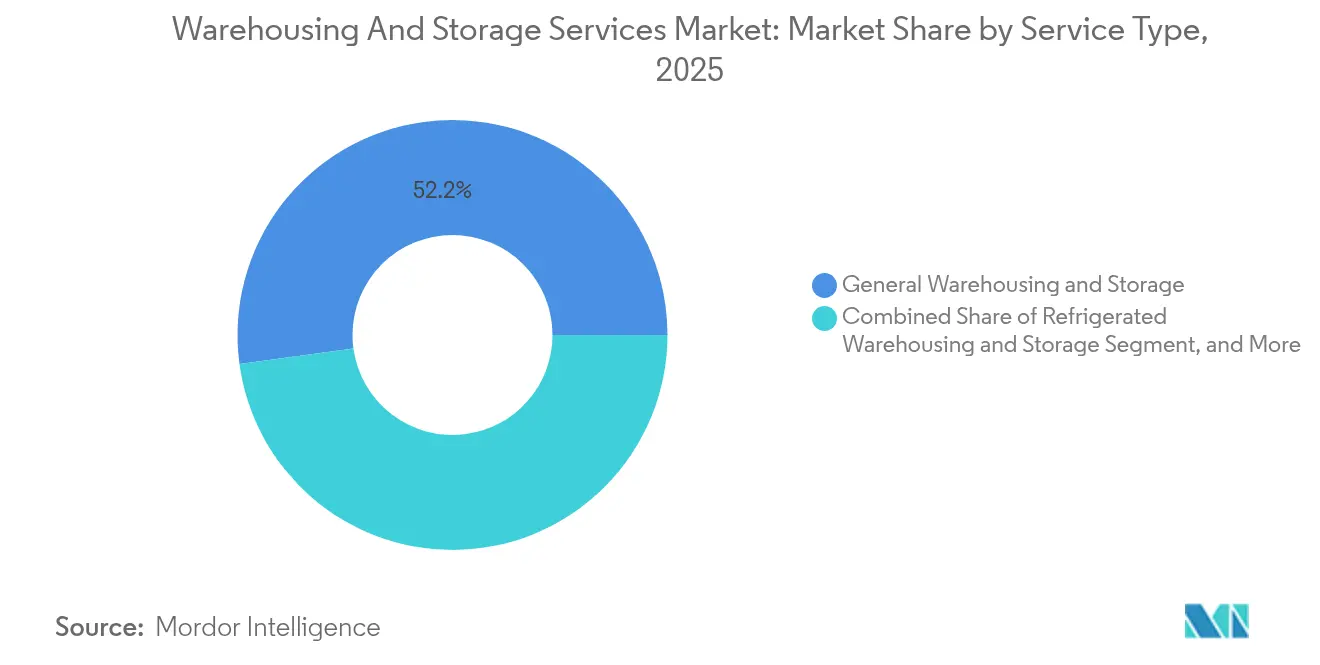
- By service type, general warehousing led with 52.15% of the warehousing and storage services market share in 2025; refrigerated warehousing is projected to expand at a 5.36% CAGR through 2031.
- By ownership, public warehouses held a 46.88% share of the warehousing and storage services market in 2025; private automated warehouses are forecast to record a 4.83% CAGR to 2031.
- By end-user industry, manufacturing accounted for 29.55% of the warehousing and storage services market size in 2025, while healthcare is advancing at a 4.34% CAGR through 2031.
- By duration of storage, short-term storage dominated the warehousing and storage services market in 2025 with around 63.02% share; meanwhile, long-term storage is projected to grow at the fastest CAGR of 5.78% during 2026-2031.
- By geography, North America captured a 31.45% share of the warehousing and storage services market in 2025; Asia Pacific is projected to post the fastest 7.21% CAGR between 2026 and 2031.
Note: Market size and forecast figures in this report are generated using Mordor Intelligence’s proprietary estimation framework, updated with the latest available data and insights as of 2026.
Global Warehousing And Storage Services Market Trends and Insights
Drivers Impact Analysis*
| Driver | (~) % Impact on CAGR Forecast | Geographic Relevance | Impact Timeline |
|---|---|---|---|
| Rising omnichannel fulfillment requirements | +0.80% | North America and Europe lead, global adoption | Medium term (2-4 years) |
| E-commerce-led warehouse demand boom | +1.20% | Asia Pacific and North America strongest | Short term (≤ 2 years) |
| Expansion of 3PL outsourcing | +0.60% | Emerging markets gain, global trend | Medium term (2-4 years) |
| Growth of on-demand micro-warehousing networks | +0.40% | Urban hubs worldwide | Long term (≥ 4 years) |
| ESG-driven retrofitting for energy-efficient warehouses | +0.30% | Europe and North America, spreading to Asia Pacific | Long term (≥ 4 years) |
| AI-powered dynamic slotting to raise storage densities | +0.50% | Developed markets first, global rollout | Medium term (2-4 years) |
| Source: Mordor Intelligence | |||
Rising Omnichannel Fulfillment Requirements
Retailers blend online and in-store inventory pools to give customers flexible pick-up and delivery options, elevating demand for real-time inventory visibility and multi-channel order processing.[1]Supply Chain Brain Editors, “E-commerce boom: easing supply chain pressure with omnichannel supply chains,” Supply Chain Brain, supplychainbrain.com Operators position facilities closer to dense consumer zones, shrinking delivery windows, and boosting last-mile efficiency. Public warehouses benefit because shared nodes support multiple retailers that lack sufficient volume for a dedicated site. Early adopters integrate predictive analytics that reposition stock automatically, cutting stockouts and markdowns. Technology-enabled hubs quickly reconfigure pick zones to align with shifting demand patterns, solidifying competitiveness.
E-commerce-led Warehouse Demand Boom
Online retail continues to push unprecedented throughput into fulfillment centers, and parcel profiles skew toward smaller, higher-velocity orders requiring automated sorters and goods-to-person robotics.[2]CBRE Research Team, “Cold storage demand grows amid tailwinds,” CBRE, cbre.com Cold-chain nodes grow because digital grocery and pharmaceutical sales rise, prompting sizable investments in refrigeration controls and condition monitoring. Micro-fulfillment sites below 10,000 square feet proliferate in dense metros, enhancing same-day delivery capabilities while trimming transport miles. Flexible contracts become attractive as brands confront seasonality and promotional spikes. Cross-docking areas expand because businesses favor inventory-light models that move inbound cases directly to outbound docks.
Expansion of 3PL Outsourcing
Complex customs, technology costs, and regulatory burdens encourage firms to hand warehousing tasks to logistics specialists offering scalable space and digital tools. Leading 3PLs deploy advanced warehouse management systems that pool labor and automation across multi-client campuses, lowering per-unit costs.[3]Extensiv Analysts, “2024 State of the Industry,” Extensiv, extensiv.com Small and mid-sized shippers gain rapid market access without capital outlays. Providers differentiate through sector playbooks in healthcare, automotive, or high-value goods, creating premium services that command loyalty. Strategic partnerships expand footprints into emerging regions where domestic infrastructure is still maturing.
Growth of On-Demand Micro-warehousing Networks
Brands locate compact sites within city limits to meet ultra-fast delivery promises and slash last-mile costs.[4]Supply Chain 247 Contributors, “Warehouse management system safety & security in the cloud,” Supply Chain 247, supplychain247.com Automation elevates throughput in footprints that once could not support conventional racking, often via mezzanine layouts and shuttle systems. Real-estate constraints drive vertical construction with multi-story racking supported by freight lifts for pallet moves. Shared-use micro-sites allow multiple tenants to co-locate inventory, smoothing occupancy risk and driving utilization. Synchronization software links distributed nodes so orders are drawn from the closest stock-holding point.
Restraints Impact Analysis*
| Restraint | (~) % Impact on CAGR Forecast | Geographic Relevance | Impact Timeline |
|---|---|---|---|
| High capital and maintenance outlay | -0.70% | More acute in developing markets | Short term (≤ 2 years) |
| Shortage of skilled warehouse labor | -0.50% | Developed markets first, widening globally | Medium term (2-4 years) |
| Grid congestion limiting power for automation | -0.30% | North America and Europe bottlenecks | Long term (≥ 4 years) |
| Cyber-security risks from cloud WMS convergence | -0.20% | Digitally advanced markets | Medium term (2-4 years) |
| Source: Mordor Intelligence | |||
High Capital and Maintenance Outlay
Fully automated warehouses can exceed USD 50 million in initial spend, and annual maintenance often consumes 15-20% of operating budgets because of complex mechatronics and software support.[5]Deloitte Consulting, “Closing the gap on automated warehousing,” Deloitte, deloitte.com Refrigerated sites require insulated panels, ammonia or CO₂ systems, and backup generators, inflating cost profiles relative to dry storage. Rising interest rates elevate hurdle rates for new builds, causing some operators to delay projects or lease instead of own. Robotics-as-a-service contracts ease cash flow but raise long-term expense commitments. Smaller firms lacking collateral struggle to secure financing, thereby slowing technology diffusion across the broader warehousing and storage services market.
Shortage of Skilled Warehouse Labor
Turnover remains stubbornly high as repetitive tasks deter workers and competing industries raise wage benchmarks; average annual compensation reached USD 51,865 in 2023.[6]ISCRO MSU Researchers, “U.S warehouse growth and current situation,” ISCRO MSU, iscromsu.com Automation relieves manual strain yet creates demand for technicians able to program, troubleshoot, and maintain advanced equipment. Training budgets rise, and operators deploy gamified learning modules to speed up onboarding. Geographic mismatches exacerbate scarcity, with labor-tight regions forcing employers to bus staff from peripheral towns. High churn disrupts service levels and sparks greater investment in robotics, further shifting workforce profiles toward technical roles.
*Our forecasts treat driver/restraint impacts as directional, not additive. The impact forecasts reflect baseline growth, mix effects, and variable interactions.
Segment Analysis
By Type: Cold Chain Drives Specialized Growth
The warehousing and storage services market size attributed to general warehousing stood at USD 271.98 billion in 2025, reflecting a 52.15% share of overall revenues. Refrigerated facilities, while smaller in absolute value, posted the strongest 5.36% CAGR outlook, signaling durable demand from biopharma, frozen foods, and meal-kit services. The warehousing and storage services market share commanded by farm-product warehouses remains stable as export-oriented agriculture requires controlled atmospheres that reduce spoilage. Cold-chain players invest in low-charge ammonia systems that limit refrigerant risk, and automated pallet shuttle racking widens aisle-free storage density, trimming per-case energy usage.
Aging North American cold stores average 37 years and often lack high-bay clearances, prompting modern rebuilds that integrate oxygen-reduction fire systems and digital temperature mapping. Lineage Logistics and Americold funnel capital into multi-tenant facilities linked to rail spurs and port terminals, highlighting intermodal connections as a differentiator. Pharma-grade warehouses secure Good Distribution Practice certification, unlocking premium rate structures that can exceed dry storage tariffs by 2×. Altogether, specialized temperature control underpins value-accretive growth while general warehousing sustains the volume foundation of the warehousing and storage services market.



By Ownership: Automation Reshapes Private Facilities
Public warehouses represented 46.88% of 2025 revenues, anchored by shared-infrastructure economics that appeal to companies with variable demand. Yet the private automated subset expects the fastest 4.83% CAGR as manufacturers and retailers internalize inventory control and extract productivity from robotics at scale. The warehousing and storage services market size for public sites remains significant and provides flexible overflow capacity during demand spikes. Bonded warehouses target importers seeking duty deferral; their occupancy stays resilient near border crossings and free-trade zones.
Sustainability commitments spur private investors to pursue LEED-certified builds that align with corporate climate targets, often adding rooftop solar that offsets autonomous vehicle charging loads. Public operators respond by layering value-added services, such as kitting and reverse logistics, to maintain relevance. Hybrid models emerge where core SKUs sit in automated private hubs while slower movers reside in public space, illustrating nuanced portfolio strategies within the warehousing and storage services market.
By Duration of Storage: Balancing Flexibility with Strategic Stockpiling
In 2025, short-term storage dominated the warehousing and storage services market, contributing 63.02% of total revenues. This leadership was driven by fast-moving consumer goods, retail, and e-commerce sectors, which prioritize efficient inventory turnover and timely deliveries. Short-duration contracts enable businesses to respond swiftly to changing demand patterns, seasonal sales spikes, and promotional activities, ensuring optimal utilization rates.
Conversely, while long-term storage represents a smaller share of the market, it is the fastest-growing segment, with a projected CAGR of 5.78% through 2031. Growth in this segment is fueled by demand from pharmaceutical cold chains, industrial spare parts, and strategic reserves in energy and agriculture. Businesses increasingly value assured storage capacity, regulatory compliance, and the protection of critical goods. Additionally, the adoption of advanced monitoring technologies, such as automated climate control systems and IoT-based tracking, enhances the appeal of long-term storage solutions.

By End-user Industry: Healthcare Accelerates Specialized Demand
Manufacturers of machinery, electronics, and industrial goods generated 29.55% of sector revenue in 2025, underlining the centrality of component staging and work-in-process buffering. Health-care-related product flows expand at a 4.34% CAGR, driven by vaccine distribution and the growing biologics pipeline that requires 2 °C – 8 °C or -20 °C environments. The warehousing and storage services market share accruing to consumer goods and retail remains sizable due to omnichannel inventory pools that blend store replenishment with direct-to-consumer fulfillment.
GDP-certified facilities incorporate redundant power and 24×7 monitoring, safeguarding high-value vaccines whose shipments exceeded USD 260 billion in 2024. Automotive, electronics, and chemical verticals favor automated storage and retrieval systems to cut damage and track serialized components. Each end-user adopts specialized racking, hazard containment, or validation processes, cementing the role of tailored solutions across the warehousing and storage services market.
Geography Analysis
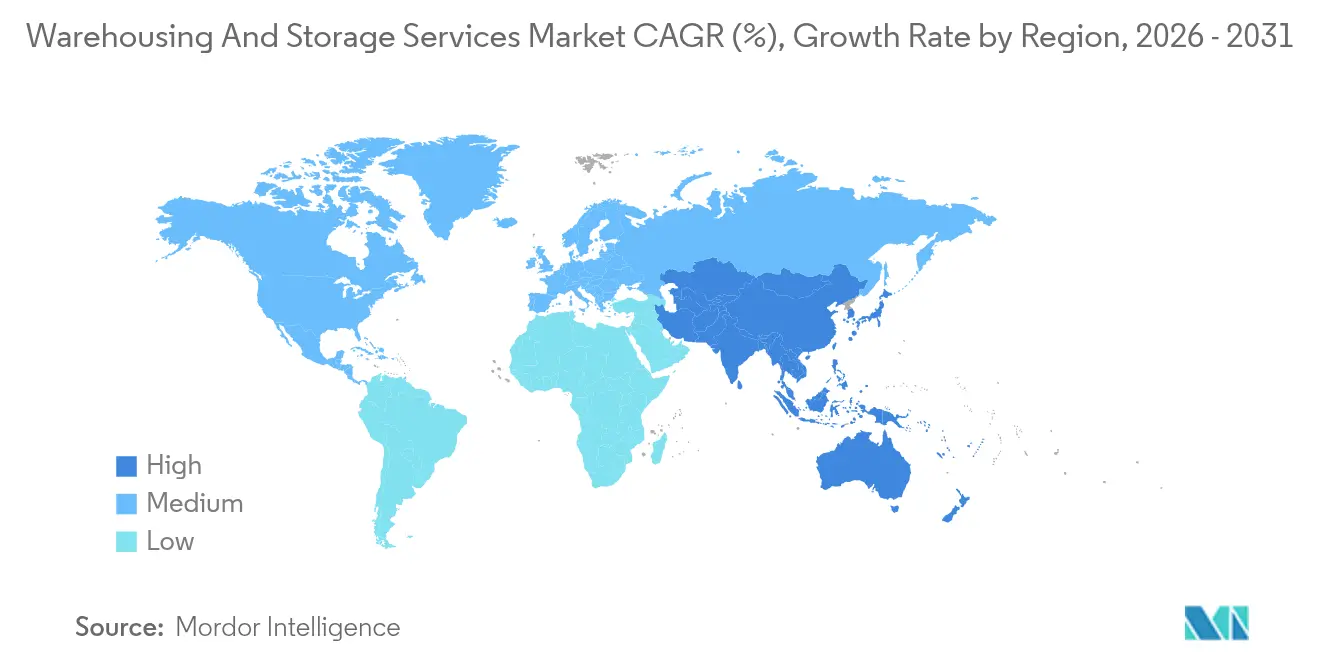
North America retained 31.45% warehousing and storage services market share in 2025, sustained by mature e-commerce networks and dense 3PL ecosystems that assure same-day delivery in most metropolitan areas. Manufacturers' re-shoring to the United States and near-shoring into Mexico intensify demand along the southern border, where cross-border flows make Laredo and El Paso prime warehouse construction zones. Grid connections lag behind automation uptake in legacy buildings, motivating on-site solar installations and micro-grids.
Asia Pacific delivers the fastest 7.21% CAGR through 2031, propelled by India’s forecast of more than 300 million square feet of Grade A stock by 2025 and policy incentives that promote logistics parks. Chinese developers follow consumer demand inland, while Belt and Road rail corridors extend regional connectivity. Southeast Asian nations such as Vietnam and Malaysia attract multinational distribution centers that diversify away from single-country dependence. Automated mega-warehouses like the 1.8 million-square-foot Omega 1 Bukit Raja in Malaysia showcase cutting-edge designs hardwired for e-commerce growth.
European operators navigate land scarcity and strict zoning, which lengthen entitlement timelines but also keep vacancy below global averages. Sustainability mandates spur retrofits featuring heat pumps and rooftop photovoltaics as corporate tenants seek carbon-neutral contracts. Eastern European hubs gain traction because of proximity to Western consumers and lower wage bases, complementing resilient port-centric clusters in the Netherlands and Belgium. South America and the Middle East & Africa remain nascent but rising investment in bonded-free zones and food security facilities widens their role in the worldwide warehousing and storage services market.

Regulatory Landscape
Cross-border warehousing demand is increasingly shaped by customs modernization and trusted-trader requirements, which shift more data, traceability, and compliance responsibilities into distribution networks. In March 2026, the European Parliament announced a deal on a comprehensive reform of the Union Customs Code, targeting improved e-commerce handling, product safety, and supply chain transparency. This raises the bar for documentation, seller accountability, and shipment-level visibility across EU-bound flows.
At the global level, the World Trade Organization noted in June 2026, during the second review of the Trade Facilitation Agreement (TFA), that 89% of implementation commitments have been met. This reinforces harmonized border processes that favor operators able to provide accurate advance data and compliant handling for consolidated shipments. Complementing this, the World Customs Organization SAFE Framework of Standards (2025 edition) adds a mandatory Code of Conduct (Ethics) requirement for Authorized Economic Operators (AEOs). As a result, compliance expectations extend to warehouse security, partner governance, and integrity controls that underpin AEO and bonded-warehouse operations.
Competitive Landscape
The warehousing and storage services market features moderate fragmentation as the top five providers collectively controls major part of global revenue, yet consolidation accelerates to secure scale and technology depth. DSV’s USD 15.9 billion (converted from EUR 14.3 billion) purchase of DB Schenker in April 2025 created a firm with USD 45.1 billion combined revenue and 160 000 employees, illustrating the premium placed on global end-to-end coverage. DHL Group continues a targeted acquisition spree, buying CRYOPDP and Inmar Supply Chain Solutions to strengthen healthcare logistics and return management capabilities.
Technology adoption delineates performance tiers. First movers deploy autonomous mobile robots, AI-driven slotting, and predictive maintenance to lift throughput and accuracy, enabling cost-plus pricing models that protect margins. Smaller regional providers often partner with robotics integrators under usage-based contracts to remain competitive without heavy capex. Specialized niches, such as GDP-certified pharma cold chain or hazardous material storage, offer defensible margins due to regulatory hurdles and liability complexity, drawing strategic interest from larger 3PLs seeking diversification.
Customers increasingly demand carbon-accounting dashboards, pushing operators to embed energy analytics into warehouse management systems. LEED and BREEAM certifications surface as bid differentiators, and landlords retrofit skylights, EV chargers, and solar arrays to meet tenant targets. Competitive intensity therefore hinges not only on network breadth but on digital maturity and sustainability credentials, shaping the evolving hierarchy within the warehousing and storage services market.
Warehousing And Storage Services Industry Leaders
DHL International GmbH
XPO Logistics Inc.
Ryder System Inc.
NFI Industries Inc.
FedEx Corp
- *Disclaimer: Major Players sorted in no particular order


Market Opportunities and Future Outlook
Port and terminal expansion programs are creating whitespace for port-centric warehousing, bonded storage, and value-added logistics near new capacity nodes, particularly where projects explicitly add cold-chain or inland logistics linkages. In July 2026, Mawani (Saudi Ports Authority) announced a USD 170 million expansion at Jeddah Islamic Port with partners DP World and Red Sea Gateway Terminal, including added terminal space and a cold-chain step-up (cold storage rooms increasing from eight to 75). This strengthens the business case for multi-temperature warehousing, reefer staging, and pharma/food-grade handling services connected to the gateway.
A parallel opportunity comes from using AI and robotics to address labor constraints and throughput volatility, alongside the expanding e-commerce and micro-fulfillment requirements reflected in the market context. 2026 industry surveys cited in the evidence pack show AI use in warehouse and supply chain management rising to 26% (from 19% in 2025), while 52% of surveyed organizations report utilizing one or more types of robots. Those adoption levels support more contract structures tied to productivity SLAs, retrofit-focused automation deployments in existing public warehouses, and premium offerings such as dynamic slotting, returns processing, and late-stage customization for retail, healthcare, and high-mix manufacturing customers.
Recent Industry Developments
- July 2026: Mawani (Saudi Ports Authority) announced a USD 170 million investment with DP World and Red Sea Gateway Terminal to expand Jeddah Islamic Port, adding terminal area, additional cranes, and increasing cold storage rooms from eight to 75. The cold-chain step-up and added throughput capacity support higher volumes of temperature-sensitive cargo, driving demand for adjacent multi-temperature warehousing and specialized handling services.
- April 2025: DSV finalized its acquisition of DB Schenker for about USD 15.9 billion, adding a large global facility footprint and expanding exposure to contract logistics. The enlarged platform strengthens network density for multi-country warehousing solutions and enables broader cross-selling of integrated freight and storage services.
- March 2024: The World Customs Organization maintained the SAFE Framework of Standards as a key reference for AEO and supply chain security programs, and the 2025 edition later introduced a mandatory Code of Conduct (Ethics) requirement for AEOs. The tighter integrity and governance emphasis increases compliance work for warehouse operators supporting bonded and cross-border flows, favoring providers with mature security, auditability, and partner-management processes.


Research Methodology Framework and Report Scope
Market Definition and Coverage
This market covers paid services where a third party stores goods in a facility and supports handling needed for storage, such as receiving, put-away, inventory control, and dispatch preparation. Revenue is counted when the service is delivered for general and temperature-controlled storage across industries and regions.
Scope exclusions: In-house captive warehousing costs inside a shipper's books, standalone transportation freight charges, and pure real estate leasing without service elements are excluded.
Segmentation Overview
- By Service Type
- General Warehousing and Storage
- Refrigerated Warehousing and Storage
- Farm-Product Warehousing and Storage
- By Ownership
- Private Warehouses
- Public Warehouses
- Bonded Warehouses
- By Duration of Storage
- Short-Term Storage
- Long-Term Storage
- By End-user Industry
- Manufacturing
- Consumer Goods
- Food and Beverage
- Retail and E-commerce
- Healthcare and Pharma
- Other End-user Industries
- By Geography
- North America
- United States
- Canada
- Mexico
- South America
- Brazil
- Argentina
- Rest of South America
- Europe
- Germany
- United Kingdom
- France
- Italy
- Spain
- Rest of Europe
- Asia-Pacific
- China
- Japan
- India
- South Korea
- ASEAN
- Rest of Asia-Pacific
- Middle East and Africa
- Middle East
- Saudi Arabia
- United Arab Emirates
- Rest of Middle East
- Africa
- South Africa
- Egypt
- Rest of Africa
- Middle East
- North America
Data Sources, Market Sizing, and Validation
Desk Research
Desk work starts by building the demand and operating context, so the market model stays anchored to logistics activity rather than only company narratives. We referenced public sources such as national statistics offices (for warehousing output and producer services), customs and trade databases for import and export flows, the World Bank and IMF for macro indicators tied to inventory cycles, and energy statistics sources such as the International Energy Agency to understand cost pressure in warehouse operations.
On the supply side, we reviewed annual reports, 10-K style filings, investor presentations, and reputable logistics and industrial real estate association publications to understand capacity adds, utilization themes, and service mix shifts (general versus refrigerated and longer versus shorter storage duration). Select paid subscriptions were used only for company financials and news screening, plus patent databases to sanity-check automation uptake. These desk sources are illustrative, and we used many other public references for cross-checks, clarification, and filling small data gaps.
Primary Interviews and Surveys
Primary work was used to pressure-test assumptions that desk sources do not clearly show, such as how storage pricing moves with occupancy, labor tightness, and energy intensity for cold facilities. We spoke with operators, facility managers, customer-side logistics leaders, and supporting participants across major regions, which helped us calibrate utilization ranges, typical contract duration, and how value-added fees show up in real agreements.
Distribution of primary research fieldwork respondents
| Company type | Respondent position | Region |
|---|---|---|
| Top tier: 39% | CXOs: 17% | APAC: 44% |
| Mid tier: 42% | Functional/Unit leaders: 28% | EMEA: 33% |
| Smaller Players: 19% | Managers: 55% | Americas: 23% |
Market-Sizing & Forecasting
Sizing is built using a top-down approach where logistics output and trade activity are reconstructed into a warehousing demand pool by region, and then adjusted for storage intensity and the mix of general versus temperature-controlled space. To keep totals realistic, we corroborate the model with selective bottom-up approximations, such as rolling up sampled operator revenues, checking price per pallet position or per square foot against occupancy, and validating volume direction through channel discussions.
Key inputs used in the model include regional warehousing output indices, import and export tonnage trends, industrial production and retail sales signals, e-commerce fulfillment intensity proxies, average warehouse occupancy levels, and observed pricing progression for general and cold storage. Where bottom-up signals are incomplete, gaps are handled using conservative coverage factors and then revisited after primary feedback on local market structure.
For forecasting, scenario analysis was applied around utilization and pricing, and then a multivariate regression was used to link revenue growth to drivers like trade volumes, industrial output, and inventory-cycle indicators. Assumptions were finalized after expert input aligned on what is most likely to change first, volume, price, or service mix, in each region.
Data Validation & Update Cycle
Outputs are checked against independent signals, so the final numbers do not drift away from the practical realities of storage activity. We run variance checks by region and by storage type, review outliers like sudden pricing jumps or utilization swings, and then re-check the supporting assumptions before internal sign-off.
If a material event occurs, such as a major capacity addition wave, a sharp energy cost shift for cold storage, or a policy change that impacts trade lanes, analysts re-contact select interviewees to confirm what changed and how fast it is flowing into contracts. The report is refreshed annually, and a final pre-delivery review is completed so clients receive the most current view available at the time of publication.
Mordor Intelligence's Warehousing and Storage Services Market Estimate Compared With Other Published Estimates
Published market sizes for warehousing and storage services can look far apart even when they discuss similar facilities, because scope and revenue counting rules differ. The gaps often come from whether the number is limited to warehousing services or blended with broader logistics, which year is used as the base, and how pricing is assumed to move with occupancy.
The main gap comes from whether captive warehousing and passive warehouse renting are included, where Mordor Intelligence counts only paid warehousing and storage service revenues that include operational service elements and then validates pricing with occupancy and cost checks.
Benchmark comparison
| Source | Market Size | Gaps in Research Methodology |
|---|---|---|
| Mordor Intelligence | USD 521.53 B (2025) | |
| Global Research House A | USD 291.29 B (2025) | Uses a narrower revenue pool that appears to undercount value-added warehousing fees and some storage-related contract services, which can compress the total for the same year. |
| Industry Analyst Group B | USD 487.60 B (2024) | Uses an earlier base year and a steeper growth path, and the scope statement is less explicit on excluding captive warehousing and pure leasing, which can shift the starting point and the forward run-rate. |
Across the table, the spread is mostly explained by what is counted as warehousing service revenue and how pricing is carried forward from utilization and cost signals. By keeping the counting rules clear and tying assumptions to observable indicators, the model remains repeatable and easier for buyers to reconcile with their logistics budgets.


Key Questions Answered in the Report
How large is the global warehousing and storage services market in 2026?
The market was valued at USD 521.53 billion in 2025, is estimated at USD 544.11 billion in 2026, and is on track to reach USD 672.36 billion by 2031, expanding at a 4.33% CAGR during 2026-2031.
Which region grows fastest through 2031?
Asia Pacific posts the quickest 7.21% CAGR thanks to infrastructure investment in nations such as India, China, and Vietnam.
What share do public warehouses hold today?
Public facilities account for 46.88% of 2025 global revenue, reflecting continued demand for flexible capacity.
Why is refrigerated warehousing expanding rapidly?
Rising volumes of vaccines, biologics, and online grocery orders drive a 5.36% CAGR for temperature-controlled space.
How is consolidation reshaping competition?
Mega-acquisitions like DSV-Schenker create scale platforms with integrated freight and warehousing, while niche specialists still prosper in regulated segments.
Which technology trend yields the quickest ROI?
AI-driven dynamic slotting and autonomous mobile robots boost pick rates and free floor space, delivering payback periods that often fall below three years.
Page last updated on:


 Your data is secure and never sold or shared.


