Tin Market Size and Share
Market Overview
| Study Period | 2020 - 2031 |
|---|---|
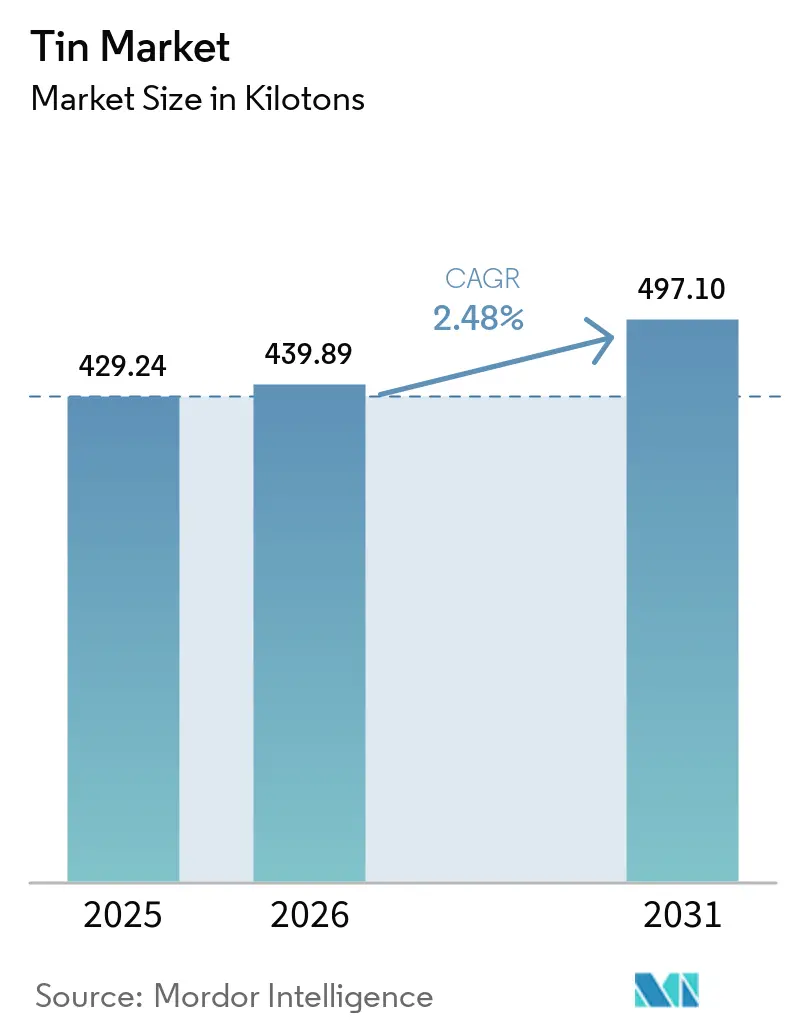
| Market Volume (2026) | 439.89 kilotons |
| Market Volume (2031) | 497.10 kilotons |
| Growth Rate (2026 - 2031) | 2.48% CAGR |
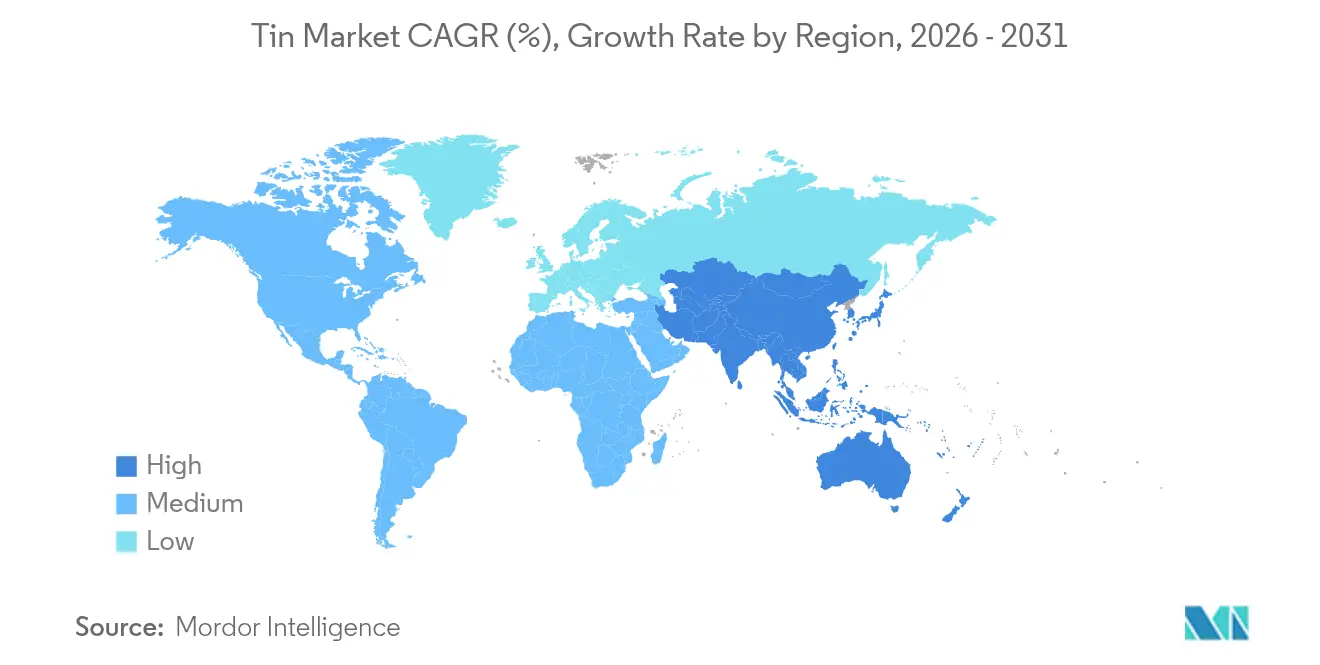
| Fastest Growing Market | Asia Pacific |
| Largest Market | Asia Pacific |
| Market Concentration | Medium |
Major Players *Disclaimer: Major Players sorted in no particular order Image © Mordor Intelligence. Reuse requires attribution under CC BY 4.0. | |
Tin Market Analysis by Mordor Intelligence
The Global Tin Market size in 2026 is estimated at 439.89 kilotons, growing from 2025 value of 429.24 kilotons with 2031 projections showing 497.1 kilotons, growing at 2.48% CAGR over 2026-2031. Structural tightness caused by Myanmar’s political instability and supply risks in the Democratic Republic of Congo underpins price stability despite modest volume growth. The metal’s by-product nature—where production depends on copper, lead, and zinc mining—magnifies price swings by nearly 50% versus primary metals and forces manufacturers to secure diverse sources[1]United Nations Department of Economic and Social Affairs, “Harnessing the Potential of Critical Minerals for Sustainable Development,” UN.org . Asia-Pacific, home to China’s electronics complex and Indonesia’s smelters, absorbs close to seven-tenths of global demand and posts region-leading growth, while North American and European buyers accelerate local sourcing and recycling initiatives to cut exposure to supply disruptions.
Key Report Takeaways
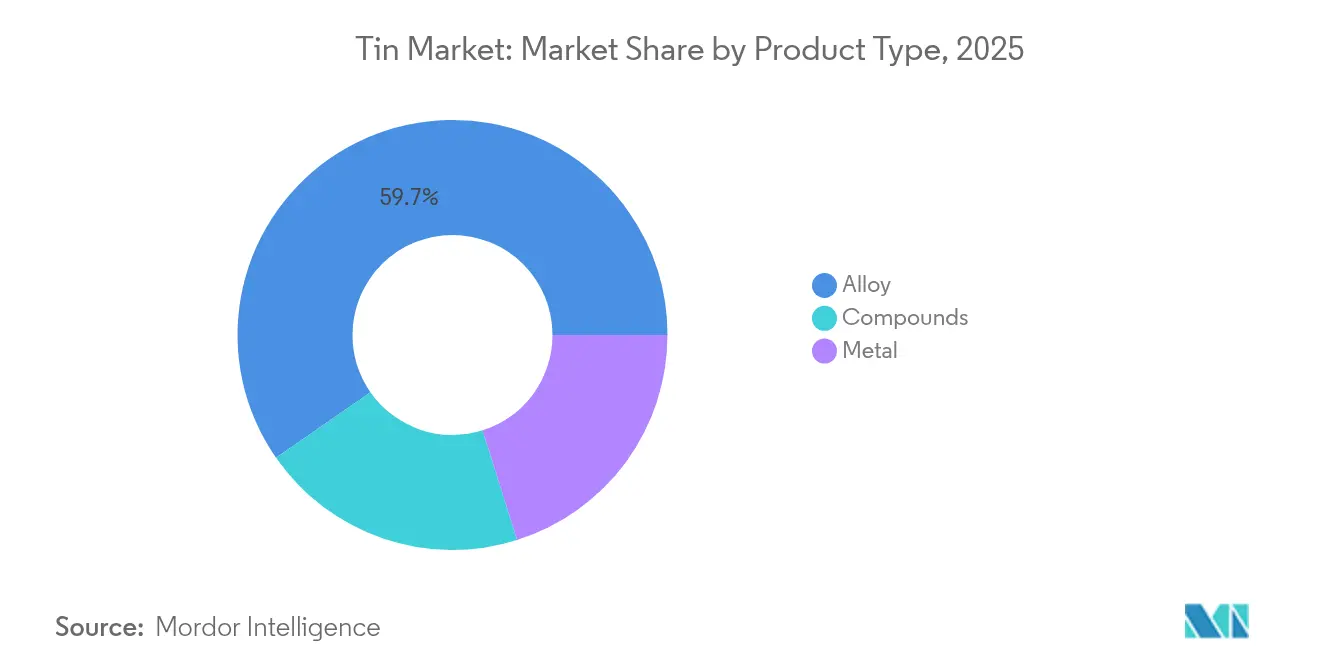
- By product type, alloys captured 59.68% of the tin market share in 2025, while the metal segment is projected to expand at a 3.05% CAGR to 2031.
- By application, solder captured 48.10% of the market in 2025, while lead-acid batteries are growing at a CAGR of 3.72% through 2031.
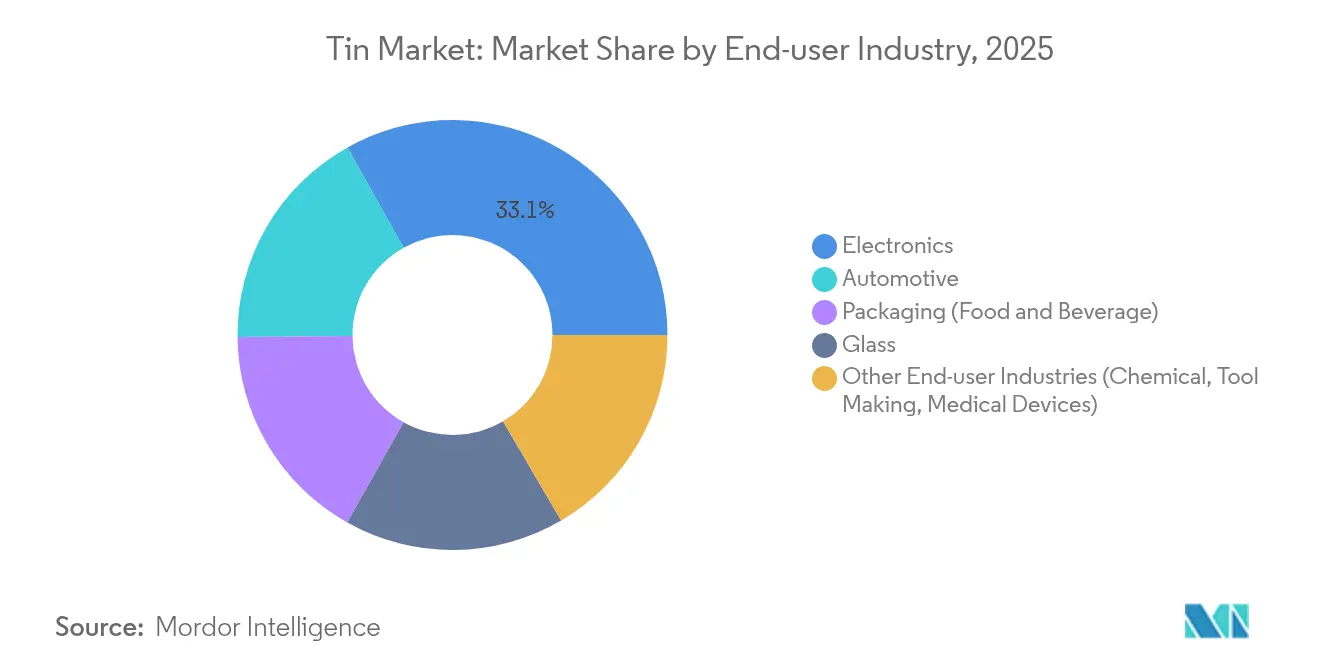
- By end-user industry, the automotive sector held 3.74% of the tin market growth CAGR between 2026 and 2031, whereas electronics retained 33.12% of the 2025 revenue share.
- By geography, Asia-Pacific commanded 68.85% of 2025 consumption and is forecast to post a 3.12% CAGR to 2031.
Note: Market size and forecast figures in this report are generated using Mordor Intelligence’s proprietary estimation framework, updated with the latest available data and insights as of 2026.
Global Tin Market Trends and Insights
Drivers Impact Analysis*
| Drivers | (~) % Impact on CAGR Forecast | Geographic Relevance | Impact Timeline |
|---|---|---|---|
| Growing demand for solder in electronics | +0.8% | Global, concentrated in Asia-Pacific | Medium term (2-4 years) |
| Rising adoption in EV power and thermal-management components | +0.6% | North America, Europe, China | Long term (≥ 4 years) |
| Expanding use in tin-plating for food and beverage cans | +0.4% | Global, emerging markets focus | Short term (≤ 2 years) |
| Break-throughs in lead-free tin-based perovskite solar cells | +0.3% | Global, early adoption in Europe, China | Long term (≥ 4 years) |
| Tin-rich composite anodes for solid-state batteries | +0.2% | Asia-Pacific, North America | Long term (≥ 4 years) |
| Source: Mordor Intelligence | |||


Growing Demand for Solder in Electronics
Electronics solder remained the largest application, accounting for 48.56% of 2024 consumption as manufacturers transitioned to lead-free alloys to meet RoHS mandates. Fifth-generation wireless infrastructure and smaller semiconductor packages drive higher tin loading per unit because advanced solder alloys require 95–99% purity rather than legacy 60–63% blends. The migration to silver sintering in high-temperature automotive modules limits solder growth in power electronics, yet leaves consumer devices largely dependent on tin. Stannic chloride chemical vapor deposition precursors for GeSn epitaxy create a niche, high-margin outlet that can influence electronic-grade tin prices. Localization programs in North America and Europe fuel investment in domestic solder production, tempering dependence on Asian suppliers while adding incremental tonnage to the tin market.
Rising Adoption in EV Power and Thermal-Management Components
Automotive demand for market volumes accelerates as electric-vehicle power electronics need thermally conductive alloys for inverters and battery packs. Modules using silicon carbide chips push junction temperatures higher, favoring copper-tin intermetallic bonding that withstands extreme thermal cycling. Transient liquid-phase joining consumes different feedstock grades than conventional solder, prompting alloy developers to refine purity levels and wetting characteristics. Department of Energy density targets of 100 kW/L by 2025 intensify interest in tin-rich solutions that manage heat while minimizing footprint. Premium pricing arises from stringent OEM qualification cycles, and the competitive balance between tin metallization and silver sintering will shape long-term penetration in high-performance EV segments across the global tin market.
Expanding Use in Tin-Plating for Food and Beverage Cans
Tin-plated steel protects food and beverage containers from corrosion and ensures compliance with safety standards, anchoring a stable and price-inflexible demand base for the market. Urbanization in Asia, Africa and Latin America widens can consumption faster than global averages, and tin-plated steel’s recyclability appeals to circular-economy regulations. Thin-film electro-plating lines now achieve protective coatings with lower tin thickness, reducing metal usage per unit but increasing line speed and total throughput. Sustainability campaigns that shift certain beverages to aluminum cans impose limited downside because tinned steel retains an advantage in shelf-life sensitive foods. Purity specifications dictated by food-contact rules sustain a premium to commodity tin market prices, anchoring profitability for producers certified to stringent quality controls.
Break-throughs in Lead-Free Tin-Based Perovskite Solar Cells
Tin-based perovskite cells recorded 26.1% efficiency in 2024 and eliminated lead toxicity concerns, positioning tin as a cornerstone for next-generation photovoltaics once stability hurdles are solved[2]National Renewable Energy Laboratory, “Best Research-Cell Efficiency Chart,” Nrel.gov. Commercialization will require high-purity iodide and fluoride precursors available from only a handful of integrated refineries, opening a differentiated sub-segment within the broader market. Early rollouts target jurisdictions with strict hazardous-substance bans, allowing suppliers to command attractive margins. Continuous-flow deposition techniques under development in Europe and China signal volume scale-up by the late decade, potentially adding several kilotons of annual demand. Device lifetime improvements through encapsulation and alloying remain critical before utility-scale adoption reshapes the tin market demand curve.
Restraints Impact Analysis*
| Restraints | (~) % Impact on CAGR Forecast | Geographic Relevance | Impact Timeline |
|---|---|---|---|
| Availability of aluminium/zinc/lead-free solder substitutes | -0.7% | Global, advanced manufacturing regions | Medium term (2-4 years) |
| Price volatility from artisanal and conflict-area supply | -0.4% | Global, sourcing from DRC, Myanmar | Short term (≤ 2 years) |
| Rising ESG-compliance cost in Myanmar and DRC supply chains | -0.3% | Global, affecting responsible sourcing | Medium term (2-4 years) |
| Source: Mordor Intelligence | |||
Availability of Aluminium/ Zinc/Lead-Free Solder Substitutes
Silver sintering and aluminum wire bonding increasingly displace tin-based alloys in automotive power modules that operate above 175 °C junction temperatures. Copper direct bonding and pressure-contact systems further reduce tin per device in high-reliability applications. Uptake, however, remains limited by capital cost, process complexity and lengthy automotive qualification cycles that favor legacy tin-rich solders. In consumer electronics, tin maintains a cost-performance sweet spot against pricier silver systems, preserving a large portion of tin market demand. Long-term competitive pressure will depend on process innovation that narrows cost gaps and enhances throughput for alternative metallization methods.
Price Volatility from Artisanal and Conflict-Area Supply
Myanmar’s coup and disruptions in the Democratic Republic of Congo removed close to 15% of global concentrate availability, pushing Shanghai Metal Market cash prices. Artisanal output introduces inconsistent quality, elevating smelter rejection rates and increasing working-capital needs. Responsible Minerals Initiative audits raise compliance costs and restrict supplier pools, especially for automotive and aerospace end-users with strict traceability demands. Secondary tin from recycling cushions the blow yet cannot fully neutralize volatility during acute geopolitical crises. Many downstream buyers secure multi-regional contracts and strategic inventories to shield production schedules, yet price pass-through remains challenging in competitive electronics markets.
*Our forecasts treat driver/restraint impacts as directional, not additive. The impact forecasts reflect baseline growth, mix effects, and variable interactions.
Segment Analysis
By Product Type: Alloys Dominate Industrial Applications
Alloys held 59.68% tin market share in 2025 as precise composition control underpinned widespread solder, bearing, and specialty-metal formulations. The alloy segment benefits from economies of scope because smelters can tailor tin-lead, tin-silver, and tin-copper blends without major capital outlays, sustaining margins even during volatile ore markets. The pure metal category recorded 99.95% purity output that caters to semiconductor, battery, and photovoltaic uses and is set to register a 3.05% CAGR through 2031, lifting its contribution to the overall tin market size.
Producers such as Aurubis leverage multimetal recycling streams to exceed 10,000 metric-ton annual refined tin capacity, recovering metal from anode sludge and complex scrap while meeting ISO 9001 and ISO 14001 certifications. Such integrated flows diversify supply, reduce Scope 3 emissions, and appeal to automakers that pursue net-zero value chains.


By Application: Solder Leadership Faces Battery Challenge
Solder retained 48.10% of 2025 demand due to its ubiquity in circuit boards, connectors, and fine-pitch semiconductors, securing a core pillar of the market. However, start-stop automotive systems, stationary storage, and renewable grid buffers propel lead-acid batteries to a 3.72% CAGR through 2031, steadily expanding tin usage in grid alloys. A typical battery grid now uses 0.7–1.2% tin to improve corrosion resistance and conductivity, translating into sizeable incremental tonnage as global vehicle fleets electrify.
Tin plating for cans, appliance housings, and industrial components provides a consumption baseline with low volatility and dependable pricing structures. Meanwhile, chemical derivatives such as organotin stabilizers in PVC sustain niche but profitable avenues where technical barriers prevent easy substitution. Battery researchers evaluate tin-sulfur and tin-carbon composites for next-gen storage beyond lead-acid, offering a potential second-wave uplift. Manufacturers that straddle both solder and battery alloy supply secure hedges against segment shifts and can flex production to customer needs, reinforcing their relevance across the evolving tin market.
By End-User Industry: Automotive Acceleration Reshapes Demand
Electronics commanded 33.12% of 2025 demand yet faces a relative decline in share as automotive applications expand fastest at a 3.74% CAGR. Electric-vehicle architectures use high-conductivity tin in busbars, transistor attach layers, and battery thermal pads where performance and safety converge. Passenger vehicle share gains also generate secondary demand in charging infrastructure, adding tin to power electronics for converters and inverters. Packaging sustains a mature yet resilient base where corrosion prevention and recyclability keep tinned steel integral to canned foods, pet nutrition, and aerosol products. The glass sector absorbs tin oxide in float-glass lines and low-emissivity coatings, locking in stable annual off-take.
Diversification emerges as medical implants, antimicrobial surfaces, and advanced composites exploit tin’s biocompatibility and low melting point. Tool makers alloy tin with copper molds for plastic injection because it enhances thermal conductivity and extends life cycles. Growth strategies increasingly revolve around high-value niches rather than pure tonnage, prompting suppliers to invest in application engineering teams that work alongside OEMs. The ability to pivot across end-user verticals adds resilience and positions integrated producers to capture emerging tin market demand vectors as digitization and decarbonization reshape industrial material flows.
Geography Analysis
Asia-Pacific dominated with 68.85% consumption in 2025, driven by China’s electronics manufacturing and Indonesia’s mining capacity. Regional tin market size growth at 3.12% CAGR leverages government incentives for electric-vehicle production in China and battery supply-chain build-out across the ASEAN bloc. Chinese concentrate output faced environmental curbs and resource depletion at Yunnan and Guangxi deposits, prompting smelters to import higher-grade ore, while Indonesia’s PT Timah battled corruption probes that temporarily restricted exports.
North America’s tin market advances on supply-chain security initiatives that reward domestic recycling. Aurubis invested USD 800 million in its Richmond, Georgia multimetal plant capable of processing 180,000 tons of complex scrap annually, ensuring a reliable supply for U.S. automotive and aerospace primes.
Europe shows mature yet sustainability-focused tin consumption. Germany leads uptake in EV power electronics, and Aurubis’s Hamburg complex boosts high-purity supply through its Advanced Sludge Processing unit that refines anode mud into tin and specialty metals.
The Middle-East and Africa remains a minor consumer, although infrastructure expansion and nascent automotive assembly may lift demand incrementally. Political risks in the Democratic Republic of Congo restrain upstream investment despite sizable resource potential, keeping the region a swing factor in global tin market supply stability.

Competitive Landscape
The tin market features moderate fragmentation with regional champions and a rising cohort of recyclers. Yunnan Tin Group leverages proximity to Chinese OEMs, though shrinking ore grades and stricter emission norms pressure its cost curve. Malaysia Smelting Corporation capitalizes on Southeast Asian feedstock and toll-smelting agreements, prioritizing efficient concentrate turnaround to retain electronics clientele. Strategic moves pivot toward downstream integration and specialty alloy development rather than greenfield mines due to ESG hurdles and capital intensity. Technology adoption differentiates players; hydrometallurgical leaching and electrolytic refining enable lower carbon footprints and recovery of trace indium and gallium. Compliance with ISO and Responsible Minerals Initiative standards acts as a license to operate, particularly for suppliers to automotive and aerospace sectors.
Tin Industry Leaders
YUNNAN TIN COMPANY GROUP LIMITED
Timah
MINSUR
Malaysia Smelting Corporation Berhad
Thailand Smelting & Refining Co. Ltd (Thaisarco)
- *Disclaimer: Major Players sorted in no particular order


Recent Industry Developments
- September 2025: Andrada Mining reported a 17% year-on-year increase in tin concentrate output to 453 tons at its Uis mine in Namibia for the quarter ending August 31, 2025.
- August 2025: Timah set a refined tin production target of 21,545 metric tons by December 2025, citing expanded reserves, fleet upgrades, and additional mine sites.


Global Tin Market Report Scope
Tin is a soft, pliable, and silvery-white metal with malleability and ductility characteristics. It is mainly derived from cassiterite, which contains about 80% tin.
The tin market is segmented by product type, application, end-user industry, and geography. By product type, the market is segmented into metal, alloy, and compounds. By application, the market is segmented into solder, tin plating, chemicals, and other applications (specialized alloys and lead-acid batteries). In the end-user industry, the market is segmented into automotive, electronics, packaging (food and beverage), glass, and other end-user industries (chemical, tool making, and medical devices). The report also covers the market size and forecasts for the tin market across 16 countries and the production scenario for 10 countries across various regions. For each segment, the market sizing and forecasts are done based on volume (tons).
| Metal |
| Alloy |
| Compounds |
| Solder |
| Tin Plating |
| Chemicals |
| Lead-acid Batteries |
| Other Applications (Specialized Alloys) |
| Automotive |
| Electronics |
| Packaging (Food and Beverage) |
| Glass |
| Other End-user Industries (Chemical, Tool Making, Medical Devices) |
| Production Analysis | Australia | |
| Bolivia | ||
| Brazil | ||
| Burma | ||
| China | ||
| Congo (Kinshasa) | ||
| Indonesia | ||
| Malaysia | ||
| Peru | ||
| Vietnam | ||
| Other Countries | ||
| Consumption Analysis | Asia-Pacific | China |
| India | ||
| Japan | ||
| South Korea | ||
| Rest of Asia-Pacific | ||
| North America | United States | |
| Canada | ||
| Mexico | ||
| Europe | Germany | |
| United Kingdom | ||
| France | ||
| Italy | ||
| Austria | ||
| Rest of Europe | ||
| South America | Brazil | |
| Argentina | ||
| Rest of South America | ||
| Middle-East and Africa | Saudi Arabia | |
| South Africa | ||
| Rest of Middle East and Africa | ||
| By Product Type | Metal | ||
| Alloy | |||
| Compounds | |||
| By Application | Solder | ||
| Tin Plating | |||
| Chemicals | |||
| Lead-acid Batteries | |||
| Other Applications (Specialized Alloys) | |||
| By End-user Industry | Automotive | ||
| Electronics | |||
| Packaging (Food and Beverage) | |||
| Glass | |||
| Other End-user Industries (Chemical, Tool Making, Medical Devices) | |||
| By Geography | Production Analysis | Australia | |
| Bolivia | |||
| Brazil | |||
| Burma | |||
| China | |||
| Congo (Kinshasa) | |||
| Indonesia | |||
| Malaysia | |||
| Peru | |||
| Vietnam | |||
| Other Countries | |||
| Consumption Analysis | Asia-Pacific | China | |
| India | |||
| Japan | |||
| South Korea | |||
| Rest of Asia-Pacific | |||
| North America | United States | ||
| Canada | |||
| Mexico | |||
| Europe | Germany | ||
| United Kingdom | |||
| France | |||
| Italy | |||
| Austria | |||
| Rest of Europe | |||
| South America | Brazil | ||
| Argentina | |||
| Rest of South America | |||
| Middle-East and Africa | Saudi Arabia | ||
| South Africa | |||
| Rest of Middle East and Africa | |||


Key Questions Answered in the Report
How big is the tin market in 2026?
The tin market size reached 439.89 kilotons in 2026 and is forecast to grow steadily at a 2.48% CAGR through 2031.
Which application is growing fastest for tin?
Lead-acid batteries post the highest growth at a 3.72% CAGR, driven by grid storage projects and automotive start-stop systems.
Why is Asia-Pacific so important in the tin supply chain?
Asia-Pacific accounts for 68.85% of 2025 consumption because China dominates electronics output and Indonesia remains the largest refined tin supplier.
What risks affect long-term tin availability?
Political instability in Myanmar, artisanal mining in the Democratic Republic of Congo and rising ESG compliance costs create supply volatility.
How are recycling technologies shaping the tin market?
Multimetal recyclers such as Aurubis recover tin from electronic scrap and anode sludge, adding new refined metal streams and improving supply security.
What new technologies could boost tin demand?
Tin-based perovskite solar cells and tin-rich composite anodes for solid-state batteries represent emerging high-purity demand segments poised to scale after 2028.
Page last updated on:


