Market Overview
| Study Period | 2018 - 2031 |
|---|---|
| Forecast Data Period | 2026 - 2031 |
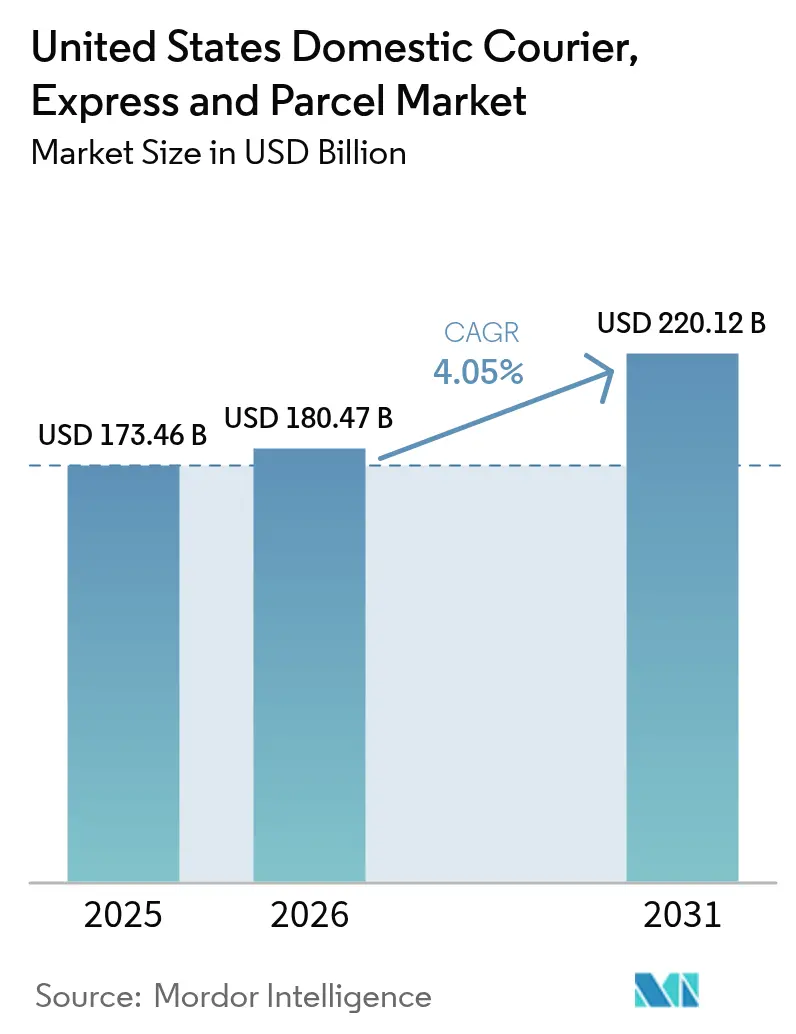
| Base Year Market Size (2025) | USD 173.46 Billion |
| Market Size (2026) | USD 180.47 Billion |
| Market Size (2031) | USD 220.12 Billion |
| Growth Rate (2026 - 2031) | 4.05% CAGR |
| Market Concentration | High |
Major Players *Disclaimer: Major Players sorted in no particular order Image © Mordor Intelligence. Reuse requires attribution under CC BY 4.0. | |
United States Domestic Courier, Express And Parcel Market Analysis by Mordor Intelligence
The United States Domestic Courier, Express And Parcel Market size is expected to grow from USD 173.46 billion in 2025 to USD 180.47 billion in 2026 and is forecast to reach USD 220.12 billion by 2031 at 4.05% CAGR over 2026-2031.
The headline growth masks rapid internal shifts: surging e-commerce parcels, the widening use of third-party fulfillment by small businesses, and rising demand for same-day delivery are all expanding shipment volumes even as traditional retail traffic eases. Advances in dynamic-routing software, crowd-sourced driver networks, and micro-fulfillment centers are compressing delivery distances and improving stop density, lowering unit costs for carriers able to deploy these tools. At the same time, federal incentives worth USD 3 billion are accelerating electric-fleet adoption, promising 20-30% lifecycle cost savings and ensuring compliance with emerging zero-emission mandates. However, urban curb-use fees, driver shortages, and fuel-price volatility continue to raise operating expenses and pressure margins. Overall, the United States domestic courier market remains resilient, with carriers balancing network scale against agile technology investments to preserve profitability while meeting evolving customer expectations
Key Report Takeaways
- By speed of delivery, non-express services accounted for 53.62% of the United States domestic courier market share in 2025, while express services are expanding at a 4.72% CAGR between 2026-2031.
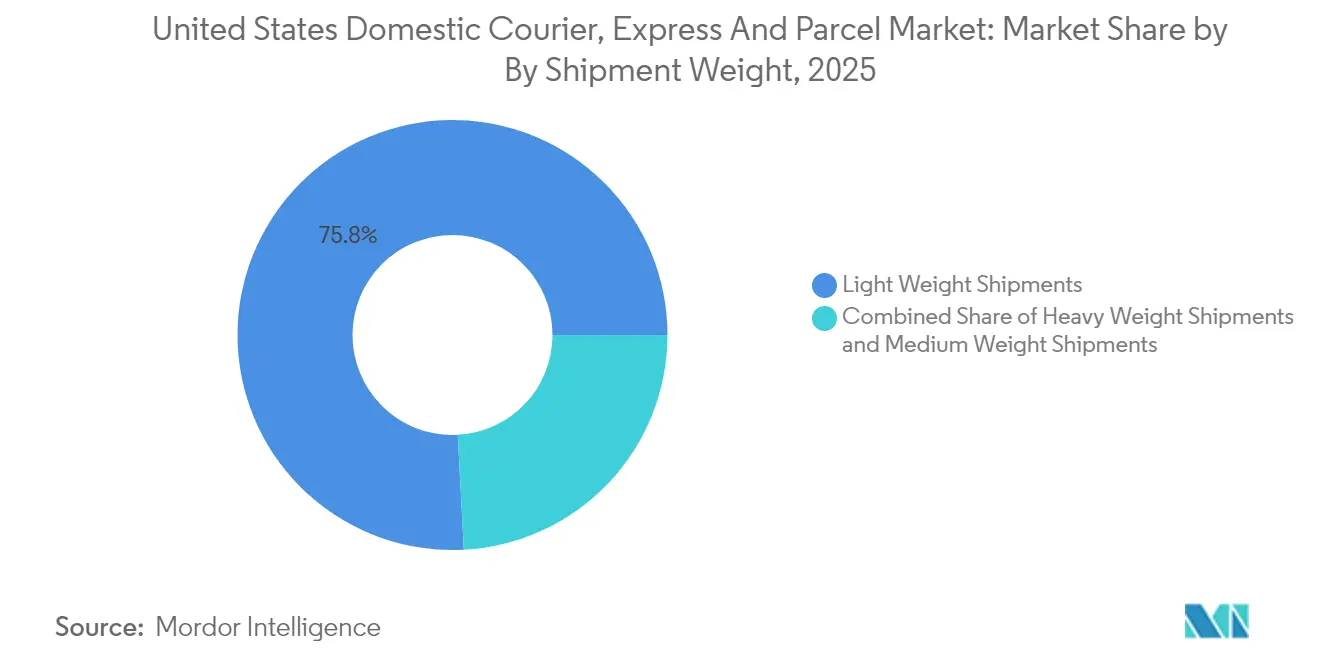
- By shipment weight, light parcels captured 75.84% share of the United States domestic courier market size in 2025, whereas medium-weight parcels are projected to rise at a 2.42% CAGR between 2026 and 2031.
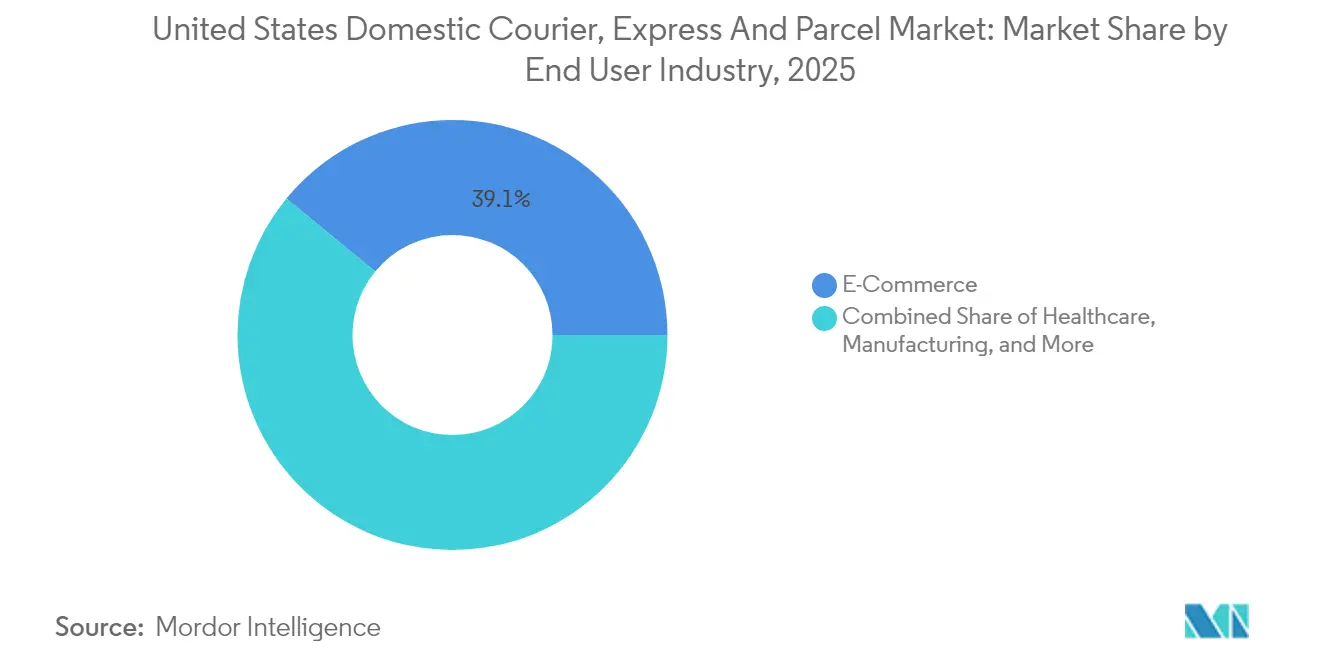
- By end user industry, e-commerce held 39.05% of the revenue share in 2025; healthcare is forecast to advance at a 4.36% CAGR between 2026-2031.
- By model, the business-to-consumer (B2C) segment represented 47.25% of the revenue share in 2025, while business-to-business (B2B) flows are growing at a 3.6% CAGR between 2026-2031.
Note: Market size and forecast figures in this report are generated using Mordor Intelligence’s proprietary estimation framework, updated with the latest available data and insights as of 2026.
United States Domestic Courier, Express And Parcel Market Trends and Insights
Drivers Impact Analysis*
| Driver | (~) % Impact on CAGR Forecast | Geographic Relevance | Impact Timeline |
|---|---|---|---|
| E-commerce boom | +1.2% | National urban corridors | Medium term (2-4 years) |
| SME uptake of 3PL fulfillment | +0.8% | TX, CA, NY early adopters | Short term (≤ 2 years) |
| Rise of subscription retail | +0.6% | Major metros | Long term (≥ 4 years) |
| Zero-emission fleet incentives | +0.5% | CA, Northeast | Medium term (2-4 years) |
| Crowdsourced delivery scale-up | +0.4% | Urban and suburban | Short term (≤ 2 years) |
| AI-based dynamic routing | +0.3% | Tech-forward states | Long term (≥ 4 years) |
| Source: Mordor Intelligence | |||


E-commerce Boom Intensifying Last-Mile Volumes
Parcel throughput topped 23.8 billion pieces in 2024, cementing e-commerce as the single largest demand engine for the United States domestic courier market[1]ShipMatrix, “2024 Parcel Market Report,” shipmatrix.com. Year-round subscription programs, flash-sale events, and same-day order promises have flattened traditional seasonality and lifted daily baseline volumes. Retailers now stock micro-fulfillment sites within 10 miles of dense population clusters, cutting average delivery miles yet boosting daily stops per route. Eight states generate a disproportionate share of outbound parcels, favoring carriers that densify assets in those corridors. AI-driven demand forecasting lets merchants position inventory closer to shoppers, further tightening delivery windows. Taken together, these shifts accelerate drop density and raise service expectations across the United States domestic courier market.
SME Adoption of Third-Party Fulfillment Platforms
Forty-four percent of U.S. SMEs intend to shift logistics providers via online B2B marketplaces during 2025, seeking enterprise-grade shipping performance without owning trucks or warehouses[2]Thomasnet, “B2B Ecommerce Trends Report,” thomasnet.com. Third-party logistics firms pool orders across hundreds of brands, enabling same-day promises once limited to big retailers. Typical users cut logistics expense 15-25% and lift on-time delivery scores when migrating to shared networks. Regional 3PL hubs across Texas, California, and New York shorten shipping zones for SMEs and enlarge the United States domestic courier market by injecting fresh B2B volume. Over the next two years, this outsourcing trend remains the clearest near-term catalyst for parcel growth.
Shift Toward Subscription-Based Retail Models
Free-shipping memberships have been shown to raise per-customer revenue by 12.75% and increase order frequency, translating into steadier weekly parcel flows for carriers[3]Journal of Business Research, “Subscription-Based Retail Models and Customer Revenue Impact,” sciencedirect.com. Predictable renewal cycles let couriers pre-build routes, raising stop density and lowering cost per package. Retailers value delivery reliability over pennies saved, granting carriers pricing leverage within the United States domestic courier industry. Dense clusters of subscription recipients inside metropolitan areas reduce average dwell time per stop and sustain premium express demand. As brands diversify into replenishment boxes for pet care, cosmetics, and industrial supplies, recurring shipments will extend the United States domestic courier market’s growth runway well beyond core e-commerce orders.
Government Incentives for Zero-Emission Fleets
A combined USD 9.6 billion USPS investment plus USD 3 billion in federal grants is propelling the largest fleet electrification program in courier history. Purchase credits of up to USD 40,000 per electric van to eliminate the upfront cost gap with diesel units. Over five- to seven-year service lives, carriers may trim total operating cost 20-30% while complying with California’s Advanced Clean Trucks rule. These economics encourage early adopters to lock in lower variable costs and strengthen ESG credentials, positioning zero-emission adoption as a medium-term accelerator for the United States domestic courier market.
Restraints Impact Analysis*
| Restraint | (~) % Impact on CAGR Forecast | Geographic Relevance | Impact Timeline |
|---|---|---|---|
| Urban congestion and curb fees | -0.8% | NYC, SF, Seattle | Short term (≤ 2 years) |
| Driver shortages and wage inflation | -1.1% | Midwest, Southeast | Medium term (2-4 years) |
| Jet-fuel and diesel price swings | -0.6% | National long-haul lanes | Short term (≤ 2 years) |
| Opposition to micro-hubs | -0.4% | Suburban neighborhoods | Long term (≥ 4 years) |
| Source: Mordor Intelligence | |||
Rising Urban Congestion Tolls and Curb-Use Fees
Congestion pricing in New York City and planned schemes in San Francisco and Seattle will levy fees on commercial vehicles entering dense cores, adding direct cost and prolonging dwell times[4]INRIX, “2024 Global Traffic Scorecard,” inrix.com. Reduced loading zones and strict delivery windows have already cut productivity 10-15% for city routes, where parcel density is otherwise highest. Expansion of bike lanes and pedestrian plazas further squeezes curb access. Carriers are experimenting with consolidated parcel lockers and off-peak deliveries, but implementation costs weigh on margins across the United States domestic courier market.
Acute Driver Shortages and Wage Inflation
The nation faced 78,000 unfilled truck-driver positions in 2024; retirements and scant new entrants suggest the gap will widen. UPS offered voluntary retirement payments of USD 1,800 per service year to rebalance its aging workforce. Rising recruitment bonuses and overtime premiums ripple through the cost base, especially for regional carriers that lack scale. In the medium term, labor scarcity remains the single largest drag on the United States domestic courier market CAGR.
*Our forecasts treat driver/restraint impacts as directional, not additive. The impact forecasts reflect baseline growth, mix effects, and variable interactions.
Segment Analysis
By End User Industry: Healthcare Surges Ahead of E-commerce Base
E-commerce retained a 39.05% share in 2025 and anchors network density, but growth is flattening as online penetration approaches saturation among urban millennials. Conversely, healthcare parcels—temperature-controlled medications, diagnostic kits, and medical devices—are projected to grow 4.36% CAGR between 2026-2031, elevating their revenue footprint inside the United States domestic courier market. Regulatory chain-of-custody rules and the Drug Supply Chain Security Act require scanning, signature capture, and tamper-evident packaging, allowing carriers to charge premium rates.
Manufacturing and wholesale trade continue to send steady B2B flows that stabilize trailer-fill ratios on trunk lines. Financial services linger as a low-volume but high-value niche for document exchange and secure transport. Diversification protects carriers from cyclical shocks in any single sector and positions the United States domestic courier industry for balanced long-term expansion.


By Speed of Delivery: Express Services Capture Premium Demand
Express products generate smaller volumes than non-express offerings yet deliver stronger revenue growth, advancing at 4.72% CAGR between 2026-2031. Same-day and next-day guarantees have evolved from luxury to baseline expectation in the United States domestic courier market as online retailers court customer loyalty with fast, free shipping. The express segment’s higher yield per package offsets incremental cost when carriers apply advanced sorting, time-definite routing, and dynamic air-to-ground swaps. Meanwhile, non-express remains the volume backbone, holding 53.62% of the United States domestic courier market share in 2025 because bulk shippers pursue the lowest-landed-cost solutions.
Carriers with nationwide air assets retain a structural advantage, but nimble regional players are carving out city-pair lanes where they can outperform national networks on speed and service personalization. Large retailers increasingly employ a hybrid model that injects low-priority parcels into ground networks while escalating time-sensitive orders into premium lanes, enlarging the revenue pool for both service tiers. Over the forecast window, the United States domestic courier market size attached to express lanes is expected to reach USD 102.6 billion, with adoption heavily skewed toward electronics, luxury goods, and pharmaceutical replenishment.
By Shipment Weight: Light Parcels Dominate, Medium Parcels Accelerate
Light parcels commanded 75.84% of total value in 2025 thanks to the enduring pull of e-commerce fashion, consumer electronics, and health-and-beauty goods. Automated induction tunnels and high-speed sorters enable carriers to process these items at scale, keeping unit costs low and reinforcing their dominance within the United States domestic courier market. Dimensional-weight pricing has pushed merchants to optimize packaging, further decreasing average parcel mass and trimming fuel burn per stop.
Medium-weight traffic is expanding at a 2.42% CAGR between 2026-2031 as distributors of industrial supplies and auto parts leverage direct-to-mechanic shipping. This cohort is valuable: carton sizes align with automated sorters yet yield higher per-package revenue than lightweight items. Heavy parcels remain a niche; oversize thresholds divert many shipments into less-than-truckload channels, limiting the heavy-parcel share of the United States domestic courier market size to under 5%. For carriers, maintaining flexible conveyor widths and modular cages is essential to absorb demand fluctuations across weight bands without impairing throughput.
By Model: B2C Leads, B2B Gains Ground on Regionalized Supply Chains
B2C accounted for 47.25% of revenues in 2025, reflecting households’ appetite for doorstep delivery convenience. Subscription commerce, grocery replenishment, and marketplace reseller activity all contribute to dense residential routes. Yet B2B consignments are climbing at 3.6% CAGR between 2026-2031 as manufacturers decentralize inventory into micro-DC networks and place more purchase orders via digital portals.
Predictable weekday B2B rhythms complement volatile evening residential peaks, allowing carriers to smooth equipment utilization. Contracts often span three to five years, providing revenue visibility absent from spot-rate B2C shipping. The United States domestic courier market size associated with B2B flows is forecast to top USD 112.4 billion by 2031, creating scope for specialized day-definite products tailored to industrial buyers.
Geography Analysis
California, Texas, New York, Florida, Illinois, Pennsylvania, Ohio, and Georgia together generate more than 60% of parcel originations, underscoring the spatial concentration of the United States domestic courier market. Dense, high-income metros such as Los Angeles, Dallas-Fort Worth, and New York City exhibit the highest parcel-per-capita ratios and sustain robust demand for express services.
The Southeast is the fastest-growing sub-market, buoyed by inbound population migration, automotive manufacturing reshoring, and a wave of 1 million sq ft distribution centers along the I-85 and I-75 corridors. Parcel volume here is advancing 6-7% annually, outpacing the national average and broadening the addressable network for regional carriers. Midwestern states supply consistent B2B freight tied to durable-goods production, though slower population growth tempers residential deliveries.
Rural zones remain thinly served; however, crowd-sourced driver platforms and USPS “last-mile handoff” agreements are unlocking cost-effective reach into frontier counties. Cross-border shipments moving between U.S. origins and Canadian or Mexican destinations account for a small but rising slice of United States domestic courier market share, especially after USMCA procedures simplified documentation for low-value goods.
Competitive Landscape
The three national incumbents—UPS, FedEx, and USPS—still account for a major share of revenue, but regional parcel specialists such as OnTrac, LaserShip, and Spee-Dee are expanding 25-30% per year inside their home territories. Technology-first entrants leverage route-planning AI, real-time driver apps, and seven-day coverage to undercut legacy service levels in specific ZIP-code clusters.
Consolidation is active: GLS bought regional assets to extend its Dallas footprint in July 2025, while national carriers acquire tech startups to accelerate autonomous-vehicle pilots. Electrification investment is another competitive differentiator; USPS’s multibillion-dollar electric van order pressures rivals to unveil similar timelines or risk ESG-conscious shippers shifting wallets.
Crowdsourced delivery networks such as Roadie now integrate directly with retailer checkout APIs, adding flexible capacity during peak surges without long-term fixed cost. Nevertheless, compliance burdens—from driver background checks to municipal emissions rules—erect entry barriers and preserve pricing power for incumbents in the United States domestic courier market.
United States Domestic Courier, Express And Parcel Industry Leaders
FedEx
United Parcel Service of America, Inc. (UPS)
USPS
DHL Group
International Distributions Services (including GLS)
- *Disclaimer: Major Players sorted in no particular order

Recent Industry Developments
- October 2025: USPS launched the Informed Delivery mobile app, offering customers digital previews of incoming mail and package-tracking tools on smartphones.
- September 2025: OnTrac partnered with Fenix Commerce to embed precise delivery-date promises at checkout, enabling retailers to monetize speed while trimming fulfillment costs.
- July 2025: GLS US began Dallas operations, promising faster Western regional coverage and expanding its pickup and delivery zones.
- April 2025: UPS rolled out Ground Saver®, an economy service that uses the UPS Smart Logistics Network to target cost-sensitive parcels while preserving time-in-transit reliability.


United States Domestic Courier, Express And Parcel Market Report Scope
Express, Non-Express are covered as segments by Speed Of Delivery. Heavy Weight Shipments, Light Weight Shipments, Medium Weight Shipments are covered as segments by Shipment Weight. E-Commerce, Financial Services (BFSI), Healthcare, Manufacturing, Primary Industry, Wholesale and Retail Trade (Offline), Others are covered as segments by End User Industry. Business-to-Business (B2B), Business-to-Consumer (B2C), Consumer-to-Consumer (C2C) are covered as segments by Model.Speed of Delivery
| Express |
| Non-Express |
Shipment Weight
| Heavy Weight Shipments |
| Light Weight Shipments |
| Medium Weight Shipments |
End User Industry
| E-Commerce |
| Financial Services (BFSI) |
| Healthcare |
| Manufacturing |
| Primary Industry |
| Wholesale and Retail Trade (Offline) |
| Others |
Model
| Business-to-Business (B2B) |
| Business-to-Consumer (B2C) |
| Consumer-to-Consumer (C2C) |
| Speed of Delivery | Express |
| Non-Express | |
| Shipment Weight | Heavy Weight Shipments |
| Light Weight Shipments | |
| Medium Weight Shipments | |
| End User Industry | E-Commerce |
| Financial Services (BFSI) | |
| Healthcare | |
| Manufacturing | |
| Primary Industry | |
| Wholesale and Retail Trade (Offline) | |
| Others | |
| Model | Business-to-Business (B2B) |
| Business-to-Consumer (B2C) | |
| Consumer-to-Consumer (C2C) |


Market Definition
- Courier, Express, and Parcel - The Courier, Express, and Parcel services, often called as CEP Market, refers to the logistics and postal service providers which specialize in moving small goods (parcels/packages). It captures the overall market size (USD) and market volume (number of parcels) of (1) the shipments/parcels/packages which are under 70kgs/ 154lbs weight, (2) Business Customer packages viz. Business-to-Business (B2B) & Business-to-Consumer (B2C) as well as private customer packages (C2C), (3) non-express parcel delivery services (Standard and Deferred) as well as express parcel delivery services (Day-Definite-Express and Time-Definite-Express), (4) domestic as well as international shipments.
- Demographics - To analyse total addressable market demand, population growth & forecasts have been studied and presented in this industry trend. It represents population distribution across categories like gender (male/female), development area (urban/rural), major cities among other key parameters like population density and final consumption expenditure (growth and share % of GDP). This data has been used for assessing the fluctations in demand & consumption expenditure, and the major hotspots (cities) of potential demand.
- Domestic Courier Market - Domestic Courier Market refers to the CEP shipments wherein the origin and destination is within the boundary of the geography studied (country or region as per the scope of report). It captures the market size (USD) and market volume (number of parcels) of (1) the shipments/parcels/packages which are under 70kgs/ 154lbs weight, including light weight shipments, medium weight shipments and heavy weight shipments (2) Business Customer packages viz. Business-to-Business (B2B) & Business-to-Consumer (B2C) as well as private customer packages (C2C), (3) non-express parcel delivery services (Standard and Deferred) as well as express parcel delivery services (Day-Definite-Express and Time-Definite-Express).
- E-Commerce - This end user industry segment captures the external (outsourced) logistics expenditure incurred by the e-tailers, through online sales channel, on Courier, Express, and Parcel (CEP) services. The scope includes (i) the supply chain of a company's online customer orders being fulfilled, (ii) the process of getting a product from the point of manufacturing to the point at which it is delivered to consumers. It involves managing inventory (deferred as well as time critical), shipping, and distribution.
- Export Trends and Import Trends - Overall logistics performance of an economy is positively and significantly (statistically) correlated to its trade performance (exports and imports). Hence, in this industry trend, total value of trade, major commodities/ commodity groups and the major trade partners, for the studied geography (country or region as per the scope of report) have been analysed alongside the impact of major trade/logistics infrastructure investments & regulatory environment.
- Financial Services (BFSI) - This end user industry segment captures the external (outsourced) logistics expenditure incurred by the BFSI players, on Courier, Express, and Parcel (CEP) services. CEP is important to the financial services industry in shipping of confidential documents and files. The establishments in this sector are engaged in (i) financial transactions (that is, transactions involving the creation, liquidation, or change in ownership of financial assets) or in facilitating financial transactions, (ii) financial intermediation, (iii) the pooling of risk by underwriting annuities and insurance, (iv) providing specialized services that facilitate or support financial intermediation, insurance and employee benefit programs, and (v) monetary control - the monetary authorities.
- Fuel Price - Fuel price spikes can cause delays and diruption for logistics service providers (LSPs), while drops in the same can result in higher short-term profitability and increased market rivalry to offer consumers with the best deals. Hence, the fuel price variations have been studied over the review period and presented along with the causes as well as market impacts.
- GDP Distribution by Economic Activity - Nominal Gross Domestic Product and distribution of the same, across major economic sectors in the geography studied (country or region as per scope of the report) have been studied and presented in this industry trend. As GDP is positively related to the profitability and growth of logistics industry, this data has been used in adjunction to the input-output tables/ supply-use tables for analyzing the potential major contributing sectors towards the logistics demand.
- GDP Growth by Economic Activity - Growth of Nominal Gross Domestic Product across major economic sectors, for the geography studied (country or region as per scope of the report) have been presented in this industry trend. This data has been utilized for assessing the growth of logistics demand from all the market end users (economic sectors considered here).
- Healthcare - This end user industry segment captures the external (outsourced) logistics expenditure incurred by the Healthcare players (Hospitals, clinics, mrdical centres) , on Courier, Express, and Parcel (CEP) services. The scope includes CEP services involved in the defrerred as well time critical movement of medical goods & supplies (surgical supplies and instruments, including gloves, masks, syringes, equipment). The establishments in this sector (i) include the ones providing medical care exclusively (ii) deliver services by trained professionals (iii) involve processes, including labor inputs of health practitioners with the requisite expertise (iv) are defined based on the educational degree held by the practitioners included in the industry.
- Inflation - Variations in both Wholesale Price Inflation (YoY change in producer price index) and Consumer Price Inflation have been presented in this industry trend. This data has been used to assess the inflationary environment as it plays a vital role in smooth functioning of the supply chain, directly impacting the logistics operational cost components e.g., pricing of tyres, driver wages & benefits, energy/fuel prices, maintenace costs, toll charges, warehousing rents, custom brokerage, forwarding rates, courier rates etc. hence impacting the overall freight and logistics market.
- Infrastructure - As infrastructure plays a vital role in an economy's logistics performance, variables like length of roads, distribution of road length by surface category (paved v/s unpaved), distribution of road length by road classification (expressways v/s highways v/s other roads), rail length, volume of containers handled by major ports and tonnage handled by major airports have been analysed and presented in this industry trend.
- International Express Service Market - International Express Service Market refers to the CEP shipments wherein the origin or destination is not within the boundary of the geography studied (country or region as per the scope of report). It captures the market size (USD) and market volume (number of parcels) of (1) the shipments/parcels/packages which are under 70kgs/ 154lbs weight, including light weight shipments, medium weight shipments and heavy weight shipments (ii) Inter-Region as well as Intra-Region Shipments
- Key Industry Trends - The report section named "Key Industry Trends" include all the key variables/parameters studied to better analyze the market size estimates and forecasts. All the trends have been presented in the form of data points (time series or latest available data points) along with analysis of the paramter in the form of concise market relevant commentary, for the geography studied (country or region as per the scope of report).
- Key Strategic Moves - The action taken by a company to differentiate from its competitor or used as a general strategy is referred to as a key strategic move (KSM). This includes (1) Agreements (2) Expansions (3) Financial Restructuring (4) Mergers and Acquisitions (5) Partnerships, and (6) Product Innovations. Key players (Logistics Service Providers, LSPs) in the market have been shortlisted, their KSM have been studied and presented in this section.
- Logistics Performance - Logistics Performance and Logistics Costs are the backbone of trade, and influences trade costs, making countries compete globally. Logistics performance is influenced by market wide adopted supply chain management strategies, government services, investments & policies, fuel/ energy costs, inflationary environment etc. Hence, in this industry trend, the logistics performance of the geography studied (country/ region as per the scope of report) has been analysed and presented over the review period.
- Manufacturing - This end user industry segment captures the external (outsourced) logistics expenditure incurred by the Manufacturing industry (including Hi-Tech/Technology) players, on Courier, Express, and Parcel (CEP) services. The end user players considered are the establishments primarily engaged in the chemical, mechanical or physical transformation of materials or substances into new products. Logistics Service Providers (LSPs) play a crucial role in maintaining a smooth flow of raw materials across the supply chain, enabling timely delivery of finished goods to distributors or end customers and storing & supplying the raw materials to clients for just-in-time manufacturing.
- Other End Users - Other end user segment captures the external (outsourced) logistics expenditure incurred by the construction, real estate, educational services, and professional services (administrative, waste management, legal, architectural, engineering, design, consulting, scientific R&D), on Courier, Express, and Parcel (CEP) services. Logistics Service Providers (LSPs) plays a crucial role in the reliable movement of time critical supplies and documents to/from these industries such as transporting any equipment or resources required, shipping confidential documents and files.
- Primary Industry - This end user industry segment captures the external (outsourced) logistics expenditure incurred by the AFF (Agriculture, Fishing, and Forestry) and Extraction indsutry (Oil &Gas, Quarrying and Mining) players, on Courier, Express, and Parcel (CEP) services. The end user players considered are the establishments (i) primarily engaged in growing crops, raising animals, harvesting timber, harvesting fish & other animals from their natural habitats and providing related support activities; (ii) that extract naturally occurring mineral solids, such as coal and ores; liquid minerals, such as crude petroleum; and gases, such as natural gas. Herein, Logistics Service Providers (LSPs) (i) play a crucial role in acquisition, storage, handling, transportation, and distribution activities for the optimal & continuous flow of inputs (seeds, pesticides, fertilizers, equipment, and water) from manufacturers or suppliers to the producers and smooth flow of output (produce, agro-goods) to distributors/ consumers; (ii) cover entire phases from upstream to downstream and play a crucial role in the transportation of machinery, drilling equipments, extracted minerals, crude oil & natural gas and refined/ processed products from one place to another. This includes both termperature controlled and non-temperature controlled logistics, as and when required according to the shelf life of goods being transported or stored.
- Producer Price Inflation - It indicates inflation from viewpoint of the producers viz. the average selling price received for their output over a period of time. Annual change (YoY) of producer price index is reported as wholesale price inflation in the "Inflation" industry trend. As WPI captures dynamic price movements in most comprehensive way, it is widely used by governments, banks, industry, business circles and is deemed important in formulation of trade, fiscal and other economic policies. The data has been used in adjunction to consumer price inflation for better understanding the inflationary environment.
- Segmental Revenue - Segmental Revenue has been triangulated or computed and presented for all the major players in the market. It refers to the courier, express, and parcel (CEP) market specific revenue earned by the company, over the base year of study, in the geography studied (country or region as per the scope of report). It is computed through the study and analysis of major parameters like financials, service portfolio, employee strength, fleet size, investments, number of countries present in, major economies of concern, etc. that have been reported by the company in its annual reports, webpage. For companies having scarce financial disclosures, paid databases like D&B Hoovers, Dow Jones Factiva have been resorted to and verified through industry/expert interactions.
- Transport and Storage Sector GDP - Value and growth of Transport and Storage Sector GDP has a direct relation to the freight and logistics market size. Hence, this variable has been studied and presented over the review period, in value terms (USD) and as share % of total GDP, in this industry trend. The data has been supported by concise and relevant commentary around the investments, developments, and current market scenario.
- Trends in E-Commerce Industry - Enhanced internet connectivity and boom in smartphone penetration, coupled with increasing disposable incomes, has led to a phenomenal growth in the e-commerce market globally. Online shoppers require fast and efficient delivery of their orders leading to an increase in the demand for logistics services especially e-commerce fulfilment services. Hence, the Gross Merchandise Value (GMV), historial and projected growth, breakup of major commodity groups in e-commerce industry for the studied geography (country or region as per scope of the report) have been analysed and presented in this industry trend.
- Trends in Manufacturing Industry - Manufacturing industry involves the transformation of raw materials into finished products, while logistics industry ensures the efficient flow of raw materials to the factory, and the transport of manufactured products to the distributors & consumers. Demand-Supply of both industries are highly cross-linked and critical for a seamless supply chain. Hence, the Gross Value Added (GVA), breakup of GVA into major manufacturing sectors, and growth of manufacturing industry over the review period have been analysed and presented, in this industry trend.
- Wholesale and Retail Trade (Offline) - This end user industry segment captures the external (outsourced) logistics expenditure incurred by the wholesalers and retailers, through offline sales channel, on Courier, Express, and Parcel (CEP) services. The end user players considered are the establishments primarily engaged in wholesaling or retailing merchandise, generally without transformation, and rendering services incidental to the sale of merchandise. Logistics Service Providers (LSPs) plays a crucial role in the reliable movement of supplies to and finished products from production houses to the distributors and finally to the end customer covering activites like material sourcing, transportation, order fulfillment, warehousing & storage, demand forecasting, inventory management etc.
| Keyword | Definition |
|---|---|
| Axle Load | The axle load refers to the total load (weight) bearing on the roadway through wheels connected to a given axle. Across the globe, there are systems in place to ensure axle load monitoring, wherein surpassing the defined limits set by the concerned regulatory authority can lead to penalty/fine. For transportation of goods via road this can be an important determinant of costs as knowledge about the axle load limits can be used to (i) load the vehicle optimally for maximizing profits (ii) avoid exceeding the same and hence the probable fines associated (iii) avoid wear and tear of the vehicle (iv) avoid damage to pavement resulting in noticeable public maintenance and repair costs (v) achieve better turnaround time. |
| Back Haul | Backhaul is the return movement of a transport vehicle from its original destination to its original point of departure, and can include full, partial, or empty truck loads (all or part of the way) depending on the visibility of the local freight ecosystem. In this regard, transportation of empty containers to the point of origin, known as deadheading is also a significant factor, considering the supply/container shortages across the geographies, resulting in cost escalation and under optimized profit potential attainment. Generally, the carriers offer discounts on the backhaul, to secure freight for the trip. |
| Bill of Lading (BOL) | A bill of lading is a legal contract document issued by a carrier to a shipper to acknowledge reception of their cargo, and is evidence for the contract of carriage between the two parties. Broadly it details the (i) type, quantity, and other specifications of the goods being carried (ii) destination, and terms & conditions of the shipment (iii) carrier and drivers with all the necessary information to process the shipment, which can be used for insurance and customs clearance purposes (iv) assurance that the consignment is damage-free and ready to be shipped to the consignee. In this regard, a house bill of lading (HBL) is a document issued by a freight forwarder or a non-vessel operating common carrier (NVOCC) to acknowledge receipt of items for shipment (to a shipper). If shipments from several shippers are involved a master bill of lading (MBL) might be involved which is a consolidated version of the same for all the shipments being taken care of by the carrier (to a common destination) and might be issued by the carrier to the freight forwarder or the shipper (depending on who books the transport). |
| Bunkering | Bunkering is the process of supplying fuel to power the propulsion system of a ship. It includes the logistics of loading and distributing the fuel among available shipboard tanks. In this regard, (i) Bunker fuel is technically any type of fuel oil used aboard ships. It gets its name from the containers on ships and in ports that it is stored in; in the days of steam they were coal bunkers but now they are bunker-fuel tanks, (ii) Bunker refers to the spaces (Tank) on board a vessel to store fuel, (iii) Bunker trader refers to a person dealing in trade of bunker (fuel), (iv) Bunker call is made when a cargo ship anchors or berths in a port to take on bunker oil or supplies, (v) Bunkering service is the supply of a requested quality and quantity of bunkers to a ship. Bunkering is signficant from point of view of freight rates applicable to the shipper as Bunker Contribution (BUC)/ Fuel Adjustment Factor (FAF)/ Bunker Adjustment Factor (BAF) are applied by shipping lines to offset the effect of fluctuations in the cost of bunkers. |
| Cabotage | Transport by a vehicle registered in a country, performed on the national territory of another country. Cabotage law may restrict domestic cargo traffic to be carried in its own nationally registered, and sometimes built and crewed vehicles, though regulations vary across industries/commodity groups/countries and sometimes specify maximum allowable percentage of cabotage that can be serviced by foreign registered fleet. |
| C-commerce | Collaborative commerce (also known as C-commerce), (i) describes electronically enabled business interactions among an enterprise’s internal personnel, business partners and customers throughout a trading community (industry, industry segment, supply chain or supply chain segment); (ii) is the optimization of supply and distribution channels to capitalize on the global economy by using new technology efficiently. Advantages of C-commerce, to detail few include (i) maximization of organization's efficiency and profitability (ii) technology integration with physical channels to allow companies to work together (iii) increased information exchange such as inventory and product specifications, using the web as an intermediary (iv) increased competitiveness by reaching a broader audience. Examples of C-commerce, also known as peer-to-peer commerce, include (i) companies that allow consumers to rent things from each other, or marketplaces, such as Meta (formerly Facebook) Marketplace, that allow the sale of used goods; (ii) DoorDash teamed up with many national brands, such as McDonald’s and Chipotle, to offer fast food delivery, building their business model on c-commerce. They have since expanded their delivery service from restaurants to retailers and even offer 'fleets' of drivers to businesses. |
| Courier | A business/company that delivers packages/parcels/shipments (upto 70 kgs) including quick door to door pickup and delivery service for goods or documents, domestically or internationally, on a commercial contract basis. Example, DHL Group, FedEx, United Parcel Service of America, Inc., USPS, International Distributions Services, J&T Express, SF Express among several others |
| Cross docking | Cross docking is a practice in logistics management that includes unloading incoming delivery vehicles and loading the materials directly into outbound delivery vehicles, omitting traditional warehouse logistical practices and saving time and money. It requires close synchronization of both inbound and outbound movements. It is highly significant in reduction of costs pertaining to warehousing & storage (and the associated Value Added Services). |
| Cross Trade | International transport between two different countries performed by a vehicle registered in a third country. A third country is a country other than the country of loading/embarkation and the country of unloading/disembarkation. Cross Trade law may restrict international cargo traffic to be carried by respective country's registered vehicles, and sometimes built and crewed vehicles, though regulations vary across industries/commodity groups/countries and sometimes specify maximum allowable percentage of cross trade that can be serviced by foreign registered fleet. |
| Customs Clearance | The process of declaring and clearing cargoes through customs. It includes the procedures involved in getting cargo released by Customs through designated formalities such as presenting import license/permit, payment of import duties and other required documentations by the nature of the cargo. In this regard, a customs broker is a person or company licensed by the respective department of the country to act on behalf of freight importers and exporters. |
| Dangerous Goods | Dangerous goods (or hazardous materials or HAZMAT) include flammable liquids/solids, gases (compressed, liquified, dissolved under pressure), corrosives, oxidising substances, explosive substances and articles, substances which on contact with water emit flammable gasses, organic peroxides, toxic substances, infectious substances, radioactive materials, miscellaneous dangerous goods and articles. |
| First mile Delivery | First mile delivery refers to the (i) first stage of the freight/shipment/cargo/courier transportation (ii) the transportation of goods from a merchant’s premises or warehouse to the next fulfillment centre/warehouse/hub from where the goods are forwarded (iii) shipping goods from local distribution centers to stores (For retailers) (iv) transportation of finished goods from a plant or a factory to a distribution center (For manufacturers), (v) pick up of goods from the end-customer’s home or store followed by movement to a warehouse or storage location (movers and packers), (vi) process where goods are picked up from a retailer and then transferred to third-party logistics providers or courier service providers to be delivered to the end-consumer (e-commerce). Once the package reaches the next warehouse or the courier’s hub, it is then sorted and transported further until it reaches the customer’s doorstep. Example, if one chooses UPS as a courier, first-mile delivery will be the product being delivered from manufacturer's/retailer's warehouse to the UPS’s warehouse/ fulfilment centre. |
| Last Mile Delivery | Last mile delivery refers to the very last step of the delivery process when a parcel is moved from a transportation hub (warehouse or a distribution center or fulfillment centre) to its final destination, which usually is a personal residence/retail store/ business, or parcel locker. It accounts for around half of the total cost involved in entire process of first mile, middle mile, and last mile delivery, though it can vary shipment to shipment, based on commodity, business model and similar factors. |
| Milkrun | A Milk Run is a delivery method used to transport mixed loads from various suppliers to one customer, using lean management principles applied to logistics. Instead of each supplier sending a truck every week to meet the needs of one customer, one truck (or vehicle) visits the suppliers to pick up the loads for that customer. This method of transport got its name from the dairy industry practice, where one tanker used to collect milk from several dairy farms for delivery to a milk processing company. A milk run can be a more efficient way to handle logistics but require proper planning. If the route involves products from different companies, there is need for an agreement about cost-sharing and other aspects of the cooperative delivery arrangement. Once the group settles these issues, this delivery method can save time and money for everyone by pooling operation costs and resources. |
| Multi country consolidation | Multi-Country Consolidation (MCC) is a cost-effective solution that consolidates one's cargo from different countries of origin to build Full Container Loads (FCL). MCC is most suitable for companies that import light volumes of goods from multiple countries but want to take advantage of the more economic FCL freight rates. Apart from costing some of the other advantages include (i) flexibility to choose suppliers from a wider range of origin countries without worrying about the logistics to final destination from each origin, (ii) ability to pick the most suitable suppliers from many different countries for one's business operations. The increase in one's sourcing options by MCC provides the kind of flexibility needed in competitive global markets. |
| Q-commerce | Q-commerce, also referred to as quick commerce, is a type of e-commerce where emphasis is on quick deliveries, typically in less than an hour. The companies providing Q-Commerce services might have vertically intergrated model or might be using third party delivery platforms (outsourced logistics). It has advantages like (i) competitve USP, (ii) potential to earn greater profit margins, (iii) better customer experience, (iv) guaranteed availability of products, (v) traceability, and (vi) scaleability. |
| ReverseLogistics | Reverse logistics is a type of supply chain management that moves goods from customers back to the sellers or manufacturers and may involve ciruclar economy principles (3Rs) viz. recycling, reuse (repurposing, reselling), reducing or repairing. In this regard, reverse commerce (or Recommerce) is the selling of previously owned items through physical or online marketplaces/distribution channels to buyers who reuse, recycle or resell them. |


Research Methodology
Mordor Intelligence follows a four-step methodology in all our reports.
- Step-1: Identify Key Variables: In order to build a robust forecasting methodology, the variables and factors identified in Step-1 are tested against available historical market numbers. Through an iterative process, the variables required for market forecast are set and the model is built on the basis of these variables.
- Step-2: Build a Market Model: Market-size estimations for the forecast years are in nominal terms. Inflation is considered to be a part of the pricing, and the average selling price (ASP) is varying throughout the forecast period for each country
- Step-3: Validate and Finalize: In this important step, all market numbers, variables and analyst calls are validated through an extensive network of primary research experts from the market studied. The respondents are selected across levels and functions to generate a holistic picture of the market studied.
- Step-4: Research Outputs: Syndicated Reports, Custom Consulting Assignments, Databases & Subscription Platforms


