Market Overview
| Study Period | 2020 - 2031 |
|---|---|
| Forecast Data Period | 2026 - 2031 |
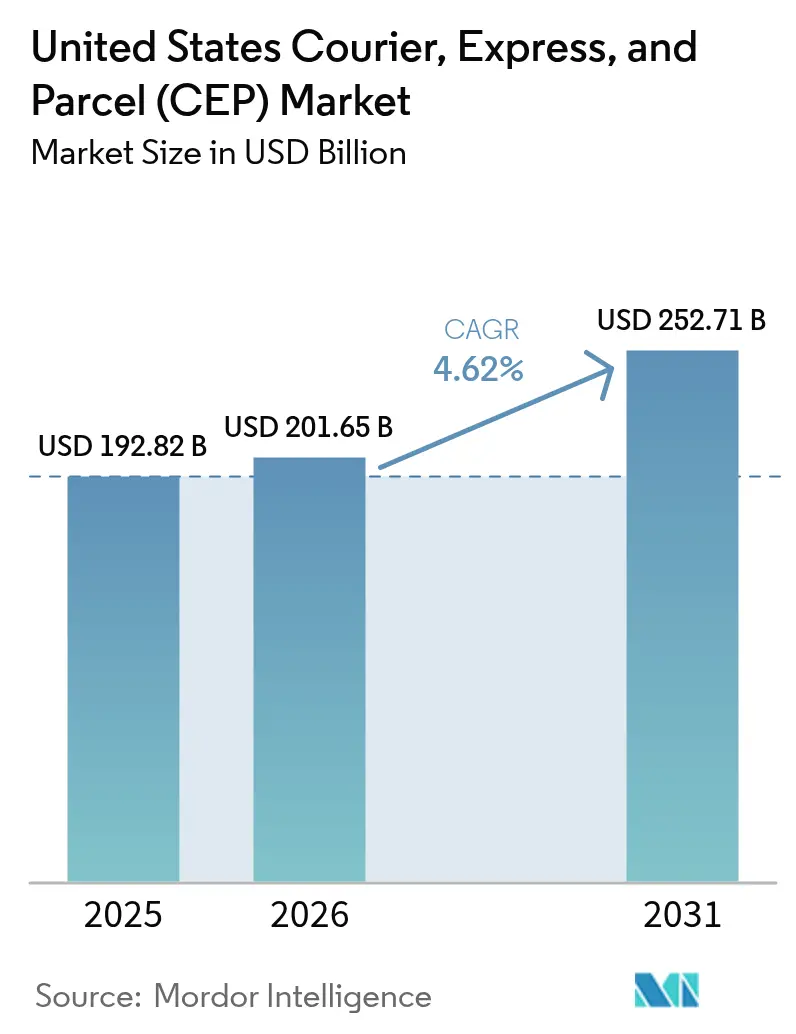
| Base Year Market Size (2025) | USD 192.82 Billion |
| Market Size (2026) | USD 201.65 Billion |
| Market Size (2031) | USD 252.71 Billion |
| Growth Rate (2026 - 2031) | 4.62% CAGR |
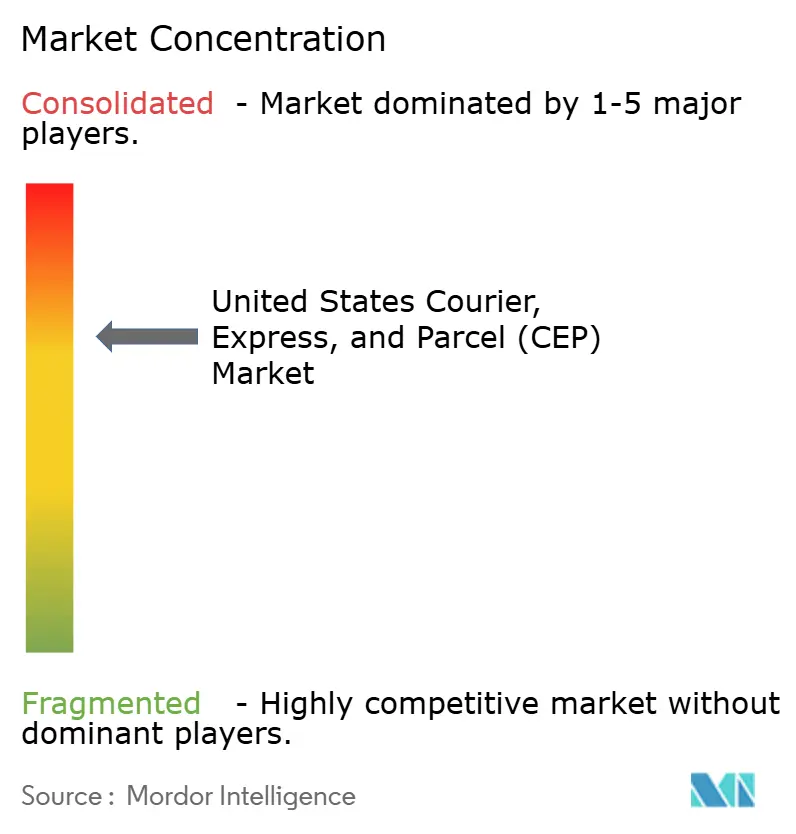
| Market Concentration | Medium |
Major Players *Disclaimer: Major Players sorted in no particular order Image © Mordor Intelligence. Reuse requires attribution under CC BY 4.0. | |
United States Courier, Express, And Parcel (CEP) Market Analysis by Mordor Intelligence
The United States courier, express, and parcel (CEP) market size is projected to be USD 192.82 billion in 2025 and USD 201.65 billion in 2026, and reach USD 252.71 billion by 2031, growing at a CAGR of 4.62% from 2026 to 2031.
Structural lift in parcels-per-capita, large-scale store-to-hub conversions by major retailers, and rising cross-border volumes are anchoring steady baseline growth. Momentum is strongest in lightweight B2C and C2C flows as recommerce, instant-delivery, and same-day services expand geographic reach. Technology investments from automated sort centers to AI-driven route planning continue to compress delivery windows and raise network utilization. Federal clean-transport incentives, combined with emerging city-level zero-emission rules, are accelerating fleet electrification and will gradually lower last-mile operating costs for early adopters.
Key Report Takeaways
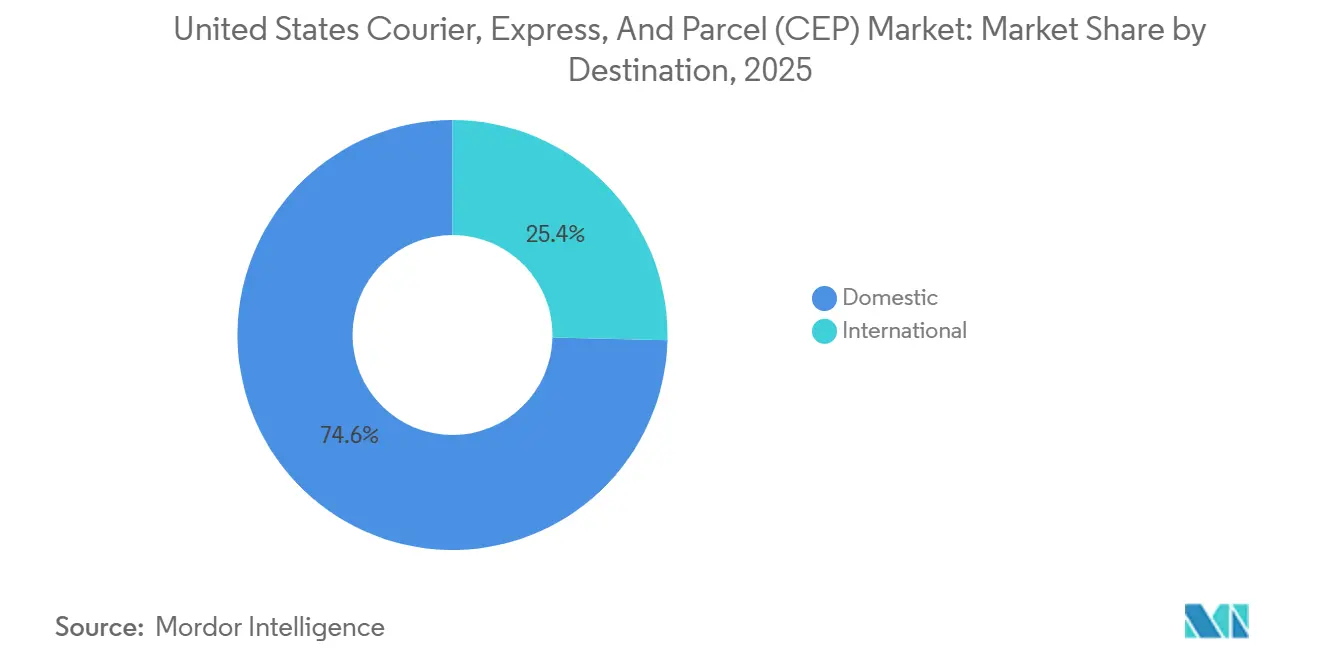
- By destination, international routes grew at a robust 6.28% CAGR from 2026 to 2031, outpacing the growth of domestic deliveries, which still accounted for a dominant 74.61% of market share in 2025.
- By mode of transport, road handled 50.97% of the United States courier, express, and parcel (CEP) market share in 2025, whereas air is projected to advance at a 5.25% CAGR through 2031.
- By speed of service, non-express captured 71.92% revenue in 2025, and express is forecast to expand at a 5.97% CAGR to 2031.
- By business model, business-to-consumer held 54.35% share in 2025, while consumer-to-consumer is the fastest-growing at 7.69% CAGR over 2026-2031.
- By shipment weight, light parcels commanded 69.51% of the United States courier, express, and parcel (CEP) market size in 2025; medium parcels led growth at a 5.33% CAGR to 2031.
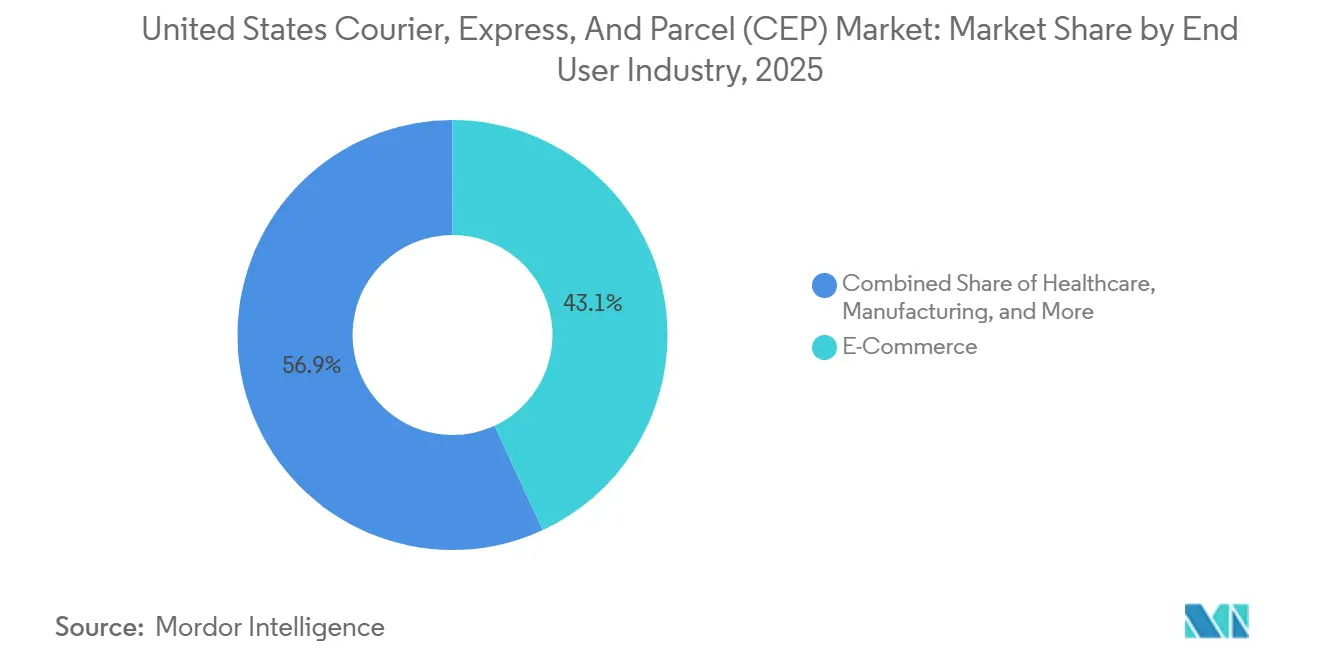
- By end-user industry, e-commerce generated 43.11% of 2025 revenue, but healthcare is poised for the highest 5.34% CAGR between 2026 and 2031.
Note: Market size and forecast figures in this report are generated using Mordor Intelligence’s proprietary estimation framework, updated with the latest available data and insights as of 2026.
United States Courier, Express, And Parcel (CEP) Market Trends and Insights
Drivers Impact Analysis*
| Driver | (~) % Impact on CAGR Forecast | Geographic Relevance | Impact Timeline |
|---|---|---|---|
| Structural lift in parcels-per-capita | +1.3% | National, suburban clusters | Long term (≥ 4 years) |
| Retail storefronts as micro-fulfillment hubs | +0.9% | Urban and suburban retail corridors | Medium term (2-4 years) |
| USPS Ground Advantage lightweight pricing | +0.6% | National, rural and SMB focus | Short term (≤ 2 years) |
| Expansion of recommerce platforms | +0.7% | Urban centers with younger demographics | Medium term (2-4 years) |
| Federal clean-transport incentives | +0.4% | California, Northeast urban centers | Long term (≥ 4 years) |
| Rise of instant-delivery platforms | +0.5% | Major metropolitan areas | Short term (≤ 2 years) |
| Source: Mordor Intelligence | |||


Structural Lift in Parcels-Per-Capita as Post-COVID Online Shopping Plateaus at a Higher Baseline
Online penetration stabilized near 16% of total retail sales in 2025, up from 11% pre-pandemic, translating into 185 parcels per resident versus 140 in 2019. Suburban delivery zones enjoy denser stop clustering as 12.7% of full-time employees work remotely, and digital-native consumers aged 18-34 generate 25% of all online purchases. These durable shifts underpin network-capacity investments such as automated sort centers and dedicated last-mile stations that lock in scale efficiencies without relying on GDP swings[1]“Quarterly Retail E-Commerce Sales Report Q3 2025,” U.S. Census Bureau, census.gov.
Retail Chains Converting Storefronts into Micro-Fulfillment Hubs, Fueling Short-Haul Shipment Growth
Target operates 1,500 same-day-capable stores, and Walmart equips 4,700 outlets for ship-from-store fulfillment, placing inventory within 10 miles of 90% of United States households. Short-haul parcels per location are 35% higher than 2020 while average line-haul distances drop 40%. The resulting pickup density lowers carrier costs and supports same-day ground delivery economics that once required expensive air service[2]“Suspension of De Minimis Duty-Free Entry,” U.S. Customs and Border Protection, cbp.gov.
USPS Ground Advantage Price Reset Drawing Volume from Private Carriers in the Lightweight Bracket
Ground Advantage rates average 15-25% below private-carrier equivalents for parcels under 10 lb, spurring 8% USPS parcel growth in 2025 and nudging SMB shippers toward hybrid carrier strategies. Private integrators counter with premium tracking, late pickups, and specialized handling that justify higher tariffs.
Expansion of Recommerce Platforms Multiplying C2C Parcel Traffic
Poshmark now hosts over 200 million listings, Depop surpasses 35 million users, and Facebook Marketplace drives billions of annual transactions. Sustainability and value-seeking mindsets among consumers aged 18-34 who source 40% of their apparel secondhand push C2C volumes well above historical baselines. Pre-paid label partnerships simplify seller workflows and stabilize seasonal spikes after major holidays.
Restraints Impact Analysis*
| Restraint | (~) % Impact on CAGR Forecast | Geographic Relevance | Impact Timeline |
|---|---|---|---|
| Upcoming union contract cycles and gig-driver unionization | -0.8% | National, unionized metros | Long term (≥ 4 years) |
| Aging bridges and chronic urban congestion | -0.6% | Northeast and West Coast corridors | Long term (≥ 4 years) |
| Urban curb fees and zero-emission downtown zones | -0.4% | Major metropolitan areas | Medium term (2-4 years) |
| Possible de minimis threshold reduction on low-value imports | -0.3% | Cross-border flows | Medium term (2-4 years) |
| Source: Mordor Intelligence | |||
Upcoming Union Contract Cycles and Gig-Driver Unionization Efforts Elevating Labor Cost Baselines
Teamsters represent 340,000 UPS employees whose 2028 contract will likely benchmark wages for the wider sector. California’s AB5 classification precedent threatens the cost structure of app-based couriers, potentially adding 20-30% to per-delivery labor outlays. With 80,000 driver vacancies in 2026 and average driver age at 46, wage inflation pressure is unavoidable despite increased sortation automation[3]“Bridge Condition by Highway System 2025,” Federal Highway Administration, fhwa.dot.gov.
Aging Interstate Bridges and Chronic Urban Congestion Extending Transit Times
Forty-two percent of United States bridges now exceed 50-year design lives, forcing weight-restricted detours that add 15-20 miles per affected shipment. Urban congestion already costs trucking USD 95 billion annually, and a 1:11 ratio of legal parking spots to trucks erodes driver productivity. Federal infrastructure funds will not materially ease constraints until the late 2020s, making dynamic routing and off-peak delivery scheduling imperative[4]“Record Value of U.S. Freight with Canada and Mexico 2025,” Bureau of Transportation Statistics, bts.gov.
*Our forecasts treat driver/restraint impacts as directional, not additive. The impact forecasts reflect baseline growth, mix effects, and variable interactions.
Segment Analysis
By End-User Industry: E-Commerce Leadership with Healthcare Acceleration
E-Commerce orders held 43.11% revenue share in 2025, underpinning most network-capacity investments and cementing parcel tracking transparency as a hygiene factor. Healthcare grew fastest at 5.34% CAGR, underpinned by tele-pharmacy, biologics requiring validated cold-chain, and time-critical medical devices.
UPS Health expanded 15 new temperature-controlled facilities in 2025, signaling intensifying competition for value-accretive, regulation-heavy consignments that command two to four times average per-package revenue.


By Destination: Domestic Scale with International Momentum
Domestic movement commanded 74.61% of the 2025 market share, reflecting the mature footprint of integrated carriers and consistent address standards that curb delivery exceptions. International parcels are racing ahead at 6.28% CAGR, aided by USMCA’s simplified customs processes and the USD 800 de minimis rule.
Proposed de minimis revisions would elevate paperwork costs for sellers of low-value items, possibly prompting inventory relocation to the United States soil or nearshore DCs in Mexico to sidestep duty exposure and preserve two-day delivery promises.
By Speed of Delivery: Express Premium Versus Non-Express Volume
Express services logged a 5.97% CAGR and captured price-insensitive shippers in healthcare, industrial components, and urgent consumer replacements. Non-Express retained 71.92% United States Courier, Express, and Parcel market share in 2025, buoyed by free-shipping promotions that fold delivery costs into product pricing.
Ground networks now deliver next-day service within 50 miles, blurring lines between Express and expedited ground. However, cross-country overnight guarantees still rely on air transport, maintaining a durable tariff premium for parcels traveling beyond 500 miles.
By Shipment Weight: Light-Weight Dominance with Medium-Weight Acceleration
Light packages contributed 69.51% of the 2025 market share, but medium-weight parcels are projected to advance 5.33% CAGR as households consolidate consumable purchases into fewer, heavier boxes. Dimensional-weight billing pushes shippers toward precise packaging, improving cubic-density on delivery vehicles and freeing capacity for value-rich, heavier units.
E-commerce marketplaces promote smart-cart incentives such as free shipping above dollar thresholds to encourage bundling, which feeds medium-weight growth while tempering light-weight share erosion gradually rather than abruptly.
By Mode of Transport: Road Flexibility with Air Speed
Road retained 50.97% market share in 2025 through unmatched geographic reach and ease of integrating pickup and delivery on the same route. Air freight, with 5.25% CAGR, supports overnight coast-to-coast guarantees and high-value electronics or healthcare shipments that justify premium charges.
Dedicated cargo hubs in Memphis, Louisville, and Anchorage continue to expand apron space and automated sort capacity, while FAA NextGen air-traffic upgrades shrink turn-around times and bolster schedule reliability.
By Business Model: C2C Surge Reshapes Transaction Flows
C2C parcels expanded at 7.69% CAGR from 2026-2031, eclipsing B2C’s steady but slower trajectory. In 2025, B2C still held 54.35% of the United States Courier, Express, and Parcel market size, but ongoing recommerce adoption and sustainability preferences signal accelerating peer-to-peer traffic.
Platform-driven prepaid labels and simplified pick-ups minimize friction for casual sellers, while micro-fulfillment by retailers narrows speed gaps that once favored pure B2C channels. B2B flows remain cyclical yet benefit from higher shipment frequency as businesses tilt toward just-in-time restocking.
Geography Analysis
Domestic nodes capture the bulk of 2025 parcel density thanks to standardized addresses, predictable road access, and carrier overlap that enables same-day ground options in 32 of the top 50 metro areas. Rural ZIP codes, newly added to Saturday service by UPS, improve weekend coverage and boost residential satisfaction indexes.
International volumes, though smaller, are the momentum engine for the United States Courier, Express, and Parcel market. Northbound parcels from Mexican factories leverage USMCA expedited processing and reach United States consumers in two to three days by road, often at half the landed cost of trans-Pacific air shipments.
Migration to Sunbelt states fosters new distribution-center clusters in Texas, Florida, and Arizona where land and labor remain relatively affordable. Carriers balance proximity to growth markets against risk of climate-related disruptions, installing redundant power systems and elevated dock platforms in hurricane-prone zones.
Competitive Landscape
Three national integrators UPS, FedEx, and USPS controlled roughly 60% of 2025 revenue, producing a moderately concentrated arena where network scale is critical yet not absolute. Each leverages proprietary air fleets, hub-and-spoke sortation, and multi-year enterprise contracts, but regional challengers such as OnTrac and LaserShip (now under Amazon) chip away in high-density corridors.
Technology deployment is the new battleground: FedEx is investing USD 3.2 billion to modernize 50 automated centers, targeting 25% efficiency gains. UPS is piloting smart-package digital twins that integrate sensor data for proactive exception management, while USPS rolled out real-time predictive ETAs to elevate Ground Advantage competitiveness.
Niche specialists exploit white-space segments cold-chain healthcare, instant-delivery, returns consolidation, and carbon-neutral shipments where tailored assets and certifications outrank pure scale. Electric-vehicle adoption, already 15% of FedEx’s urban fleet in 2025, is fast becoming a brand differentiator in zero-emission zones, pressuring laggards to accelerate capital spending or cede urban share.
United States Courier, Express, And Parcel (CEP) Industry Leaders
United States Postal Service (USPS)
FedEx
OnTrac
Amazon, Inc.
United Parcel Service of America, Inc.
- *Disclaimer: Major Players sorted in no particular order

Recent Industry Developments
- December 2025: Amazon completed acquisition of regional carrier LaserShip for USD 2.1 billion, expanding last-mile capacity in Eastern United States markets.
- November 2025: UPS launched USD 1.8 billion healthcare logistics expansion, adding 15 temperature-controlled facilities.
- October 2025: DHL Group formed a strategic partnership with Walmart for last-mile delivery in secondary markets.
- September 2025: FedEx completed deployment of electric delivery vehicles across 50 urban markets, representing 15% of total last-mile fleet.


United States Courier, Express, And Parcel (CEP) Market Report Scope
By Destination
| Domestic |
| International |
By Speed of Delivery
| Express |
| Non-Express |
By Business Model
| Business-to-Business (B2B) |
| Business-to-Consumer (B2C) |
| Consumer-to-Consumer (C2C) |
By Shipment Weight
| Heavy Weight Shipments |
| Light Weight Shipments |
| Medium Weight Shipments |
By Mode of Transport
| Air |
| Road |
| Others |
By End-User Industry
| E-Commerce |
| Financial Services (BFSI) |
| Healthcare |
| Manufacturing |
| Primary Industry |
| Wholesale and Retail Trade (Offline) |
| Others |
| By Destination | Domestic |
| International | |
| By Speed of Delivery | Express |
| Non-Express | |
| By Business Model | Business-to-Business (B2B) |
| Business-to-Consumer (B2C) | |
| Consumer-to-Consumer (C2C) | |
| By Shipment Weight | Heavy Weight Shipments |
| Light Weight Shipments | |
| Medium Weight Shipments | |
| By Mode of Transport | Air |
| Road | |
| Others | |
| By End-User Industry | E-Commerce |
| Financial Services (BFSI) | |
| Healthcare | |
| Manufacturing | |
| Primary Industry | |
| Wholesale and Retail Trade (Offline) | |
| Others |


Market Definition
- Courier, Express, and Parcel - The Courier, Express, and Parcel services, often called as CEP Market, refers to the logistics and postal service providers which specialize in moving small goods (parcels/packages). It captures the overall market size (USD) and market volume (number of parcels) of (1) the shipments/parcels/packages which are under 70kgs/ 154lbs weight, (2) Business Customer packages viz. Business-to-Business (B2B) & Business-to-Consumer (B2C) as well as private customer packages (C2C), (3) non-express parcel delivery services (Standard and Deferred) as well as express parcel delivery services (Day-Definite-Express and Time-Definite-Express), (4) domestic as well as international shipments.
- Demographics - To analyse total addressable market demand, population growth & forecasts have been studied and presented in this industry trend. It represents population distribution across categories like gender (male/female), development area (urban/rural), major cities among other key parameters like population density and final consumption expenditure (growth and share % of GDP). This data has been used for assessing the fluctations in demand & consumption expenditure, and the major hotspots (cities) of potential demand.
- Domestic Courier Market - Domestic Courier Market refers to the CEP shipments wherein the origin and destination is within the boundary of the geography studied (country or region as per the scope of report). It captures the market size (USD) and market volume (number of parcels) of (1) the shipments/parcels/packages which are under 70kgs/ 154lbs weight, including light weight shipments, medium weight shipments and heavy weight shipments (2) Business Customer packages viz. Business-to-Business (B2B) & Business-to-Consumer (B2C) as well as private customer packages (C2C), (3) non-express parcel delivery services (Standard and Deferred) as well as express parcel delivery services (Day-Definite-Express and Time-Definite-Express).
- E-Commerce - This end user industry segment captures the external (outsourced) logistics expenditure incurred by the e-tailers, through online sales channel, on Courier, Express, and Parcel (CEP) services. The scope includes (i) the supply chain of a company's online customer orders being fulfilled, (ii) the process of getting a product from the point of manufacturing to the point at which it is delivered to consumers. It involves managing inventory (deferred as well as time critical), shipping, and distribution.
- Export Trends and Import Trends - Overall logistics performance of an economy is positively and significantly (statistically) correlated to its trade performance (exports and imports). Hence, in this industry trend, total value of trade, major commodities/ commodity groups and the major trade partners, for the studied geography (country or region as per the scope of report) have been analysed alongside the impact of major trade/logistics infrastructure investments & regulatory environment.
- Financial Services (BFSI) - This end user industry segment captures the external (outsourced) logistics expenditure incurred by the BFSI players, on Courier, Express, and Parcel (CEP) services. CEP is important to the financial services industry in shipping of confidential documents and files. The establishments in this sector are engaged in (i) financial transactions (that is, transactions involving the creation, liquidation, or change in ownership of financial assets) or in facilitating financial transactions, (ii) financial intermediation, (iii) the pooling of risk by underwriting annuities and insurance, (iv) providing specialized services that facilitate or support financial intermediation, insurance and employee benefit programs, and (v) monetary control - the monetary authorities.
- Fuel Price - Fuel price spikes can cause delays and diruption for logistics service providers (LSPs), while drops in the same can result in higher short-term profitability and increased market rivalry to offer consumers with the best deals. Hence, the fuel price variations have been studied over the review period and presented along with the causes as well as market impacts.
- GDP Distribution by Economic Activity - Nominal Gross Domestic Product and distribution of the same, across major economic sectors in the geography studied (country or region as per scope of the report) have been studied and presented in this industry trend. As GDP is positively related to the profitability and growth of logistics industry, this data has been used in adjunction to the input-output tables/ supply-use tables for analyzing the potential major contributing sectors towards the logistics demand.
- GDP Growth by Economic Activity - Growth of Nominal Gross Domestic Product across major economic sectors, for the geography studied (country or region as per scope of the report) have been presented in this industry trend. This data has been utilized for assessing the growth of logistics demand from all the market end users (economic sectors considered here).
- Healthcare - This end user industry segment captures the external (outsourced) logistics expenditure incurred by the Healthcare players (Hospitals, clinics, mrdical centres) , on Courier, Express, and Parcel (CEP) services. The scope includes CEP services involved in the defrerred as well time critical movement of medical goods & supplies (surgical supplies and instruments, including gloves, masks, syringes, equipment). The establishments in this sector (i) include the ones providing medical care exclusively (ii) deliver services by trained professionals (iii) involve processes, including labor inputs of health practitioners with the requisite expertise (iv) are defined based on the educational degree held by the practitioners included in the industry.
- Inflation - Variations in both Wholesale Price Inflation (YoY change in producer price index) and Consumer Price Inflation have been presented in this industry trend. This data has been used to assess the inflationary environment as it plays a vital role in smooth functioning of the supply chain, directly impacting the logistics operational cost components e.g., pricing of tyres, driver wages & benefits, energy/fuel prices, maintenace costs, toll charges, warehousing rents, custom brokerage, forwarding rates, courier rates etc. hence impacting the overall freight and logistics market.
- Infrastructure - As infrastructure plays a vital role in an economy's logistics performance, variables like length of roads, distribution of road length by surface category (paved v/s unpaved), distribution of road length by road classification (expressways v/s highways v/s other roads), rail length, volume of containers handled by major ports and tonnage handled by major airports have been analysed and presented in this industry trend.
- International Express Service Market - International Express Service Market refers to the CEP shipments wherein the origin or destination is not within the boundary of the geography studied (country or region as per the scope of report). It captures the market size (USD) and market volume (number of parcels) of (1) the shipments/parcels/packages which are under 70kgs/ 154lbs weight, including light weight shipments, medium weight shipments and heavy weight shipments (ii) Inter-Region as well as Intra-Region Shipments
- Key Industry Trends - The report section named "Key Industry Trends" include all the key variables/parameters studied to better analyze the market size estimates and forecasts. All the trends have been presented in the form of data points (time series or latest available data points) along with analysis of the paramter in the form of concise market relevant commentary, for the geography studied (country or region as per the scope of report).
- Key Strategic Moves - The action taken by a company to differentiate from its competitor or used as a general strategy is referred to as a key strategic move (KSM). This includes (1) Agreements (2) Expansions (3) Financial Restructuring (4) Mergers and Acquisitions (5) Partnerships, and (6) Product Innovations. Key players (Logistics Service Providers, LSPs) in the market have been shortlisted, their KSM have been studied and presented in this section.
- Logistics Performance - Logistics Performance and Logistics Costs are the backbone of trade, and influences trade costs, making countries compete globally. Logistics performance is influenced by market wide adopted supply chain management strategies, government services, investments & policies, fuel/ energy costs, inflationary environment etc. Hence, in this industry trend, the logistics performance of the geography studied (country/ region as per the scope of report) has been analysed and presented over the review period.
- Manufacturing - This end user industry segment captures the external (outsourced) logistics expenditure incurred by the Manufacturing industry (including Hi-Tech/Technology) players, on Courier, Express, and Parcel (CEP) services. The end user players considered are the establishments primarily engaged in the chemical, mechanical or physical transformation of materials or substances into new products. Logistics Service Providers (LSPs) play a crucial role in maintaining a smooth flow of raw materials across the supply chain, enabling timely delivery of finished goods to distributors or end customers and storing & supplying the raw materials to clients for just-in-time manufacturing.
- Other End Users - Other end user segment captures the external (outsourced) logistics expenditure incurred by the construction, real estate, educational services, and professional services (administrative, waste management, legal, architectural, engineering, design, consulting, scientific R&D), on Courier, Express, and Parcel (CEP) services. Logistics Service Providers (LSPs) plays a crucial role in the reliable movement of time critical supplies and documents to/from these industries such as transporting any equipment or resources required, shipping confidential documents and files.
- Primary Industry - This end user industry segment captures the external (outsourced) logistics expenditure incurred by the AFF (Agriculture, Fishing, and Forestry) and Extraction indsutry (Oil &Gas, Quarrying and Mining) players, on Courier, Express, and Parcel (CEP) services. The end user players considered are the establishments (i) primarily engaged in growing crops, raising animals, harvesting timber, harvesting fish & other animals from their natural habitats and providing related support activities; (ii) that extract naturally occurring mineral solids, such as coal and ores; liquid minerals, such as crude petroleum; and gases, such as natural gas. Herein, Logistics Service Providers (LSPs) (i) play a crucial role in acquisition, storage, handling, transportation, and distribution activities for the optimal & continuous flow of inputs (seeds, pesticides, fertilizers, equipment, and water) from manufacturers or suppliers to the producers and smooth flow of output (produce, agro-goods) to distributors/ consumers; (ii) cover entire phases from upstream to downstream and play a crucial role in the transportation of machinery, drilling equipments, extracted minerals, crude oil & natural gas and refined/ processed products from one place to another. This includes both termperature controlled and non-temperature controlled logistics, as and when required according to the shelf life of goods being transported or stored.
- Producer Price Inflation - It indicates inflation from viewpoint of the producers viz. the average selling price received for their output over a period of time. Annual change (YoY) of producer price index is reported as wholesale price inflation in the "Inflation" industry trend. As WPI captures dynamic price movements in most comprehensive way, it is widely used by governments, banks, industry, business circles and is deemed important in formulation of trade, fiscal and other economic policies. The data has been used in adjunction to consumer price inflation for better understanding the inflationary environment.
- Segmental Revenue - Segmental Revenue has been triangulated or computed and presented for all the major players in the market. It refers to the courier, express, and parcel (CEP) market specific revenue earned by the company, over the base year of study, in the geography studied (country or region as per the scope of report). It is computed through the study and analysis of major parameters like financials, service portfolio, employee strength, fleet size, investments, number of countries present in, major economies of concern, etc. that have been reported by the company in its annual reports, webpage. For companies having scarce financial disclosures, paid databases like D&B Hoovers, Dow Jones Factiva have been resorted to and verified through industry/expert interactions.
- Transport and Storage Sector GDP - Value and growth of Transport and Storage Sector GDP has a direct relation to the freight and logistics market size. Hence, this variable has been studied and presented over the review period, in value terms (USD) and as share % of total GDP, in this industry trend. The data has been supported by concise and relevant commentary around the investments, developments, and current market scenario.
- Trends in E-Commerce Industry - Enhanced internet connectivity and boom in smartphone penetration, coupled with increasing disposable incomes, has led to a phenomenal growth in the e-commerce market globally. Online shoppers require fast and efficient delivery of their orders leading to an increase in the demand for logistics services especially e-commerce fulfilment services. Hence, the Gross Merchandise Value (GMV), historial and projected growth, breakup of major commodity groups in e-commerce industry for the studied geography (country or region as per scope of the report) have been analysed and presented in this industry trend.
- Trends in Manufacturing Industry - Manufacturing industry involves the transformation of raw materials into finished products, while logistics industry ensures the efficient flow of raw materials to the factory, and the transport of manufactured products to the distributors & consumers. Demand-Supply of both industries are highly cross-linked and critical for a seamless supply chain. Hence, the Gross Value Added (GVA), breakup of GVA into major manufacturing sectors, and growth of manufacturing industry over the review period have been analysed and presented, in this industry trend.
- Wholesale and Retail Trade (Offline) - This end user industry segment captures the external (outsourced) logistics expenditure incurred by the wholesalers and retailers, through offline sales channel, on Courier, Express, and Parcel (CEP) services. The end user players considered are the establishments primarily engaged in wholesaling or retailing merchandise, generally without transformation, and rendering services incidental to the sale of merchandise. Logistics Service Providers (LSPs) plays a crucial role in the reliable movement of supplies to and finished products from production houses to the distributors and finally to the end customer covering activites like material sourcing, transportation, order fulfillment, warehousing & storage, demand forecasting, inventory management etc.
| Keyword | Definition |
|---|---|
| Axle Load | The axle load refers to the total load (weight) bearing on the roadway through wheels connected to a given axle. Across the globe, there are systems in place to ensure axle load monitoring, wherein surpassing the defined limits set by the concerned regulatory authority can lead to penalty/fine. For transportation of goods via road this can be an important determinant of costs as knowledge about the axle load limits can be used to (i) load the vehicle optimally for maximizing profits (ii) avoid exceeding the same and hence the probable fines associated (iii) avoid wear and tear of the vehicle (iv) avoid damage to pavement resulting in noticeable public maintenance and repair costs (v) achieve better turnaround time. |
| Back Haul | Backhaul is the return movement of a transport vehicle from its original destination to its original point of departure, and can include full, partial, or empty truck loads (all or part of the way) depending on the visibility of the local freight ecosystem. In this regard, transportation of empty containers to the point of origin, known as deadheading is also a significant factor, considering the supply/container shortages across the geographies, resulting in cost escalation and under optimized profit potential attainment. Generally, the carriers offer discounts on the backhaul, to secure freight for the trip. |
| Bill of Lading (BOL) | A bill of lading is a legal contract document issued by a carrier to a shipper to acknowledge reception of their cargo, and is evidence for the contract of carriage between the two parties. Broadly it details the (i) type, quantity, and other specifications of the goods being carried (ii) destination, and terms & conditions of the shipment (iii) carrier and drivers with all the necessary information to process the shipment, which can be used for insurance and customs clearance purposes (iv) assurance that the consignment is damage-free and ready to be shipped to the consignee. In this regard, a house bill of lading (HBL) is a document issued by a freight forwarder or a non-vessel operating common carrier (NVOCC) to acknowledge receipt of items for shipment (to a shipper). If shipments from several shippers are involved a master bill of lading (MBL) might be involved which is a consolidated version of the same for all the shipments being taken care of by the carrier (to a common destination) and might be issued by the carrier to the freight forwarder or the shipper (depending on who books the transport). |
| Bunkering | Bunkering is the process of supplying fuel to power the propulsion system of a ship. It includes the logistics of loading and distributing the fuel among available shipboard tanks. In this regard, (i) Bunker fuel is technically any type of fuel oil used aboard ships. It gets its name from the containers on ships and in ports that it is stored in; in the days of steam they were coal bunkers but now they are bunker-fuel tanks, (ii) Bunker refers to the spaces (Tank) on board a vessel to store fuel, (iii) Bunker trader refers to a person dealing in trade of bunker (fuel), (iv) Bunker call is made when a cargo ship anchors or berths in a port to take on bunker oil or supplies, (v) Bunkering service is the supply of a requested quality and quantity of bunkers to a ship. Bunkering is signficant from point of view of freight rates applicable to the shipper as Bunker Contribution (BUC)/ Fuel Adjustment Factor (FAF)/ Bunker Adjustment Factor (BAF) are applied by shipping lines to offset the effect of fluctuations in the cost of bunkers. |
| Cabotage | Transport by a vehicle registered in a country, performed on the national territory of another country. Cabotage law may restrict domestic cargo traffic to be carried in its own nationally registered, and sometimes built and crewed vehicles, though regulations vary across industries/commodity groups/countries and sometimes specify maximum allowable percentage of cabotage that can be serviced by foreign registered fleet. |
| C-commerce | Collaborative commerce (also known as C-commerce), (i) describes electronically enabled business interactions among an enterprise’s internal personnel, business partners and customers throughout a trading community (industry, industry segment, supply chain or supply chain segment); (ii) is the optimization of supply and distribution channels to capitalize on the global economy by using new technology efficiently. Advantages of C-commerce, to detail few include (i) maximization of organization's efficiency and profitability (ii) technology integration with physical channels to allow companies to work together (iii) increased information exchange such as inventory and product specifications, using the web as an intermediary (iv) increased competitiveness by reaching a broader audience. Examples of C-commerce, also known as peer-to-peer commerce, include (i) companies that allow consumers to rent things from each other, or marketplaces, such as Meta (formerly Facebook) Marketplace, that allow the sale of used goods; (ii) DoorDash teamed up with many national brands, such as McDonald’s and Chipotle, to offer fast food delivery, building their business model on c-commerce. They have since expanded their delivery service from restaurants to retailers and even offer 'fleets' of drivers to businesses. |
| Courier | A business/company that delivers packages/parcels/shipments (upto 70 kgs) including quick door to door pickup and delivery service for goods or documents, domestically or internationally, on a commercial contract basis. Example, DHL Group, FedEx, United Parcel Service of America, Inc., USPS, International Distributions Services, J&T Express, SF Express among several others |
| Cross docking | Cross docking is a practice in logistics management that includes unloading incoming delivery vehicles and loading the materials directly into outbound delivery vehicles, omitting traditional warehouse logistical practices and saving time and money. It requires close synchronization of both inbound and outbound movements. It is highly significant in reduction of costs pertaining to warehousing & storage (and the associated Value Added Services). |
| Cross Trade | International transport between two different countries performed by a vehicle registered in a third country. A third country is a country other than the country of loading/embarkation and the country of unloading/disembarkation. Cross Trade law may restrict international cargo traffic to be carried by respective country's registered vehicles, and sometimes built and crewed vehicles, though regulations vary across industries/commodity groups/countries and sometimes specify maximum allowable percentage of cross trade that can be serviced by foreign registered fleet. |
| Customs Clearance | The process of declaring and clearing cargoes through customs. It includes the procedures involved in getting cargo released by Customs through designated formalities such as presenting import license/permit, payment of import duties and other required documentations by the nature of the cargo. In this regard, a customs broker is a person or company licensed by the respective department of the country to act on behalf of freight importers and exporters. |
| Dangerous Goods | Dangerous goods (or hazardous materials or HAZMAT) include flammable liquids/solids, gases (compressed, liquified, dissolved under pressure), corrosives, oxidising substances, explosive substances and articles, substances which on contact with water emit flammable gasses, organic peroxides, toxic substances, infectious substances, radioactive materials, miscellaneous dangerous goods and articles. |
| First mile Delivery | First mile delivery refers to the (i) first stage of the freight/shipment/cargo/courier transportation (ii) the transportation of goods from a merchant’s premises or warehouse to the next fulfillment centre/warehouse/hub from where the goods are forwarded (iii) shipping goods from local distribution centers to stores (For retailers) (iv) transportation of finished goods from a plant or a factory to a distribution center (For manufacturers), (v) pick up of goods from the end-customer’s home or store followed by movement to a warehouse or storage location (movers and packers), (vi) process where goods are picked up from a retailer and then transferred to third-party logistics providers or courier service providers to be delivered to the end-consumer (e-commerce). Once the package reaches the next warehouse or the courier’s hub, it is then sorted and transported further until it reaches the customer’s doorstep. Example, if one chooses UPS as a courier, first-mile delivery will be the product being delivered from manufacturer's/retailer's warehouse to the UPS’s warehouse/ fulfilment centre. |
| Last Mile Delivery | Last mile delivery refers to the very last step of the delivery process when a parcel is moved from a transportation hub (warehouse or a distribution center or fulfillment centre) to its final destination, which usually is a personal residence/retail store/ business, or parcel locker. It accounts for around half of the total cost involved in entire process of first mile, middle mile, and last mile delivery, though it can vary shipment to shipment, based on commodity, business model and similar factors. |
| Milkrun | A Milk Run is a delivery method used to transport mixed loads from various suppliers to one customer, using lean management principles applied to logistics. Instead of each supplier sending a truck every week to meet the needs of one customer, one truck (or vehicle) visits the suppliers to pick up the loads for that customer. This method of transport got its name from the dairy industry practice, where one tanker used to collect milk from several dairy farms for delivery to a milk processing company. A milk run can be a more efficient way to handle logistics but require proper planning. If the route involves products from different companies, there is need for an agreement about cost-sharing and other aspects of the cooperative delivery arrangement. Once the group settles these issues, this delivery method can save time and money for everyone by pooling operation costs and resources. |
| Multi country consolidation | Multi-Country Consolidation (MCC) is a cost-effective solution that consolidates one's cargo from different countries of origin to build Full Container Loads (FCL). MCC is most suitable for companies that import light volumes of goods from multiple countries but want to take advantage of the more economic FCL freight rates. Apart from costing some of the other advantages include (i) flexibility to choose suppliers from a wider range of origin countries without worrying about the logistics to final destination from each origin, (ii) ability to pick the most suitable suppliers from many different countries for one's business operations. The increase in one's sourcing options by MCC provides the kind of flexibility needed in competitive global markets. |
| Q-commerce | Q-commerce, also referred to as quick commerce, is a type of e-commerce where emphasis is on quick deliveries, typically in less than an hour. The companies providing Q-Commerce services might have vertically intergrated model or might be using third party delivery platforms (outsourced logistics). It has advantages like (i) competitve USP, (ii) potential to earn greater profit margins, (iii) better customer experience, (iv) guaranteed availability of products, (v) traceability, and (vi) scaleability. |
| ReverseLogistics | Reverse logistics is a type of supply chain management that moves goods from customers back to the sellers or manufacturers and may involve ciruclar economy principles (3Rs) viz. recycling, reuse (repurposing, reselling), reducing or repairing. In this regard, reverse commerce (or Recommerce) is the selling of previously owned items through physical or online marketplaces/distribution channels to buyers who reuse, recycle or resell them. |


Research Methodology
Mordor Intelligence follows a four-step methodology in all our reports.
- Step-1: Identify Key Variables: In order to build a robust forecasting methodology, the variables and factors identified in Step-1 are tested against available historical market numbers. Through an iterative process, the variables required for market forecast are set and the model is built on the basis of these variables.
- Step-2: Build a Market Model: Market-size estimations for the forecast years are in nominal terms. Inflation is considered to be a part of the pricing, and the average selling price (ASP) is varying throughout the forecast period for each country
- Step-3: Validate and Finalize: In this important step, all market numbers, variables and analyst calls are validated through an extensive network of primary research experts from the market studied. The respondents are selected across levels and functions to generate a holistic picture of the market studied.
- Step-4: Research Outputs: Syndicated Reports, Custom Consulting Assignments, Databases & Subscription Platforms


