Market Overview
| Study Period | 2020 - 2031 |
|---|---|
| Market Size (2026) | USD 724.98 Billion |
| Market Size (2031) | USD 928.43 Billion |
| Growth Rate (2026 - 2031) | 5.07% CAGR |
| Fastest Growing Market | Asia Pacific |
| Largest Market | North America |
| Market Concentration | Medium |
Major Players *Disclaimer: Major Players sorted in no particular order Image © Mordor Intelligence. Reuse requires attribution under CC BY 4.0. | |

Courier, Express, And Parcel (CEP) Market Analysis by Mordor Intelligence
The courier, express, and parcel (CEP) market size is estimated at USD 724.98 billion in 2026, and is expected to reach USD 928.43 billion by 2031, at a CAGR of 5.07% during the forecast period (2026-2031). Expansion is underpinned by a sharp pivot from document delivery toward small-package e-commerce, a channel that now generates 131 billion parcels each year and compels carriers to redesign networks around micro-fulfillment nodes rather than centralized depots. Intensifying same-day expectations, rising cross-border demand enabled by liberalized de minimis thresholds, and accelerated automation investment in sortation hubs sustain the growth trajectory despite margin pressure. Meanwhile, surcharges tied to volatile fuel prices and wage inflation in last-mile labor act as counterweights, spurring carriers to pilot electric vehicles, sustainable aviation fuel, and crowd-shipping models to protect profitability. Competitive intensity remains moderate, with technology-forward integrators widening the throughput gap over 12,000 regional specialists that still rely on manual sorting systems.
Key Report Takeaways
- By destination, domestic parcels held 68.98% of the courier express parcel market share in 2025, while international shipments are projected to grow at a 5.36% CAGR between 2026-2031.
- By speed of delivery, non-express services captured 62.82% of the 2025 value; express shipments are expected to rise at a 5.93% CAGR between 2026-2031.
- By model, business-to-consumer flows led with 47.96% of the courier express parcel market size in 2025, yet consumer-to-consumer values will expand at a 5.53% CAGR between 2026-2031.
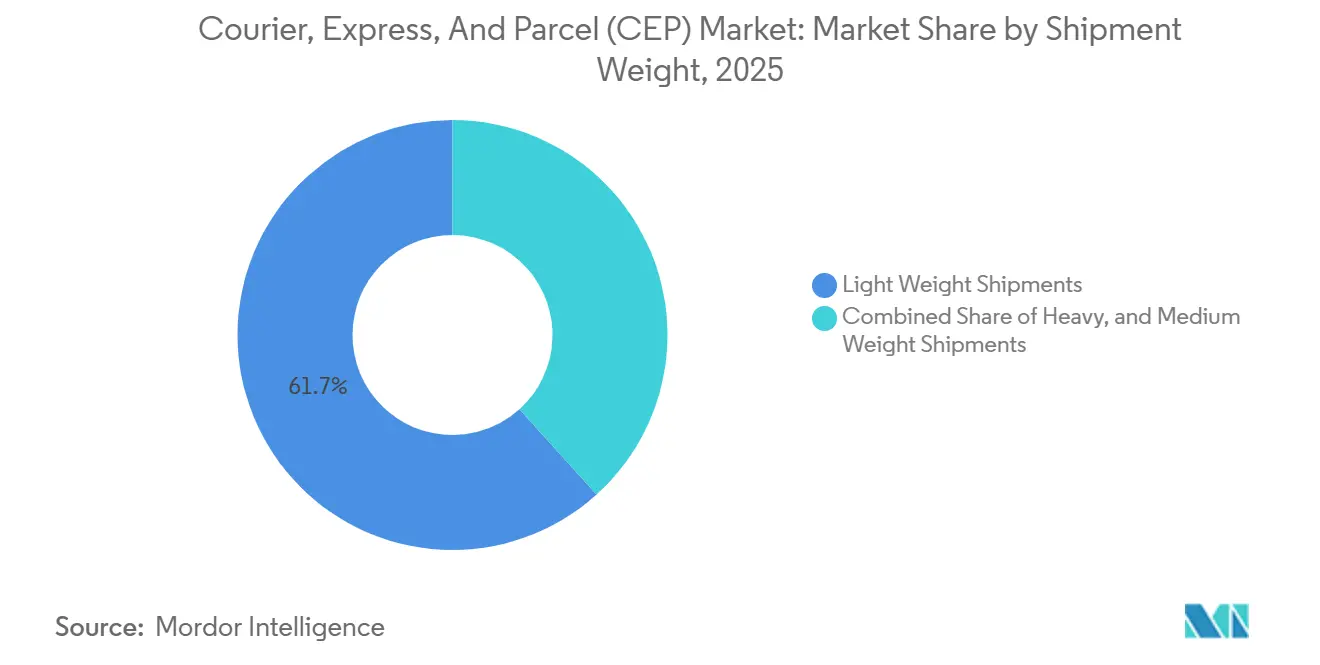
- By shipment weight, light parcels below 2 kg held 61.69% of the 2025 value; medium parcels between 2 kg and 20 kg are forecast to advance at a 6.69% CAGR between 2026-2031.
- By mode of transport, road accounted for 48.24% of 2025 shipments, whereas air freight is expected to post a 5.54% CAGR between 2026-2031.
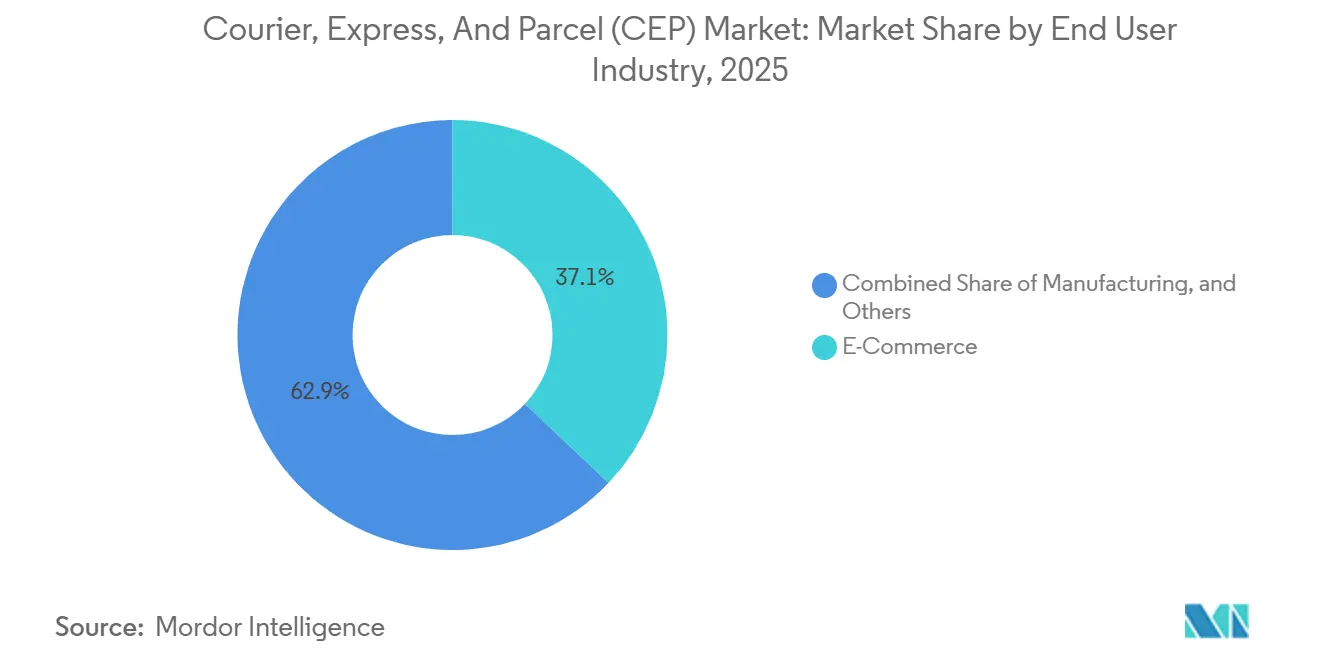
- By end-user, e-commerce generated 37.07% of 2025 parcels; healthcare logistics will outpace at a 5.68% CAGR between 2026-2031.
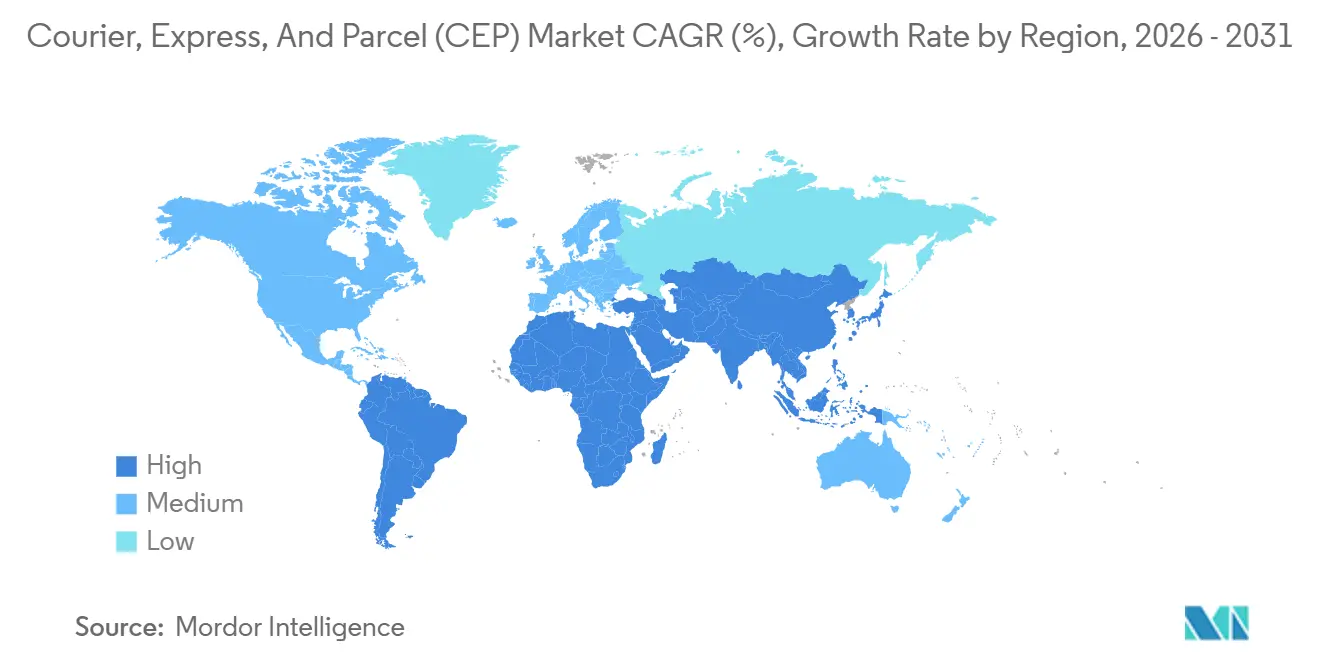
- By region, North America led with 36.37% of 2025 revenue; Asia–Pacific is set to be the fastest region with a 6.72% CAGR between 2026-2031.
Note: Market size and forecast figures in this report are generated using Mordor Intelligence’s proprietary estimation framework, updated with the latest available data and insights as of January 2026.
Global Courier, Express, And Parcel (CEP) Market Trends and Insights
Drivers Impact Analysis*
| Driver | (~) % Impact on CAGR Forecast | Geographic Relevance | Impact Timeline |
|---|---|---|---|
| Explosive B2C e-commerce parcel volumes | +1.2% | Global, strongest in APAC and North America | Medium term (2-4 years) |
| Same-day and on-demand delivery expectations | +0.8% | Urban cores in North America, Europe, APAC | Short term (≤ 2 years) |
| Liberalization of cross-border de minimis | +0.7% | North America, Europe, select APAC markets | Medium term (2-4 years) |
| Automation and IoT in sortation hubs | +0.6% | Global high-volume hubs | Long term (≥ 4 years) |
| Crowd-shipping gig networks | +0.4% | Major metros in North America, Europe, APAC | Short term (≤ 2 years) |
| Urban consolidation-center mandates | +0.3% | Select European, North American, APAC cities | Long term (≥ 4 years) |
| Source: Mordor Intelligence | |||
Explosive B2C E-Commerce Parcel Volumes
Online retail produced 131 billion parcels globally in 2025 and is tracking toward 178 billion by 2031 as rising smartphone penetration in India, Indonesia and Brazil closes the gap with China’s 52% e-commerce share of retail sales. Cross-border flows outpace domestic growth because marketplaces such as Temu and Shein bypass local distribution, shipping factory-direct orders to São Paulo or Lagos in under two weeks. To cope, integrators have replaced megahubs with clusters of urban micro-warehouses under 5,000 square feet, enabling two-hour delivery windows that elevate parcel density per square kilometer as the primary profit lever. Social commerce compounds the load, with TikTok Shop processing 3 million daily orders in Southeast Asia during 2025 and sending an equivalent number of lightweight parcels into networks unaccustomed to such skewed weight profiles[1]“VAT for Cross-Border E-Commerce,” European Commission, ec.europa.eu.
Same-Day and On-Demand Delivery Expectations
Consumers in 47 global cities now receive 38% of online orders within four hours of checkout, a service once limited to hot meals and urgent prescriptions. UPS noted same-day requests doubled between 2023 and 2025 even as willingness to pay premium fees fell 31%, forcing carriers to bundle expedited volume with deferred ground to preserve asset utilization. Subscription models like Amazon Prime train 210 million members to treat next-day as baseline, crowding margins as carriers scramble to optimize two-hour windows through real-time traffic data that just 18% of regional operators possess. Retailers subsidize last-mile speed to win customer lifetime value, shifting the cost burden back onto parcel networks already pressured by labor shortages[2]“Global Postal Statistics,” Universal Postal Union, upu.int.
Liberalization of Cross-Border De Minimis Thresholds
The United States keeps an USD 800 ceiling while requiring advance electronic data that adds 48 hours to clearance for non-compliant shipments, prompting marketplaces to automate paperwork inside checkout flows. Europe’s EUR 150 cap retains fast lanes but ended VAT exemptions in 2021, initially dampening flows before automated tax collection restored growth in 2024. India lifted its threshold to INR 5,000 (USD 60) in 2024, an act expected to attract 120 million extra parcels a year by 2027 as middle-income shoppers order fashion and electronics duty-free. Integrators with in-house customs brokerage gain share, whereas postal operators lose volume due to limited shipment visibility.
Automation and IoT Adoption in Sortation Hubs
FedEx operates 38 automated facilities that deploy autonomous mobile robots to cut manual touches by 60% and mis-sorts to 0.02%. UPS invested USD 1.2 billion in vision-based label readers boosting accuracy to 99.7% and removing human intervention on 8% of parcels. IoT sensors embedded in conveyors stream telemetry on weight and dimensions, improving trailer cube utilization and trimming empty miles by 12%. Predictive maintenance algorithms detect belt-wear vibration 72 hours ahead, shrinking unplanned downtime from 4.2% to 0.8% of operating hours across DHL’s European network. Capital intensity of USD 150–300 million per greenfield hub prevents most regional carriers from replicating these gains, reinforcing the advantage of the top 15 players.
Restraints Impact Analysis*
| Restraint | (~) % Impact on CAGR Forecast | Geographic Relevance | Impact Timeline |
|---|---|---|---|
| Fuel-price volatility and rising surcharges | -0.5% | Global, with acute impact on air express | Short term (≤ 2 years) |
| Acute labor shortages and wage inflation in last-mile | -0.6% | North America, Europe, select APAC markets | Medium term (2-4 years) |
| Regulatory delays on commercial UAV/drone delivery | -0.2% | North America, Europe, APAC urban markets | Long term (≥ 4 years) |
| Zoning limits on micro-fulfillment centres near city cores | -0.3% | Europe, North America metros, select APAC cities | Medium term (2-4 years) |
| Source: Mordor Intelligence | |||
Fuel-Price Volatility and Rising Surcharges
Brent averaged USD 84 per barrel in 2025, down from the USD 92 spike in 2024, yet jet-fuel surcharges lingered at 11.5% of base express rates after carriers hedged at higher prices. FedEx revealed surcharges lifted revenue by USD 2.8 billion but drove a 9% volume decline as shippers downgraded service levels. Diesel swings forced monthly surcharge resets, eroding shipper trust and pushing modal shifts toward deferred ground. Air networks remain exposed, with IATA noting fuel now represents 28% of operating costs, up from 22% in 2020[3]“Petroleum & Other Liquids,” U.S. Energy Information Administration, eia.gov .
Acute Labor Shortages and Wage Inflation
The United States registered 427,000 unfilled driver roles in December 2025, an 8.3% vacancy rate that has raised starting wages 18% since 2023. Germany’s logistics sector offered EUR 16.50 per hour in 2025 yet still carried 63,000 vacancies as younger workers chose remote office jobs. Gig platforms recruiting the same pool enable drivers to cherry-pick dense urban routes, leaving legacy carriers to cover low-density areas at a loss. UPS missed its 2025 holiday seasonal-hire target by 22%, resulting in 4.2 million delayed parcels[4]“Job Openings and Labor Turnover Survey,” U.S. Bureau of Labor Statistics, bls.gov.
*Our forecasts treat driver/restraint impacts as directional, not additive. The impact forecasts reflect baseline growth, mix effects, and variable interactions.
Segment Analysis
By End-User Industry: Healthcare Outpaces E-Commerce
E-commerce commanded 37.07% of 2025 parcels but now decelerates in mature regions where online penetration nears saturation. Healthcare logistics, by contrast, will grow at a 5.68% CAGR (2026-2031) as cell-and-gene therapies demand precise -80 °C control, pushing the Courier, Express and Parcel market share of temperature-sensitive freight higher each year. FedEx already runs 90 cold-chain facilities with real-time IoT monitoring, securing 40% pricing premiums and capturing biopharma accounts unwilling to risk product loss.
Manufacturing accounts for 18% of parcels, steady but slow, while BFSI slips as digital signatures displace physical documents. Wholesale and retail inventory replenishment grows 3.2% CAGR, increasingly blurred with direct-to-consumer channels as stores double as fulfillment nodes. Primary industries and government shipments remain low-volume, stable niches. Overall, healthcare emerges as the growth engine that offsets plateauing e-commerce in high-income markets.


By Destination: Cross-Border Flows Narrow the Gap
International shipments will expand at a 5.36% CAGR between 2026-2031, though domestic still anchors 68.98% of revenue in 2025. The Courier, Express and Parcel market size for international flows is projected to rise as de minimis liberalization trims clearance time from five days to 36 hours. Chinese marketplaces already drive 2.1 billion cross-border parcels a year, routing through bonded hubs in Leipzig and Liège to exploit intra-EU efficiencies. However, infrastructure gaps and seven-day customs queues persist at India’s ports, tempering the speed advantage of express air. Domestic density economics, where a courier completes 180 daily stops, continue to yield cost leadership for urban networks even as global shoppers expand their addressable inventory.
International lanes shoulder USD 12–18 per parcel in structural cost premiums for air, brokerage, and partner-postal handoffs, but scale economies and bonded warehouse investment by integrators are closing the gap. Regional trade agreements such as ASEAN’s e-commerce pact reduce documentary friction, enabling intra-Asia parcels to move with near-domestic velocity. Carriers now differentiate cross-border offers by end-to-end visibility and duty-paid checkout, features that win repeat small-business sellers on Etsy and Shopify. As customs systems digitalize, the Courier, Express and Parcel market unlocks an additional layer of lightweight parcels previously deterred by opaque landed-cost calculations.
By Speed of Delivery: Express Premiums Erode
Non-express still represents 62.82% of the value in 2025 because deferred ground achieves 3–5-day delivery at 40% lower cost, satisfying 78% of online orders. Yet express is growing faster at 5.93% CAGR (2026-2031), supported by temperature-controlled pharmaceuticals and semiconductor components that cannot tolerate delays. The Courier, Express and Parcel market share of express services nevertheless contracts as subscription models bundle next-day into flat fees, compressing per-package pricing. FedEx reported a 6% fall in express revenue per package in 2025, even while volume increased 4%.
Ground networks exploit midnight sortation and 4 a.m. driver launch to match overnight air under 500 miles, neutralizing express on many intra-regional lanes. Same-day sits below 3% of volume but is climbing 11% a year, driven by grocery and restaurant aggregators that now venture into general merchandise. Regulatory adjustments, such as the EU proposal to lengthen driver rest periods, could add transit time to long-haul ground, nudging shippers back toward air on specific corridors. Despite price erosion, express remains indispensable for life-critical shipments, anchoring premium margins in niche verticals where late arrival is not an option.
By Shipment Weight: Medium Parcels Surge
Light parcels under 2 kg represented 61.69% of the 2025 value, thanks to apparel and gadgets, yet medium parcels between 2 kg and 20 kg will accelerate at a 6.69% CAGR (2026-2031) as furniture, small appliances, and consolidated grocery baskets migrate online. The Courier, Express, and Parcel market size for medium parcels is quickly expanding alongside subscription replenishment models that encourage heavier multi-item orders. Carriers therefore retrofit fleets with larger box vans that hold 40 cubic feet versus 18 cubic feet in compact models, buffering delivery density from the impact of oversized items.
Automated hubs thrive on lightweight flow; medium and heavy items require manual touches that add 90 seconds per package and shrink throughput by 18% during peak. Shopify introduced shipping-fee thresholds that encourage baskets under 5 kg, influencing merchant assortment toward lighter SKUs. Europe’s forthcoming 23 kg manual-handling limit will mandate two-person teams for heavier goods, doubling last-mile labor expense and potentially shifting bulky items into specialized white-glove networks rather than mainstream parcel flows.
By Mode of Transport: Air Retains Time-Sensitive Edge
Road controls 48.24% of shipment revenue in 2025, leveraging USD 0.08 per package-mile on dense corridors. Air freight is forecast to log a 5.54% CAGR between 2026-2031 as cross-border e-commerce and cold-chain biologics require intercontinental transit within 48 hours. The Courier, Express, and Parcel market size for air parcels will benefit from the return of widebody passenger capacity that reopened lower-cost belly-hold lanes after pandemic-era shortages. Yet sustainability costs loom: ICAO’s carbon-offset mandate from 2027 will add USD 0.12 per kg, nudging price-sensitive flows back to ground wherever timelines permit.
Electric vans offer 40% lower per-mile energy cost once deployed at scale, with UPS operating 13,000 battery-electric units as of 2025. Rail and intermodal remain niche at 4% of volume, serving bulk contract shippers happy with 7-day transit to save 30%. For lanes under 500 miles, FedEx already routes 73% of domestic express via ground, equaling air transit time at 60% lower cost.
By Model: C2C Resale Platforms Accelerate
Business-to-consumer flows led revenue at 47.96% in 2025, but consumer-to-consumer parcels will grow at a 5.53% CAGR (2026-2031) as resale culture unlocks closets across North America and Europe. The Courier, Express, and Parcel market size attached to C2C shipments is rising as Vinted, Poshmark, and Mercari orchestrate 18 million daily peer-to-peer parcels. Senders lack commercial accounts, so carriers invest in QR-code label kiosks and neighborhood drop points, adding USD 1.80 in handling cost relative to bulk B2C pickups. Social-commerce hybrids blur distinctions, with micro-entrepreneurs selling direct via Instagram and TikTok Checkout.
B2B parcels, which include office supplies and industrial spares, comprise 31% of volume but grow at a 4.2% CAGR because manufacturers shift line-haul inventory to less-than-truckload for heavier consignments. Predictive analytics lets retailers pre-position B2C inventory within 280 miles of demand clusters, down from 420 miles in 2020, trimming last-mile cost by 22%. As resale and social commerce scale, carriers that master consumer-friendly label generation and reverse logistics will capture incremental volumes previously invisible to traditional demand forecasting.
Geography Analysis
North America contributed 36.37% of 2025 revenue, largely from 160 million Amazon Prime subscribers who normalize same-day expectations across 90 metros. The region benefits from deep address databases and mature inter-state trucking, yet faces 18% wage inflation in last-mile labor between 2023 and 2025. Same-day now reaches 47 cities, but carriers battle margin erosion as customers recoil from surcharges. Canada’s 1.8 billion parcels and Mexico’s cross-border boom with the United States reinforce continental density.
Asia–Pacific will outpace all regions with a 6.72% CAGR (2026-2031), propelled by China’s 120 billion domestic parcels and India’s 9 billion shipments in 2025. Mobile-wallet penetration of 87% in China and 72% in India erodes cash-on-delivery friction, while Indonesia, Vietnam, and the Philippines collectively delivered 6 billion parcels in 2025, a 28% jump. Labor scarcity in Japan and Australia drives autonomous-delivery pilots, from Yamato’s wage-linked robot trials to Australia Post’s suburban rovers.
Europe generated 28% of revenue in 2025 but grows more slowly at a 4.1% CAGR as e-commerce penetration plateaus near 19% and the Packaging Waste Regulation mandates 90% recyclable materials by 2030. Compliance costs and rising labor rates trim margins, while Eastern Europe posts double-digit parcel growth on back of German and Dutch cross-border exports. Middle East and Africa deliver 7% of revenue, constrained by customs delays and address ambiguity, though Gulf states improve air-lane connectivity. South America adds 5% of revenue, with Brazil’s 3.2 billion parcels leading but dampened by currency volatility.

Competitive Landscape
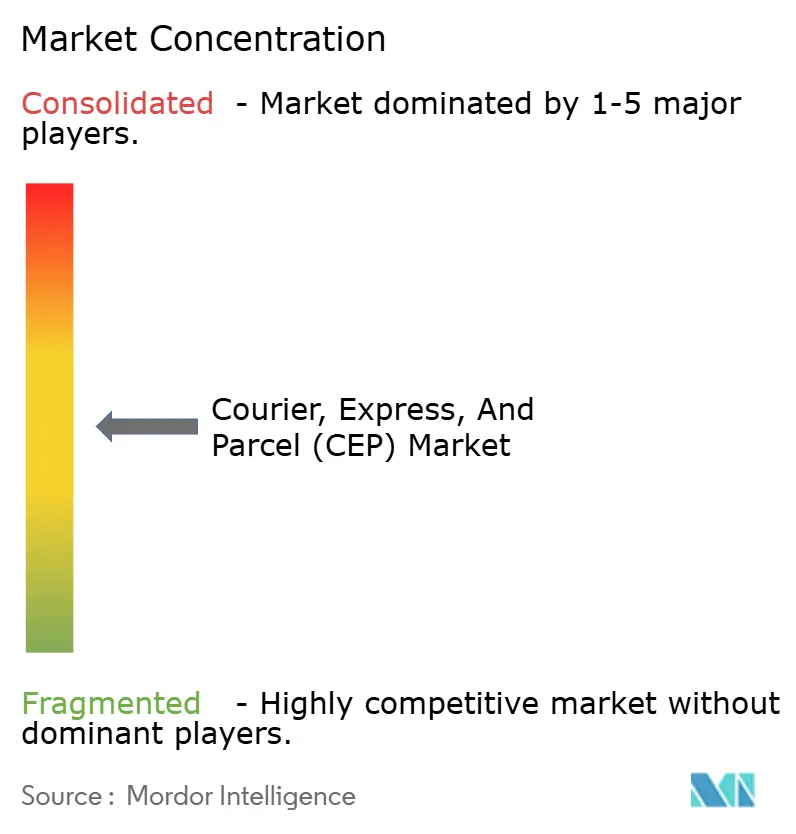
The Courier, Express and Parcel market is moderately concentrated: the top 10 integrators capture about 45% of global revenue, leaving ample space for 12,000 regional specialists. Technology adoption is the dividing line. FedEx’s Memphis Super Hub sorts 12,000 parcels per hour with autonomous robots, while mid-tier rivals rely on manual belts at 40% lower throughput.
Strategic models fall into three camps: asset-heavy integrators (DHL, UPS), platform orchestrators (Cainiao) and geography specialists (Blue Dart, Aramex). Healthcare cold-chain emerges as white space; only 8% of carriers offer end-to-end -80 °C control, allowing new entrants to command 40% price premiums.
Disruptors leverage crowd-shipping, with Uber testing parcel add-ons during passenger trips in 47 U.S. cities, reducing empty miles by 18%. AI route optimization trims delivery cost by 12% and predictive maintenance slashes hub downtime to below 1%. UPS secured 37 automation patents in 2024, while SF Express filed 28 drone and autonomous-vehicle patents, foreshadowing unmanned last mile. Consolidation is tempered by foreign ownership caps in China, India and parts of the Middle East, forcing global players to rely on joint ventures rather than outright acquisitions, which dilutes control but preserves market access.
Courier, Express, And Parcel (CEP) Industry Leaders
DHL Group
FedEx
United Parcel Service of America, Inc. (UPS)
SF Express (KEX-SF)
La Poste Group (including DPD Group)
- *Disclaimer: Major Players sorted in no particular order

Recent Industry Developments
- December 2025: DHL will deploy 500 autonomous delivery robots in Europe and Asia to handle 1 billion parcels annually by 2027.
- November 2025: Yamato launched a Tokyo–North America express lane using Boeing 777 freighters, shaving 12 hours off transit.
- October 2025: Cainiao activated AI sorting in 15 global centers, processing 5 million parcels daily at 99.8% accuracy.
- September 2025: FedEx opened a USD 400 million automated hub in Dubai, lifting Middle East capacity 35%.


Research Methodology Framework and Report Scope
Market Definitions and Key Coverage
Our study defines the global courier, express, and parcel (CEP) market as every door-to-door service that moves documents or parcels under 70 kg through road, air, rail, or water networks, tracks them end-to-end, and charges on a per-item basis. The framework groups revenues by delivery speed, destination, shipment weight, service model, transport mode, and end-user industry so we can capture the full value pool without double counting.
Scope exclusion: freight forwarding and palletized shipments above 70 kg sit outside this assessment.
Segmentation Overview
- By Destination
- Domestic
- International
- By Speed of Delivery
- Express
- Non-Express
- By Model
- Business-to-Business (B2B)
- Business-to-Consumer (B2C)
- Consumer-to-Consumer (C2C)
- By Shipment Weight
- Heavy Weight Shipments
- Light Weight Shipments
- Medium Weight Shipments
- By Mode of Transport
- Air
- Road
- Others
- By End User Industry
- E-Commerce
- Financial Services (BFSI)
- Healthcare
- Manufacturing
- Primary Industry
- Wholesale and Retail Trade (Offline)
- Others
- By Region
- Asia-Pacific
- By Country
- Australia
- China
- India
- Indonesia
- Japan
- Malaysia
- Pakistan
- Philippines
- Thailand
- Vietnam
- Rest of Asia-Pacific
- By Country
- Europe
- By Country
- Albania
- Bulgaria
- Croatia
- Czech Republic
- Denmark
- Estonia
- Finland
- France
- Germany
- Hungary
- Iceland
- Italy
- Latvia
- Lithuania
- Netherlands
- Norway
- Poland
- Romania
- Russia
- Slovak Republic
- Slovenia
- Spain
- Sweden
- Switzerland
- United Kingdom
- Rest of Europe
- By Country
- Middle East and Africa
- By Country
- Egypt
- Nigeria
- Qatar
- Saudi Arabia
- South Africa
- GCC
- UAE
- Rest of Middle East and Africa
- By Country
- North America
- By Country
- Canada
- Mexico
- United States
- Rest of North America
- By Country
- South America
- By Country
- Argentina
- Brazil
- Chile
- Rest of South America
- By Country
- Rest of World
- Asia-Pacific
Detailed Research Methodology and Data Validation
Primary Research
Telephone interviews and online surveys with senior managers from integrators, postal agencies, e-commerce platforms, and fulfillment partners across North America, Europe, and Asia validate growth drivers, price shifts, and service-mix changes. Follow-up calls with technology vendors and regional parcel associations close information gaps and flag nascent trends.
Desk Research
We begin with structured desk work that pulls monthly figures from the Universal Postal Union, World Bank logistics indicators, IATA cargo statistics, and trade associations such as the European Parcel & Postal Forum. Annual reports, 10-Ks, investor decks, and customs portals supply carrier-level splits that enrich baseline inputs.
Subscription resources: D&B Hoovers for company financials, Dow Jones Factiva for news flow, and Questel for parcel-related patent filings help us gauge technology adoption and competitive moves. We also scan regulatory gazettes to monitor de-minimis thresholds and labor rules that sway parcel flows. The sources named illustrate the wider pool we interrogate; many others inform data collection and validation.
Market-Sizing & Forecasting
Our model applies a top-down build that reconstructs domestic and cross-border parcel demand from national volume series, e-commerce penetration, and GDP-adjusted purchasing power, which are then checked against sampled carrier average-price-times-volume roll-ups. Variables such as smartphone adoption, return-rate ratios, aircraft belly-hold capacity, and fuel-adjusted surcharges feed a multivariate regression that projects values to 2030. When bottom-up checks diverge, carrier splits are scaled so totals stay within a ±3 percent band.
Data Validation & Update Cycle
Mordor analysts compare model outputs with independent shipment indices and currency movements, and when anomalies emerge, a second analyst review is triggered before sign-off. Reports refresh each year, with interim updates if regulation, major M&A, or fuel shocks breach predefined thresholds. A final quality sweep occurs just before release so clients receive the latest view.
Why Mordor's Courier, Express, And Parcel (CEP) Baseline Commands High Confidence Across Decision-Making Circles
Published CEP estimates often disagree because firms slice the market differently, convert currencies at varied points, or refresh models on uneven cadences. We believe buyers deserve transparency, so the main factors behind divergent numbers are previewed below.
Key gap drivers include narrower scopes that drop over-weight parcels, optimistic volume multipliers tied to short-term e-commerce spikes, or aggressive price escalators. Our study presents a balanced base case, uses constant 2024 dollars, and is refreshed annually.
Benchmark comparison
| Market Size | Anonymized source | Primary gap driver |
|---|---|---|
| USD 686.8 B (2025) | Mordor Intelligence | - |
| USD 506.2 B (2024) | Global Consultancy A | Excludes parcels above 30 kg yet applies higher unit prices; currency fixed at 2023 rates |
| USD 456.6 B (2024) | Industry Analyst B | Models only B2C flows and omits cross-border returns |
These comparisons show that, once scope, weight ceilings, and pricing logic are aligned, Mordor's number offers a dependable midpoint between optimistic and conservative views. Clients can trace every variable back to public series and clearly documented interviews, which is why planners keep turning to us for a reliable baseline.


Key Questions Answered in the Report
How big is the Courier, Express and Parcel market in 2026?
How big is the Courier, Express and Parcel market in 2026?
Which region is growing fastest in parcel deliveries?
Which region is growing fastest in parcel deliveries?
What shipment weight segment is expanding quickest?
What shipment weight segment is expanding quickest?
Why are fuel surcharges still high even as oil prices ease?
Why are fuel surcharges still high even as oil prices ease?
Which end-user industry offers the best growth opportunity?
Which end-user industry offers the best growth opportunity?
How fragmented is the competitive landscape?
How fragmented is the competitive landscape?
Page last updated on:


