United States Beverage Contract Bottling And Filling Market Size and Share
Market Overview
| Study Period | 2020 - 2031 |
|---|---|
| Forecast Data Period | 2026 - 2031 |
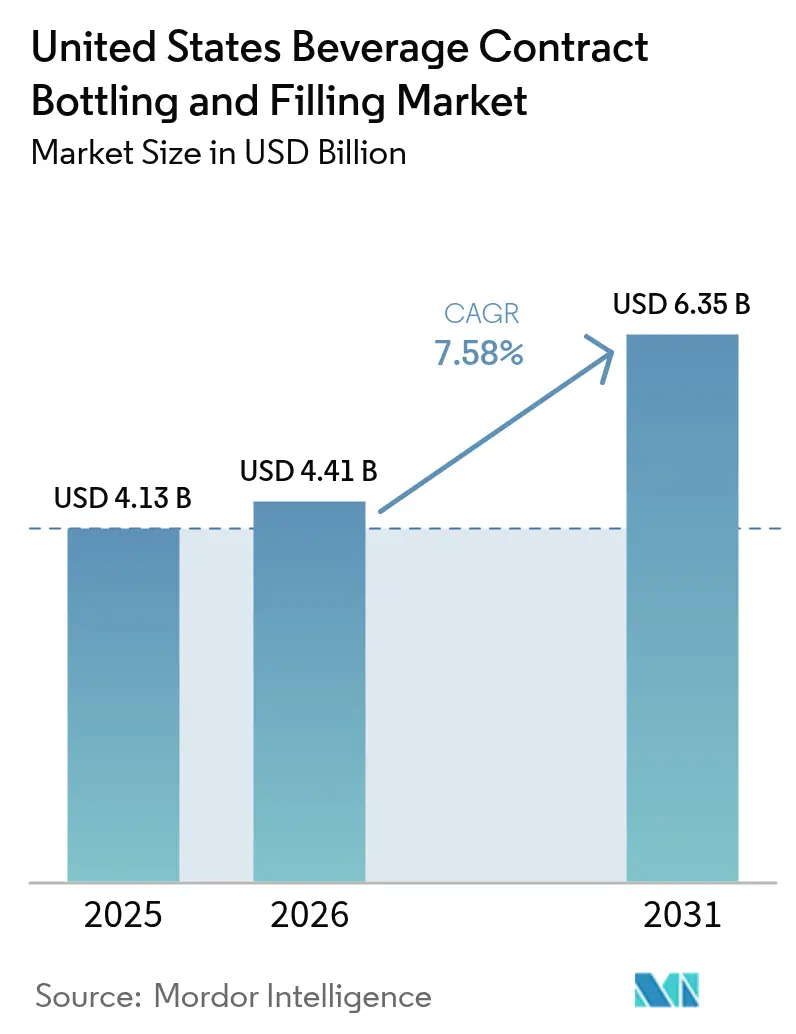
| Base Year Market Size (2025) | USD 4.13 Billion |
| Market Size (2026) | USD 4.41 Billion |
| Market Size (2031) | USD 6.35 Billion |
| Growth Rate (2026 - 2031) | 7.58% CAGR |
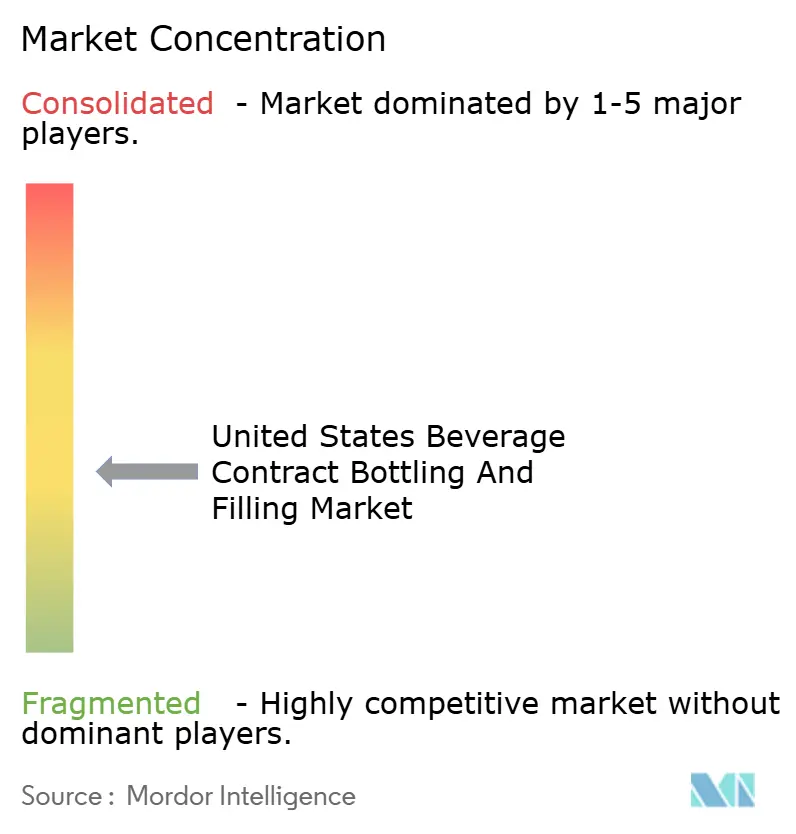
| Market Concentration | Medium |
Major Players *Disclaimer: Major Players sorted in no particular order Image © Mordor Intelligence. Reuse requires attribution under CC BY 4.0. | |
United States Beverage Contract Bottling And Filling Market Analysis by Mordor Intelligence
The United States beverage contract bottling and filling market size was valued at USD 4.13 billion in 2025 and is estimated to grow from USD 4.41 billion in 2026 to reach USD 6.35 billion by 2031, at a CAGR of 7.58% during the forecast period (2026-2031). Outsourcing momentum is rising as brand owners seek faster commercialization, lighter balance sheets, and access to specialized filling assets that flex with short-run SKUs. Health-oriented formulations, sustainability mandates, and e-commerce sampling are combining to pull production toward co-packers that marry aseptic, nitrogen dosing, and high-pressure processing on a single campus. Digital twin platforms have raised line effectiveness above 85%, while resin lightweighting keeps transportation costs in check despite material volatility. Margin headwinds from PET and aluminum swings persist, yet flexible pass-through contracts and closed-loop recycling are preserving profitability for leading operators.
Key Report Takeaways
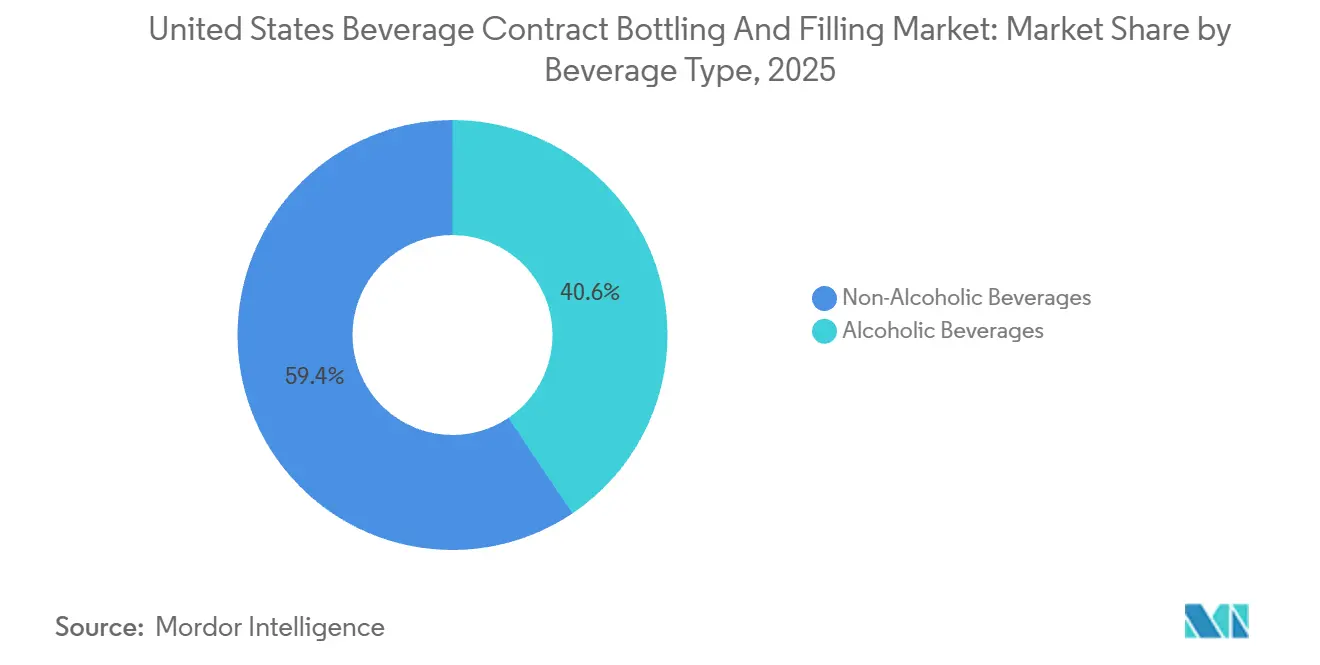
- By beverage type, non-alcoholic lines led with 59.42% of the United States beverage contract bottling and filling market share in 2025, while the alcoholic segment is projected to post an 8.19% CAGR through 2031.
- By packaging format, PET commanded 55.22% of the United States beverage contract bottling and filling market size in 2025, whereas aseptic cartons and pouches are advancing at an 8.73% CAGR.
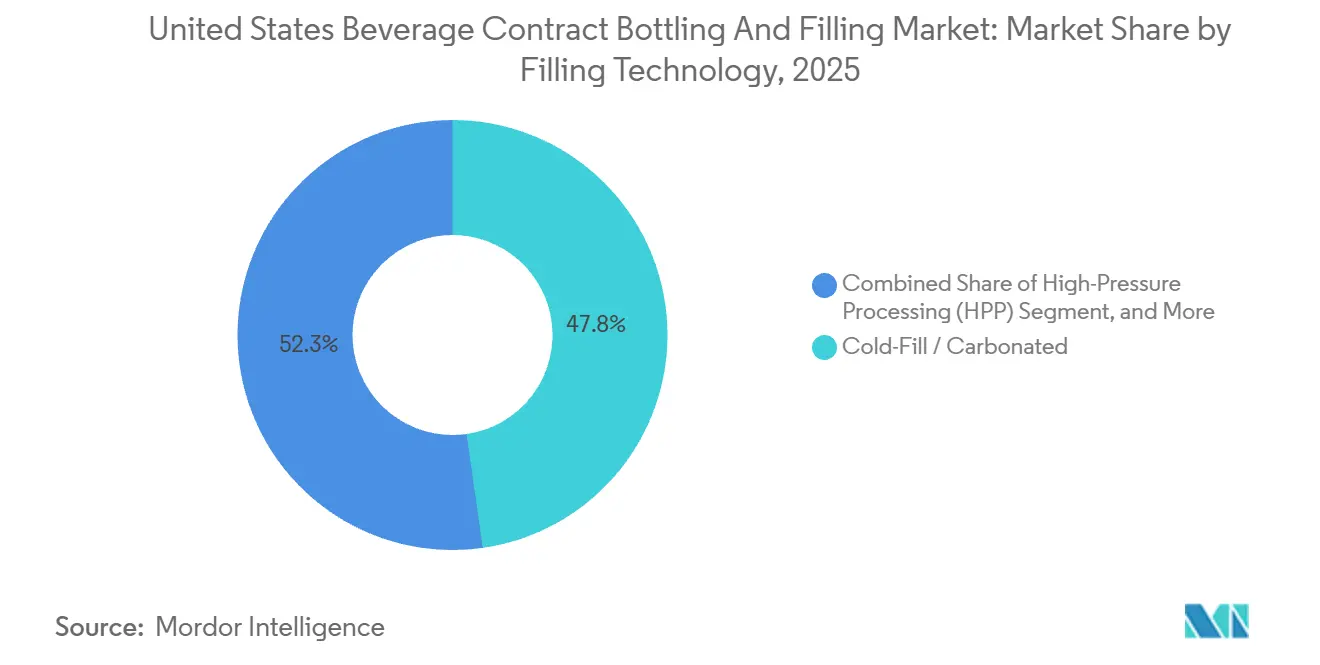
- By filling technology, cold-fill and carbonated lines held 47.75% of the United States beverage contract bottling and filling market size in 2025, and high-pressure processing is forecast to expand at an 8.46% CAGR during 2026-2031.
- By service type, turnkey full-service contracts captured 46.13% market share in 2025, but pilot and small-batch runs are set to grow at an 8.82% CAGR to 2031.
Note: Market size and forecast figures in this report are generated using Mordor Intelligence’s proprietary estimation framework, updated with the latest available data and insights as of 2026.
United States Beverage Contract Bottling And Filling Market Trends and Insights
Drivers Impact Analysis*
| Driver | (~) % Impact on CAGR Forecast | Geographic Relevance | Impact Timeline |
|---|---|---|---|
| Rising Brand Proliferation and SKU Complexity | +1.8% | National, with concentration in California, Texas, and Northeast metro areas | Medium term (2-4 years) |
| Cost-Efficiency Versus Green-Field CAPEX | +1.5% | National, particularly among mid-market brands and private-equity-backed portfolios | Short term (≤ 2 years) |
| Growth in Health-Oriented RTD Beverages | +1.3% | National, early adoption in West Coast and urban Southeast markets | Medium term (2-4 years) |
| Sustainability-Driven Lightweighting and Recycling | +1.0% | California, Washington, Oregon leading; spreading to Northeast states | Long term (≥ 4 years) |
| Rapid Adoption of HPP-Capable Co-Packing Lines | +0.9% | Concentrated in California, New York, Florida for cold-pressed juice and functional beverages | Medium term (2-4 years) |
| AI-Enabled Digital-Twin OEE Optimization | +0.7% | National, led by top-tier co-packers with multi-site operations | Long term (≥ 4 years) |
| Source: Mordor Intelligence | |||
Rising Brand Proliferation and SKU Complexity
Direct-to-consumer beverage launches averaged 17 SKUs within 18 months during 2024-2025, triple the 2019 baseline. Such proliferation overwhelms in-house fillers, pushing brands toward co-packers that can pivot from 500-case pilots to 20,000-case scale with sub-20-minute changeovers. Embedded flavor and compliance teams shifted USD 280 million of development spend to co-packers in 2025. Texas and Southeast plants logged 30%-40% surges in SKU counts per client, forcing investment in modular tooling to minimize allergen cross-contact risks. Facilities are slow to adapt to risk exclusion from the United States beverage contract bottling and filling market’s innovation pipeline.
Cost-Efficiency Versus Green-Field CAPEX
A 50-million-unit aseptic build costs USD 40-USD 60 million and up to two years of authorizations. Outsourcing converts that fixed outlay into per-unit fees, freeing cash for brand marketing. Private-equity portfolios backed 22% of new beverage brands in 2025 and favor asset-light production to protect exit options. Minimum orders of 10 000 cases defer owned-plant breakeven from 15 million to 30 million units annually. Elevated 2024-2025 borrowing costs accelerated a 12% volume swing toward the United States beverage contract bottling and filling market.
Growth in Health-Oriented RTD Beverages
Functional RTDs posted 26% unit growth in 2025, outrunning traditional sodas. Fourteen new HPP units, each rated 1,200 L h at 87,000 psi, came online in 2025. Co-packers bundling HPP with refrigerated logistics commanded 15-point fee premiums. Live-culture and collagen shots require nitrogen flushing and cold chain, tilting capacity toward coastal hubs with a higher willingness to pay. These dynamics funnel premium fees into the United States beverage contract bottling and filling market.
Sustainability-Driven Lightweighting and Recycling
California SB-54 mandates 25% recycled PET by 2025, climbing to 50% by 2030.[1]CalRecycle, “Senate Bill 54 Recycled Content Requirements,” calrecycle.ca.gov Recycled resin costs 8%-12% more yet cuts Scope 3 emissions by around 30%. Bottle weight dropped from 18 g to 14 g on 500 mL formats between 2023-2025, cutting resin use by 22%. Aluminum 200-end closures shave 1.5 g, saving 4,500 t annually. Co-packers investing USD 2-USD 4 million in closed-loop systems won multi-year deals that anchor cash flows within the United States beverage contract bottling and filling market.
Restraints Impact Analysis*
| Restraint | (~) % Impact on CAGR Forecast | Geographic Relevance | Impact Timeline |
|---|---|---|---|
| Raw-Material Price Volatility (PET, Aluminum) | -1.2% | National, with acute pressure in Midwest and Southeast due to freight differentials | Short term (≤ 2 years) |
| CO₂ and Critical Ingredient Shortages | -0.9% | Midwest and Plains states most affected by ethanol-refinery disruptions | Short term (≤ 2 years) |
| Aseptic and RTD-Alcohol Capacity Bottlenecks | -0.7% | National, concentrated among top-tier co-packers with FDA-validated aseptic lines | Medium term (2-4 years) |
| Escalating Cyber-Insurance Premiums for Food Plants | -0.4% | National, disproportionate impact on mid-sized co-packers with legacy control systems | Medium term (2-4 years) |
| Source: Mordor Intelligence | |||
Raw-Material Price Volatility (PET, Aluminum)
PET spot prices swung USD 0.23 lb in 2025 on Gulf outages. Aluminum premiums averaged USD 0.21 lb, up from USD 0.18 lb in 2024.[2]Aluminum Association, “Aluminum Can Premiums and Market Trends,” aluminum.org Fixed-price agreements forced mid-scale co-packers to absorb USD 15-USD 20 million in costs, trimming margins from 8% to 5%. Forty percent of operators switched to monthly indexes, though startups reported a 10-point dip in contract wins under cost-plus models. Freight add-ons widen Midwest disadvantages inside the United States beverage contract bottling and filling market.
CO₂ and Critical Ingredient Shortages
Ammonia turnarounds and ethanol cutbacks starved the Midwest CO₂ supply in Q2 2025, forcing allocation at Iowa, Illinois, and Nebraska sites. Under-70% utilization deferred USD 35 million in revenue and rerouted contracts to Gulf plants with petrochemical CO₂ streams. Spot prices spiked to USD 450 t, tripling contract baselines and triggering USD 0.10 case surcharges. Co-packers with dual sources or on-site recovery preserved 95% uptime, capturing overflow. Parallel flavor shortages stretched lead times to 16 weeks, delaying functional launches and tightening capacity across the United States beverage contract bottling and filling market.
*Our forecasts treat driver/restraint impacts as directional, not additive. The impact forecasts reflect baseline growth, mix effects, and variable interactions.
Segment Analysis
By Beverage Type: Alcoholic Momentum Reshapes Capacity
Non-alcoholic products retained 59.42% of 2025 throughput, yet RTD alcohol is heading for an 8.19% CAGR through 2031. The Alcohol and Tobacco Tax and Trade Bureau cleared 1 847 new RTD formulas in 2025, a 34% surge over 2024.[3]Alcohol and Tobacco Tax and Trade Bureau, “TTB Approved Formulas and Labeling,” ttb.gov Compliance layers add USD 0.15-USD 0.25 case, but distribution ease and shelf stability lure brands toward outsourcing. Carbonated soft drinks still dominate line hours, yet premium bottled water in glass rose 9%, and dairy-protein shakes climbed 11%. Craft brewers guard recipes in-house, while canned wine and spirits adoption lifted volumes 15%, funneling capital into nitrogen and tunnel pasteurization lines inside the United States beverage contract bottling and filling market.
The United States beverage contract bottling and filling market size tied to alcoholic SKUs increases faster than soda or juice, guiding co-packer spending on bonded warehouses and age-gating software. Within non-alcoholic groupings, HPP juices now cannibalize pasteurized citrus, and prebiotic sodas attract venture rounds that prefer variable production costs. Emerging wellness shots need refrigerated distribution that only select coastal plants provide. This supply-demand mismatch nudges capacity additions toward flexible fillers that can sanitize between collagen, dairy, and beer runs without allergen transfer. Competitive differentiation therefore hinges on regulatory fluency and multi-format agility.


By Packaging Format: Cartons and Pouches Erode PET Dominance
PET accounted for 55.22% of 2025 units, yet aseptic cartons and pouches are predicted to grow 8.73% annually through 2031. Tetra Pak and SIG Combibloc set up 22 fillers in 2025, each churning 18,000 packs/h of plant-based milks and cold-brew coffees. Ambient distribution slashes cold-chain costs, extending reach to dollar and drug channels. Aluminum cans ranked 28% in recyclability, with RTD alcohol and energy drinks fueling demand.
Glass significant market share across the kombucha and mineral water niches, though freight penalties and 1.5% breakage constrain volume. Pouch growth of 14% in children’s hydration highlights merchandising flexibility that retailers reward with broader facings. Regulatory moves toward recycled content favor cartons and cans, promoting portfolio diversity within the United States beverage contract bottling and filling market.
By Filling Technology: HPP Heads the Premium Wave
Cold-fill and carbonated lines delivered 47.75% of 2025 cases, underpinning core soda and beer output. High-pressure processing is projected to grow at an 8.46% CAGR, enabling five-log pathogen reduction at 4 °C while protecting heat-sensitive nutrients. Each unit costs USD 3-USD 5 million and occupies up to 1,500 sq ft, restricting uptake to co-packers with premium brand commitments.
Hot-fill remains 22% for teas and lemonades but loses ground to aseptic systems, which command 18% and enable neutral-pH beverages. Nitrogen dosing was doubled to 5% as nitro coffees and oat milk lattes expanded shelf presence. Technology stacking yields pricing tiers, letting operators hedge commodity swings by balancing volume contracts in the United States beverage contract bottling and filling market.

By Service Type: Pilot Runs Anchor Emerging Pipelines
Turnkey contracts owned 46.13% market share in 2025, reflecting brand appetite to offload formulation, procurement, and logistics. Pilot and small-batch runs, forecast to grow 8.82%, cater to seed-funded startups with 500-case minimums and 48-hour reformulation loops. Partial processing took 28% as concentrate owners leverage existing supply deals. Retailer private-label 18% benefited from premium store-brand pushes and locked multi-year volumes, stabilizing plant utilization.
Full-service giants now embed pilot bays to hook emerging brands early, smoothing their migration to million-case annual runs and deepening customer capture in the United States beverage contract bottling and filling market. These pilot projects carry 40%-60% per-case surcharges that offset frequent changeovers and formulation support, making them disproportionately profitable despite lower absolute volume. Co-packers are therefore investing in modular filler blocks, quick-clean valves, and cloud-based recipe libraries so that pilot bays can pivot across 20 or more SKUs in a single shift without increasing allergen cross-contact risks.
Geography Analysis
California, Texas, Florida, and the Northeast corridor collectively housed roughly 65% of 2025 capacity, shaped by ingredient proximity and end-market density. California leads in functional drinks but strict water-use permits and recycled-content laws are steering marginal investment to Texas and the Southeast. Texas added four plants totaling 180 million cases during 2024-2025, capitalizing on its central location and favorable tax policies. Florida’s citrus legacy is morphing into RTD alcohol and wellness beverages, leveraging port access for Latin tropical purees.
The Midwest anchors legacy soda lines but suffered CO₂ rationing in 2025, diverting volume to Gulf Coast facilities with petrochemical feedstock. Mountain West states such as Colorado and Utah have become magnets for pilot runs, combining lower labor costs and an outdoor brand ethos. Southeast nodes spanning Georgia, North Carolina, and Tennessee captured 12% of new capital as logistics corridors sync with East Coast metros.
Secondary markets differentiate through certifications; organic lines in Riverside, California, kosher fillers in New York, and allergen-free halls in Idaho. Such specialization commands price premiums and offsets the economies of smaller batch sizes. Geographic diversification grants brands redundancy, lowering risk from local ingredient shocks, water restrictions, or labor disputes. Collectively these forces channel new projects into the most supply-resilient nodes of the United States beverage contract bottling and filling market.
Competitive Landscape
The United States beverage contract bottling and filling market remains moderately fragmented, scoring 6 on the concentration scale as the top five players control nearly 40% of capacity. Niagara Bottling, Refresco Beverages, and G3 Enterprises lead multistate networks with integrated PET preforms and distribution fleets. Private-equity consolidators continue stitching regional assets into national platforms targeting aseptic wellness, RTD alcohol, and small-batch innovation.
Strategic expansions cluster in Texas and the Southeast, where land and water are plentiful, and logistics synergies abound. Leaders install HPP and aseptic lines alongside AI scheduling that cuts changeover from 90 minutes to under 20 minutes. Challenger firms win high-margin slots by embedding flavor labs, regulatory desks, and refrigerated logistics for probiotic and collagen beverages. Technology adoption widens performance gaps, as digital twins refine quotations and reduce trial-and-error costs. Escalating cyber-insurance premiums penalize legacy control systems, nudging upgrades that will further stratify competitiveness in the United States beverage contract bottling and filling market.
Technology adoption is widening performance gaps among competitors. Top-tier operators deploy AI-enabled digital twins that simulate line behavior across hundreds of SKU permutations and trim changeover downtime from 90 minutes to under 20 minutes, lifting overall equipment effectiveness to more than 85%. Many have layered automated vision inspection, cloud-based recipe management, and predictive maintenance analytics to curb scrap rates and unplanned outages. Sustainability upgrades ranging from on-site PET flake regrind loops to closed-loop water systems secure long-term contracts with brands under pressure to meet Scope 3 emission goals. Conversely, operators running legacy control systems face escalating cyber-insurance premiums and lender scrutiny, which can elevate borrowing costs by 150 basis points and hamper expansion budgets. Workforce dynamics add another competitive lever, as plants that offer structured training on HPP safety, nitrogen handling, and aseptic validation attract and retain certified technicians who are increasingly scarce in tight labor markets.
United States Beverage Contract Bottling And Filling Industry Leaders
Niagara Bottling LLC
Refresco Beverages US Inc.
G3 Enterprises Inc.
Brooklyn Bottling Group
Southeast Bottling & Beverage LLC
- *Disclaimer: Major Players sorted in no particular order

Recent Industry Developments
- January 2026: Refresco Beverages US Inc. completed a USD 45 million aseptic expansion in Wharton, New Jersey that adds two 15 000-carton h lines for ambient plant-based milks and RTD coffees.
- December 2025: Niagara Bottling LLC announced a USD 70 million greenfield plant in Phoenix, Arizona, slated for Q3 2027 with 200 million-case PET capacity and on-site preform molding.
- November 2025: Brooklyn Bottling Group installed an 8 000-can h nitrogen-dosing line at its Queens, New York facility to serve nitro coffee and oat-milk lattes.
- October 2025: G3 Enterprises acquired a 120 000 sq ft Atlanta, Georgia plant for USD 28 million, adding 60 million-case capacity and HPP capability.


United States Beverage Contract Bottling And Filling Market Report Scope
Contract bottling is hiring another company with a bottling plant to bottle wine, beer, or spirits for manufacturers. Contract bottlers usually handle the entire process, from bottling to labeling. The research also examines underlying growth influencers and key industry vendors, all of which support market estimates and growth rates throughout the anticipated period. The market estimates and projections are based on base-year factors and are derived using top-down and bottom-up approaches.
The United States Beverage Contract Bottling and Filling Market Report is Segmented by Beverage Type (Non-Alcoholic Beverages, and Alcoholic Beverages), Packaging Format (Glass Bottles, PET Bottles, Aluminum Cans, and Aseptic Cartons and Pouches), Filling Technology (Hot-Fill, Cold-Fill/Carbonated, Aseptic, High-Pressure Processing (HPP), and Nitrogen Dosing), and Service Type (Turnkey Full-Service, Partial/Custom Processing, Private-Label Manufacturing, and Pilot and Small-Batch Runs). The Market Forecasts are Provided in Terms of Value (USD).
| Non-Alcoholic Beverages | Carbonated Soft Drinks(CSD) |
| Bottled Water | |
| Juices | |
| Dairy-Based Dinks | |
| Other Non-Alcoholic Beverages | |
| Alcoholic Beverages | Beer |
| Wine | |
| Spirits |
| Ready-to-Drink (RTD) Alcoholic Beverages |
| Glass Bottles |
| PET Bottles |
| Aluminum Cans |
| Aseptic Cartons and Pouches |
| Hot-Fill |
| Cold-Fill / Carbonated |
| Aseptic |
| High-Pressure Processing (HPP) |
| Nitrogen Dosing |
| Turnkey Full-Service |
| Partial / Custom Processing |
| Private-Label Manufacturing |
| Pilot and Small-Batch Runs |
| By Beverage Type | Non-Alcoholic Beverages | Carbonated Soft Drinks(CSD) |
| Bottled Water | ||
| Juices | ||
| Dairy-Based Dinks | ||
| Other Non-Alcoholic Beverages | ||
| Alcoholic Beverages | Beer | |
| Wine | ||
| Spirits | ||
| By Packaging Format | Ready-to-Drink (RTD) Alcoholic Beverages | |
| Glass Bottles | ||
| PET Bottles | ||
| Aluminum Cans | ||
| Aseptic Cartons and Pouches | ||
| By Filling Technology | Hot-Fill | |
| Cold-Fill / Carbonated | ||
| Aseptic | ||
| High-Pressure Processing (HPP) | ||
| Nitrogen Dosing | ||
| By Service Type | Turnkey Full-Service | |
| Partial / Custom Processing | ||
| Private-Label Manufacturing | ||
| Pilot and Small-Batch Runs | ||


Key Questions Answered in the Report
What is the projected value of the United States beverage contract bottling and filling market by 2031?
The segment is forecast to reach USD 6.35 billion by 2031, expanding at a 7.58% CAGR from 2026-2031.
Which beverage category is expanding the fastest in outsourced bottling?
Ready-to-drink alcoholic beverages, including cocktails, hard seltzers, and canned wines, are advancing at an 8.19% CAGR, outpacing non-alcoholic lines.
Why are emerging brands favoring pilot-run co-packing services?
Pilot and small-batch runs with 500-case minimums help startups test multiple SKUs quickly, conserve capital, and refine recipes before scaling.
Which packaging formats are gaining share against PET bottles?
Aseptic cartons and pouches are growing at an 8.73% CAGR because they enable ambient distribution and align with recycled-content mandates.
How are co-packers mitigating raw-material price swings?
Many operators have shifted to cost-plus or monthly resin-index contracts and invested in on-site recycling loops to buffer PET and aluminum volatility.
Where are most new co-packing plants being built in the United States?
Texas and Southeast states such as Georgia and Tennessee are attracting the bulk of new capacity thanks to favorable logistics, water availability, and tax incentives.
Page last updated on:


