Market Overview
| Study Period | 2020 - 2031 |
|---|---|
| Forecast Data Period | 2026 - 2031 |
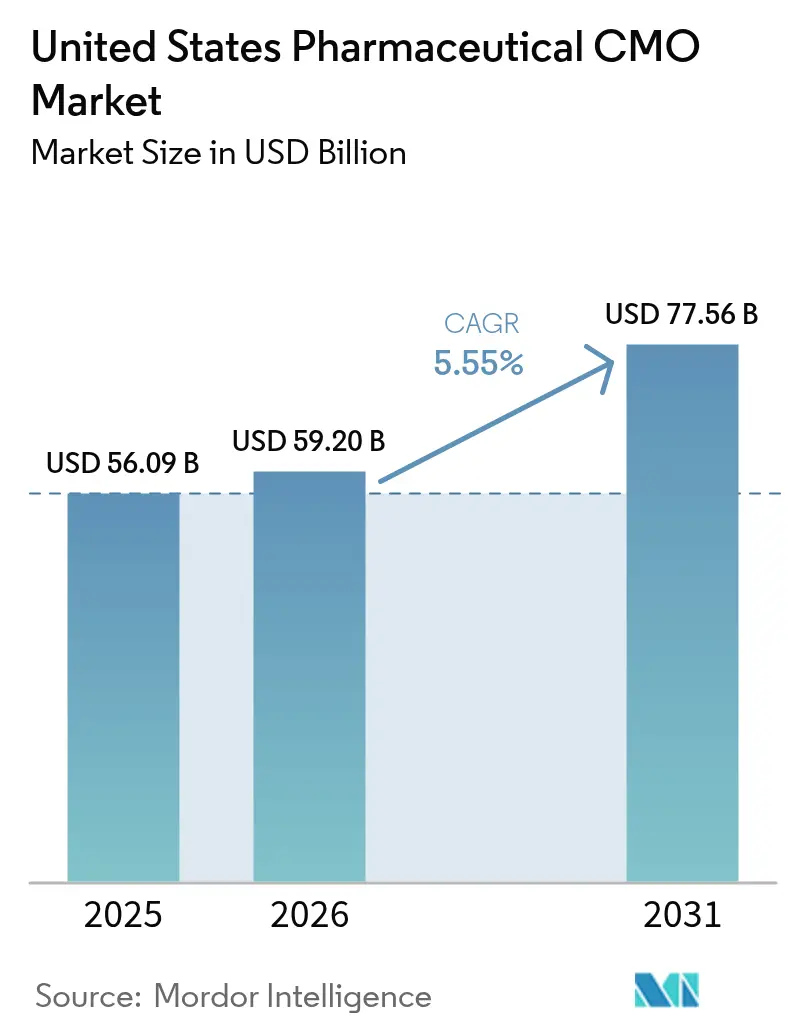
| Base Year Market Size (2025) | USD 56.09 Billion |
| Market Size (2026) | USD 59.20 Billion |
| Market Size (2031) | USD 77.56 Billion |
| Growth Rate (2026 - 2031) | 5.55% CAGR |
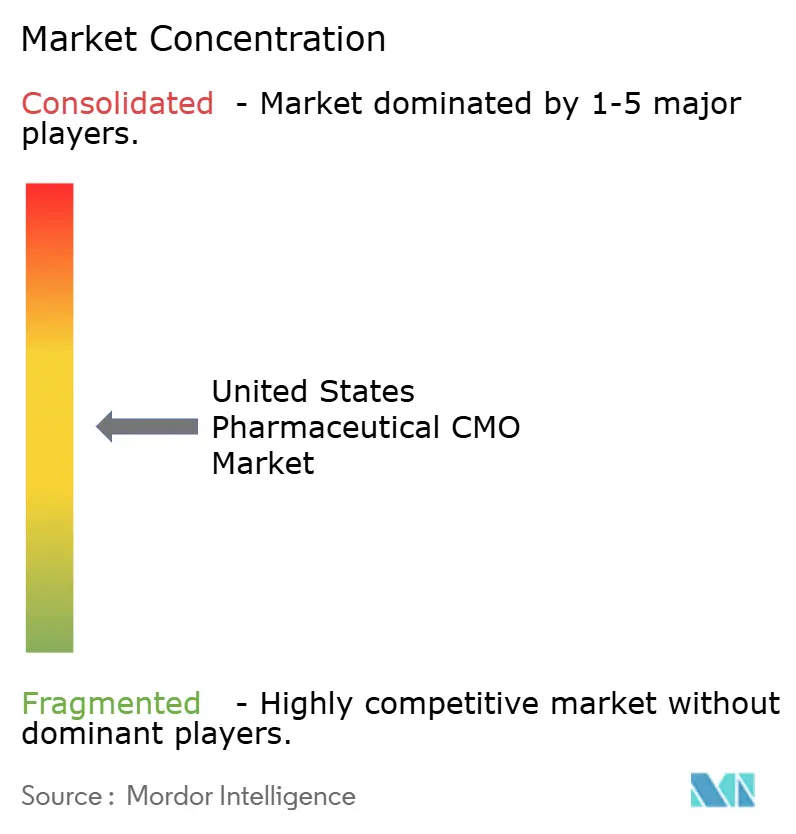
| Market Concentration | Medium |
Major Players *Disclaimer: Major Players sorted in no particular order Image © Mordor Intelligence. Reuse requires attribution under CC BY 4.0. | |
United States Pharmaceutical CMO Market Analysis by Mordor Intelligence
The United States pharmaceutical CMO market size was valued at USD 55.91 billion in 2025 and estimated to grow from USD 59.2 billion in 2026 to reach USD 77.56 billion by 2031, at a CAGR of 5.55% during the forecast period (2026-2031). Cost-intensive reshoring triggered by the 2024 BioSecure Act, surging demand for GLP-1 receptor agonists, and persistent shortages in sterile fill-finish suites have combined to increase orders and lift pricing power for domestic contract manufacturers. Investments in high-potency API (HPAPI) containment, single-use bioreactors, and automated visual-inspection systems are accelerating because sponsors require faster batch release and tighter occupational-exposure controls. At the same time, ransomware incidents and full implementation of serialization under the Drug Supply Chain Security Act have elevated cybersecurity and compliance costs, nudging smaller operators toward consolidation. These countervailing forces define a transition phase in which capacity expansion and digitalization offset, but do not eliminate, margin pressure.
Key Report Takeaways
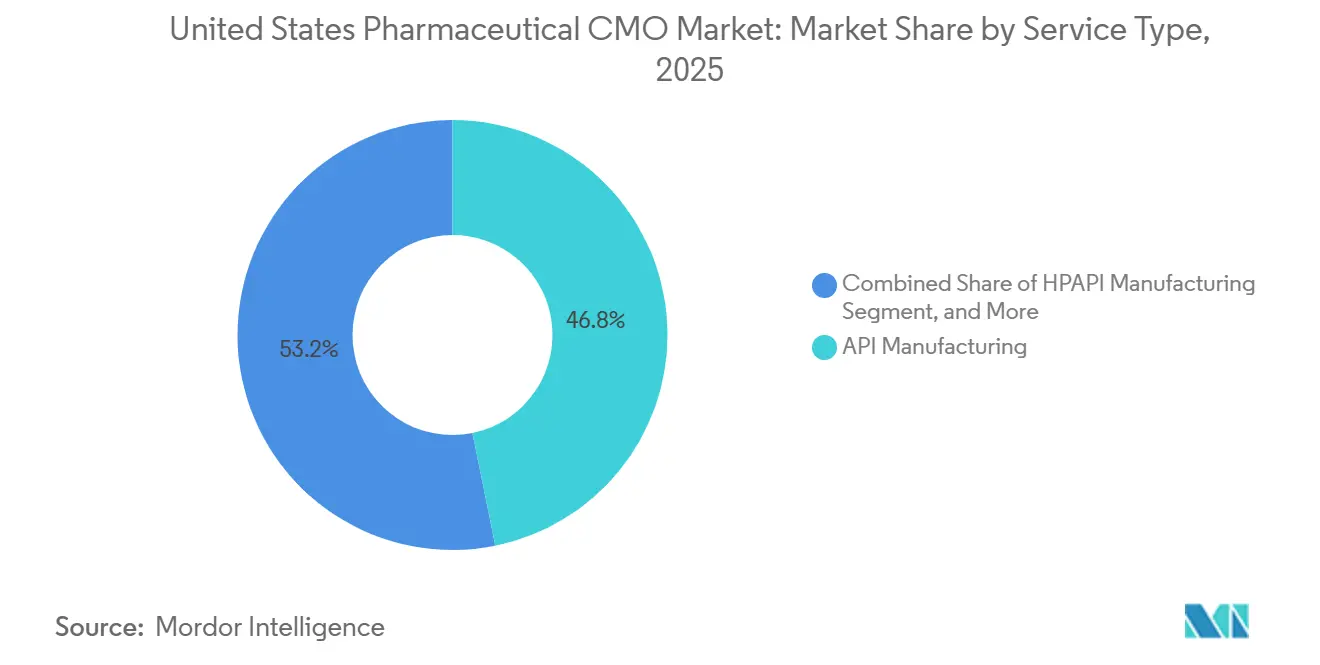
By service type, API manufacturing commanded 46.81% revenue in 2025; HPAPI suites are advancing at a 6.21% CAGR through 2031.
By drug molecule type, small molecules held 58.24% of the United States pharmaceutical CMO market share in 2025, whereas advanced therapies are projected to expand at a 6.52% CAGR to 2031.
By scale of operation, commercial-scale manufacturing led with 61.53% revenue share in 2025; clinical-phase services are advancing at a 5.92% CAGR through 2031.
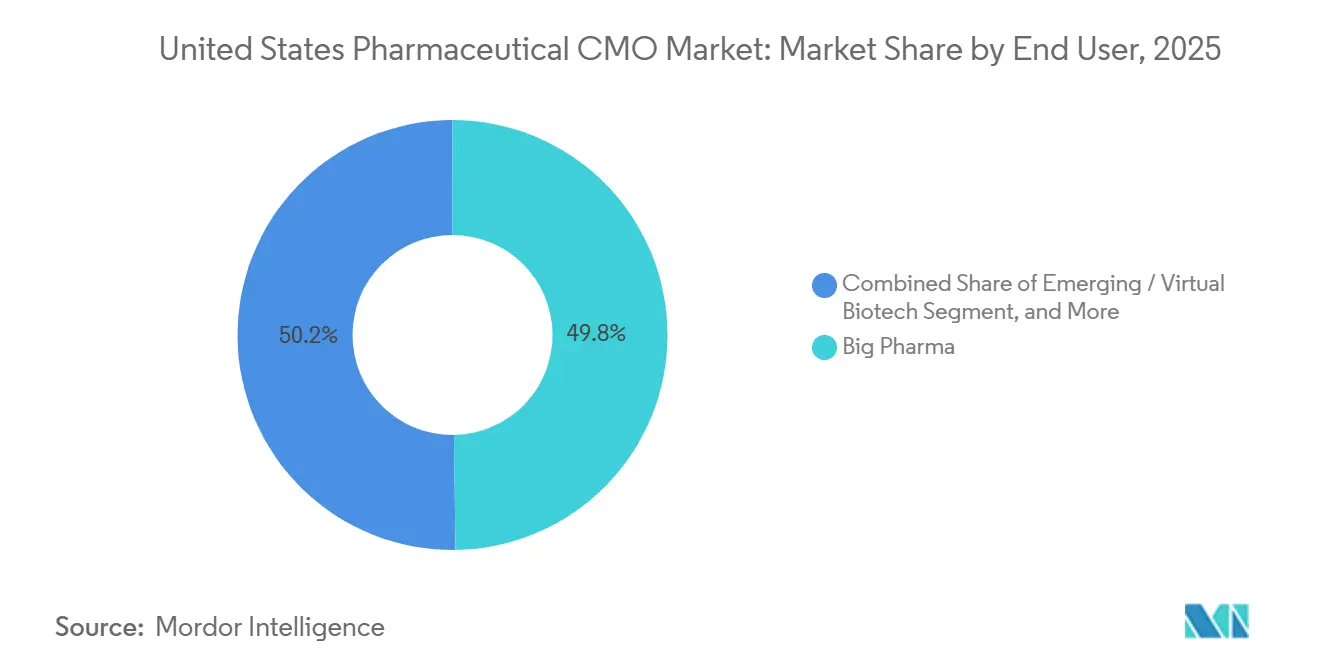
By end user, Big Pharma accounted for 49.78% of spending in 2025, while emerging and virtual biotech clients are growing at a 5.96% CAGR to 2031.
By therapeutic area, oncology captured 28.41% revenue in 2025; infectious disease applications are set to grow at a 5.88% CAGR between 2026-2031.
Note: Market size and forecast figures in this report are generated using Mordor Intelligence’s proprietary estimation framework, updated with the latest available data and insights as of 2026.
United States Pharmaceutical CMO Market Trends and Insights
Drivers Impact Analysis*
| Driver | (~) % Impact on CAGR Forecast | Geographic Relevance | Impact Timeline |
|---|---|---|---|
| Surge in GLP-1 Demand Straining Fill-Finish Capacity | +1.20% | United States, with acute bottlenecks in North Carolina, Indiana, and New Jersey fill-finish corridors | Short term (≤ 2 years) |
| BioSecure Act and Domestic Sourcing Incentives | +1.00% | United States, with secondary effects in Puerto Rico and Ireland for allied capacity | Medium term (2-4 years) |
| Growing Pipeline of Biologics and Advanced Therapies | +0.90% | United States, concentrated in Boston-Cambridge, San Francisco Bay Area, and Research Triangle clusters | Long term (≥ 4 years) |
| Shift Toward Outsourcing to Reduce CapEx | +0.80% | United States, led by virtual biotechs and mid-tier specialty pharma | Medium term (2-4 years) |
| Capacity Shortages Among U.S. Sterile Facilities | +0.70% | United States, particularly aseptic fill-finish suites in the Midwest and Mid-Atlantic | Short term (≤ 2 years) |
| Rising Demand for High-Potency API Suites | +0.60% | United States, with investments in contained manufacturing in Pennsylvania, New Jersey, and North Carolina | Long term (≥ 4 years) |
| Source: Mordor Intelligence | |||
Surge In GLP-1 Demand Straining Fill-Finish Capacity
Weekly semaglutide and tirzepatide prescriptions tripled between 2023 and 2025, overwhelming syringe and autoinjector lines originally sized for insulin volumes. The 2024 acquisition of three Catalent plants by Novo Nordisk removed roughly one-quarter of open-market injectable slots, forcing smaller sponsors to accept 18-month queues or premium surcharges. Eli Lilly’s USD 9 billion Lebanon, Indiana, build-out will add four aseptic suites by 2027, yet interim shortages persist.[1]Financial Times, “GLP-1 Drug Shortages Strain Pharmaceutical Manufacturing Capacity,” ft.com CDMOs now charge 30%-40% more than 2024 rates for expedited GLP-1 projects, spurring rapid adoption of single-use filling systems and automated vision inspection. The FDA’s Quality Management Maturity pilot, launched in 2024, rewards real-time release testing that trims two to three weeks from batch cycles.[2]U.S. Food and Drug Administration, “Quality Management Maturity Program,” fda.gov
BioSecure Act And Domestic Sourcing Incentives
Effective May 2024, the BioSecure Act bars federal contractors from sourcing drug substance from suppliers with significant Chinese ties, redirecting an estimated USD 3 billion in biologics work to domestic and allied CDMOs within a year.[3]U.S. Congress, “BioSecure Act of 2024,” congress.gov Mammalian cell-culture bookings now run 9-15 months, prompting Samsung Biologics to break ground on a USD 2.2 billion, 256,000-liter Texas plant slated for late 2027 start-up. Lonza followed with a USD 1 billion Pearland expansion focused on CHO cell lines. National Resilience raised USD 800 million for a California gene-therapy hub aimed at biodefense contracts. Federal auditors now scrutinize ISO 13485 and 21 CFR Part 11 compliance in unprecedented depth, raising the bar for smaller competitors.
Growing Pipeline of Biologics and Advanced Therapies
The FDA cleared 18 biologics license applications in 2025, its highest annual total since 2018, while investigational filings for cell and gene therapies climbed 22% year over year. Thermo Fisher’s USD 650 million Plainville viral-vector site went live in early 2025, offering 2,000-liter lentiviral and AAV runs. FUJIFILM Diosynth completed a USD 2 billion North Carolina build that co-locates mRNA, lipid-nanoparticle, and gene-therapy suites. Virtual biotechs, which own no internal facilities, now generate 40% of new CDMO contracts and often include equity or royalty components for risk-sharing. These dynamics lift demand for flexible cleanrooms that can toggle between virus-based and non-viral modalities in weeks.
Shift Toward Outsourcing to Reduce CapEx
Sponsors deferred USD 12 billion in greenfield plant spending during 2024-2025, redirecting cash to trials and launches while leaning on CDMOs for synthesis, formulation, and packaging. A single aseptic line costs USD 150-200 million and three to four years to validate, a timeline incompatible with venture-backed development milestones. High-potency API manufacturing, which commands 50%-70% pricing premiums, is growing fastest because only 12 U.S. plants offer SafeBridge-certified containment at commercial scale. Cambrex added two HPAPI reactors with a USD 120 million Iowa investment announced March 2025. As CDMOs scale, they widen the cost gap versus in-house manufacturing, reinforcing the outsourcing flywheel.
Restraints Impact Analysis*
| Restraint | (~) % Impact on CAGR Forecast | Geographic Relevance | Impact Timeline |
|---|---|---|---|
| Lower-Cost CDMOs in Asia-Pacific and South America | -0.80% | Global, with competitive pressure from India, China, and Brazil on small-molecule and generic APIs | Medium term (2-4 years) |
| Regulatory Complexities and Serialization Mandates | -0.50% | United States, with cascading effects on export compliance for Canada and European Union markets | Short term (≤ 2 years) |
| Acute Scarcity of Skilled Radiopharmaceutical Workforce | -0.30% | United States, concentrated in regions with nuclear medicine programs and university hospitals | Long term (≥ 4 years) |
| Cybersecurity Insurance Premiums Post-Ransomware Incidents | -0.20% | United States, affecting mid-sized CDMOs with limited IT budgets | Short term (≤ 2 years) |
| Source: Mordor Intelligence | |||
Lower-Cost CDMOs In Asia-Pacific and South America
Indian and Chinese suppliers undercut U.S. API pricing by 30%-40%, and Brazilian operators added USD 400 million in sterile-injectable capacity during 2025. Biocon Biologics and Dr. Reddy’s have scaled biosimilars for trastuzumab and adalimumab, positioning to capture share when U.S. patents expire in 2027-2028. Although the FDA issued 14 warning letters to Indian API plants in 2024 for data-integrity failures, dual-sourcing remains common because generic margins cannot absorb U.S. cost structures. Consequently, domestic CDMOs must compete on speed, quality metrics, or high-containment niches that low-cost rivals cannot mimic. Margin compression is most acute in commodity oral solids, where price sensitivity is highest.
Regulatory Complexities and Serialization Mandates
Full DSCSA serialization took effect in November 2024, forcing every prescription-drug package to carry a unique identifier and audit trail. Mid-sized CDMOs spent USD 5-10 million retrofitting packaging lines with vision systems and cloud aggregation, and batch release now slips three to five days when aggregation errors occur. Divergent standards in the European Union and Brazil oblige exporters to maintain parallel packaging specs, swelling inventory and validation burdens. Smaller operators without enterprise systems exited the market rather than fund upgrades, tightening capacity in certain injectable products. The compliance distraction diverts capital from throughput-expansion projects, tempering headline growth.
*Our forecasts treat driver/restraint impacts as directional, not additive. The impact forecasts reflect baseline growth, mix effects, and variable interactions.
Segment Analysis
By Service Type: HPAPI Suites Capture Oncology Premiums
High-potency API work grew 6.21% annually through 2031, the quickest pace within the service mix. The United States pharmaceutical CMO market size for API services reached USD 26.17 billion in 2025, with HPAPI contributing the steepest margin because antibody-drug conjugate payloads require nanogram-level containment. Cambrex’s USD 120 million Iowa reactors exemplify the shift toward cytotoxic specialization. Full-dose formulation, including solid, liquid, and injectable products, fills the remainder of revenue, yet injectable demand is expanding fastest due to GLP-1 and biologics pipelines. Continuous manufacturing in solid dose cuts cycle time 75% but fewer than 20 domestic lines use the technology.
Service providers are bifurcating scale players invest in integrated API-to-packaging chains, while niche firms target HPAPI, radiolabelling, or lipid-nanoparticle formulation. Sponsors pay 30%-70% premiums for SafeBridge-certified suites versus standard reactors, expanding the United States pharmaceutical CMO market by incentivizing brownfield retrofits. Commodity solid-dose producers, by contrast, compete on throughput and cost, especially as generic pricing pressure intensifies.


By Drug Molecule Type: Advanced Therapies Outpace Legacy Modalities
Small molecules still accounted for 58.24% revenue in 2025, yet advanced therapies are accelerating at a 6.52% CAGR to 2031. Viral-vector and plasmid-DNA capacity shortfalls elevate booking windows to 12-18 months. Thermo Fisher’s Plainville site and FUJIFILM Diosynth’s North Carolina campus illustrate the capital race toward large-scale gene-therapy production. Biologics occupy the middle trajectory, sustained by established CHO platforms and biosimilar opportunities as blockbuster antibodies lose exclusivity.
The United States pharmaceutical CMO market share for advanced therapies, while modest today, is set to widen as payers embrace one-time curative treatments. Simultaneously, small-molecule CDMOs hedge with HPAPI upgrades and abuse-deterrent formulation expertise to defend margins. Molecule diversity therefore anchors strategic flexibility for contractors.
By Scale of Operation: Clinical-Phase Services Gain Momentum
Commercial production remained dominant at 61.53% revenue in 2025, but clinical-phase work is climbing 5.92% annually because venture-backed biotechs file record IND volumes. National Resilience earmarked USD 800 million for a California gene-therapy campus designed for 10–200-liter runs. Sponsors accept 40%-60% premiums for speed and batch flexibility, lifting the United States pharmaceutical CMO market size for clinical services above USD 19 billion in 2026.
However, process-transfer attrition remains high: fewer than 30% of Phase 3 programs scale to commercial volume without re-formulation. CDMOs with integrated clinical-to-commercial campuses mitigate this risk, securing multi-year take-or-pay contracts. Commercial-scale operators, meanwhile, pursue automation to hold unit costs even as wage inflation rises.
By End User: Virtual Biotechs Drive Outsourcing Surge
Big Pharma supplied 49.78% of 2025 spending, yet emerging and virtual biotechs are the fastest-growing clientele at 5.96% CAGR. Avid Bioservices reported a 35% jump in virtual-biotech contracts during 2025, reflecting the zero-infrastructure business model. The United States pharmaceutical CMO market accommodates divergent needs: large sponsors want geographic redundancy and quality metrics, while startups prioritize rapid toxicology batches and milestone-based payment schedules.
Generic-drug makers, squeezed by biosimilar competition, shift solid-dose work to lower-cost U.S. regions and Puerto Rico. Specialty pharma balances in-house know-how with outsourced fill-finish for orphan drugs and controlled substances. The client mix is fragmenting, rewarding CDMOs that tailor contracting models across the spectrum.
By Therapeutic Area: Oncology Dominates, Infectious Disease Accelerates
Oncology captured 28.41% revenue in 2025 thanks to checkpoint inhibitors, CAR-T, and antibody-drug conjugates requiring HPAPI suites and aseptic filling. Infectious-disease projects, leveraging mRNA platforms, will grow 5.88% annually as sponsors pivot COVID-19 infrastructure toward flu and RSV. Cardiovascular and CNS work lags because pipelines mature and generic erosion bites, though opportunities persist in long-acting injectables.
The United States pharmaceutical CMO market share for oncology is expected to remain above one-quarter through 2031. Meanwhile, mRNA versatility sustains infectious-disease growth, supporting capacity utilization in lipid-nanoparticle suites built during the pandemic. Therapeutic diversification therefore underpins resilient contractor revenues.
Geography Analysis
The Northeast corridor, spanning Massachusetts, New Jersey, and Pennsylvania, generated an estimated 32% of the United States pharmaceutical CMO market share in 2025, anchored by Thermo Fisher’s viral-vector campus in Plainville and Catalent’s fill-finish plant in Somerset. High academic density in Boston–Cambridge supplies skilled labour and Phase 1 demand, while proximity to Big Pharma headquarters accelerates tech-transfer cycles. North Carolina’s Research Triangle leverages lower wages and university partnerships; FUJIFILM Diosynth’s USD 2 billion mRNA-and-gene-therapy build has turned the region into the fastest-growing biologics cluster. Indiana, Iowa, and Illinois dominate commodity oral-solid and high-potency API output, helped by ample land, favourable tax credits, and expansions by Eli Lilly and Cambrex. Collectively, these four states account for more than half of the United States pharmaceutical CMO market size by revenue in 2026.
Texas emerged as a new biomanufacturing hub in 2025 after Samsung Biologics and Lonza announced USD 3.2 billion of combined investment near Houston, an explicit response to the BioSecure Act’s domestic-sourcing rules. Stainless-steel bioreactors up to 256,000 liters will position the state to absorb biosimilar demand once multiple blockbuster antibodies lose exclusivity in 2028. Puerto Rico preserves a niche in sterile injectables and solid-dose generics under favourable Section 936 successor incentives, though hurricane exposure and aging grids cap large-scale expansion. California’s Bay Area and San Diego clusters still drive early-stage outsourcing, but high real-estate costs and permitting delays push commercial volumes eastward. Midwest freight corridors then provide cost-effective logistics for nationwide distribution, shortening time-to-wholesaler by up to three days versus coastal routes.
Regulatory oversight varies by FDA district; facilities with repeat satisfactory inspections secure two-year scheduling buffers that let them redirect quality staff toward new technology validations. Sites in hurricane-prone or seismic zones must file additional business-continuity plans, adding weeks to pre-approval timelines and tipping sponsors toward regions with lower climate risk. State economic-development agencies sweeten bids through training grants and property-tax abatements, often covering up to 15% of a greenfield project’s total installed cost. As capacity builds, inter-regional competition now centers on utilities pricing, workforce depth, and the presence of nearby device-assembly partners that streamline combination-product launches.
Competitive Landscape
The five largest contractors Novo Nordisk (Catalent), Thermo Fisher, Lonza, Samsung Biologics, and FUJIFILM Diosynth held roughly 35% of 2025 revenue, confirming a moderately concentrated but still contestable field. Midsize specialists and regional fill-finish shops compete by offering faster turnaround, niche modalities, or superior FDA compliance records, keeping pricing discipline in check despite high entry barriers. Private-equity ownership remains active, with roll-up strategies targeting single-site operators that lack the capital to meet serialization and cybersecurity mandates. Overall, no single player controls enough share to dictate contract terms unilaterally, which sustains a buyer-friendly negotiating environment for sponsors with multi-sourcing strategies.
Strategic moves in 2024-2026 reshaped available capacity. Novo Nordisk’s USD 16.5 billion acquisition of Catalent removed roughly one-quarter of open-market injectable slots, forcing rivals to accelerate greenfield projects. Samsung Biologics broke ground on a USD 2.2 billion Texas campus slated for late-2027 launch, while Lonza committed USD 1 billion to expand its Pearland facility with CHO cell-line suites. Thermo Fisher’s USD 650 million Plainville viral-vector plant came online in January 2025, adding 2,000-liter lentiviral and AAV capacity. KBI Biopharma captured a USD 200 million monoclonal-antibody contract and is scaling 10,000-liter bioreactors in North Carolina, highlighting how proven inspection histories win commercial-scale mandates. National Resilience closed an USD 800 million round to finance modular cleanrooms that pivot across mRNA, viral vectors, and gene editing within weeks, challenging incumbents with multi-year construction cycles.[4]U.S. Patent and Trademark Office, “Bioreactor Patent Filings 2024-2025,” uspto.gov
Technology adoption now decides competitive distance. Single-use bioreactors, automated visual inspection, and real-time release testing cut batch-failure rates from 8% to 2% and trim two to three weeks from release cycles. Patent filings climbed, with Thermo Fisher and Lonza together submitting more than 20 U.S. applications in 2024-2025 for perfusion bioreactors and inline analytics. Workforce scarcity remains acute in radiopharmaceuticals, conferring pricing leverage on hot-cell operators certified in radiation safety. Cyber-insurance premiums jumped 40%-60% after high-profile ransomware incidents, raising the cost of compliance for midsize firms that lack redundant IT architectures. As biosimilar waves hit in 2027-2028, scale players will need speed and device-assembly expertise to defend margins against a deeper bench of low-cost competitors.
United States Pharmaceutical CMO Industry Leaders
Catalent Inc.
Thermo Fisher Scientific Inc. (Patheon)
Lonza Group AG
Pfizer CentreOne (Pfizer Inc.)
Baxter International Inc. (BioPharma Solutions)
- *Disclaimer: Major Players sorted in no particular order

Recent Industry Developments
- January 2026: Samsung Biologics confirmed concrete pour at its Texas site, keeping the USD 2.2 billion project on a late 2027 delivery track.
- December 2025: Avid Bioservices reported a 35% surge in virtual-biotech contracts, expanding upstream capacity in California.
- August 2025: Samsung Biologics began construction on a 256,000-liter stainless-steel facility in Texas targeted for monoclonal antibodies and biosimilars.
- July 2025: PCI Pharma Services opened a serialization-ready secondary-packaging line in Philadelphia.


United States Pharmaceutical CMO Market Report Scope
The United States Pharmaceutical CMO Market Report is Segmented by Service Type (API Manufacturing, FDF Development and Manufacturing, Secondary Packaging), Drug Molecule Type (Small Molecule, Biologics, Advanced Therapies), Scale of Operation (Clinical-Phase, Commercial-Scale), End User (Big Pharma, Generic Pharma, Emerging/Virtual Biotech, Specialty Pharma), Therapeutic Area (Oncology, Cardiovascular, CNS, Infectious Disease, Other), and Geography (United States). Market Forecasts are Provided in Terms of Value (USD).
By Service Type
| API Manufacturing | Small Molecule |
| Large Molecule | |
| High-Potency API (HPAPI) | |
| FDF Development and Manufacturing | Solid Dose |
| Liquid Dose | |
| Injectable Dose | |
| Secondary Packaging |
By Drug Molecule Type
| Small Molecule |
| Biologics |
| Advanced Therapies (Cell and Gene) |
By Scale of Operation
| Clinical-Phase Manufacturing |
| Commercial-Scale Manufacturing |
By End User
| Big Pharma |
| Generic Pharma |
| Emerging / Virtual Biotech |
| Specialty Pharma |
By Therapeutic Area
| Oncology |
| Cardiovascular |
| Central Nervous System (CNS) |
| Infectious Disease |
| Other Therapeutic Areas |
| By Service Type | API Manufacturing | Small Molecule |
| Large Molecule | ||
| High-Potency API (HPAPI) | ||
| FDF Development and Manufacturing | Solid Dose | |
| Liquid Dose | ||
| Injectable Dose | ||
| Secondary Packaging | ||
| By Drug Molecule Type | Small Molecule | |
| Biologics | ||
| Advanced Therapies (Cell and Gene) | ||
| By Scale of Operation | Clinical-Phase Manufacturing | |
| Commercial-Scale Manufacturing | ||
| By End User | Big Pharma | |
| Generic Pharma | ||
| Emerging / Virtual Biotech | ||
| Specialty Pharma | ||
| By Therapeutic Area | Oncology | |
| Cardiovascular | ||
| Central Nervous System (CNS) | ||
| Infectious Disease | ||
| Other Therapeutic Areas | ||


Key Questions Answered in the Report
What is the current value of the United States pharmaceutical CMO market?
It was valued at USD 55.91 billion in 2025 and is projected to reach USD 77.56 billion by 2031.
How fast is high-potency API manufacturing growing?
HPAPI suites are expanding at a 6.21% CAGR through 2031, the quickest pace among service types.
Which therapeutic area dominates outsourcing demand?
Oncology accounts for 28.41% of revenue and continues to attract the largest share of contracts.
Why are GLP-1 drugs affecting CMO capacity?
Explosive prescription growth has overbooked fill-finish lines, raising lead times and contract prices.
How does the BioSecure Act influence supplier selection?
The Act bars federal contractors from Chinese-linked manufacturers, redirecting billions to U.S. facilities and extending biologic booking queues.
Page last updated on:


