Market Overview
| Study Period | 2021 - 2031 |
|---|---|
| Forecast Data Period | 2026 - 2031 |
| Historical Data Period | 2021 - 2024 |
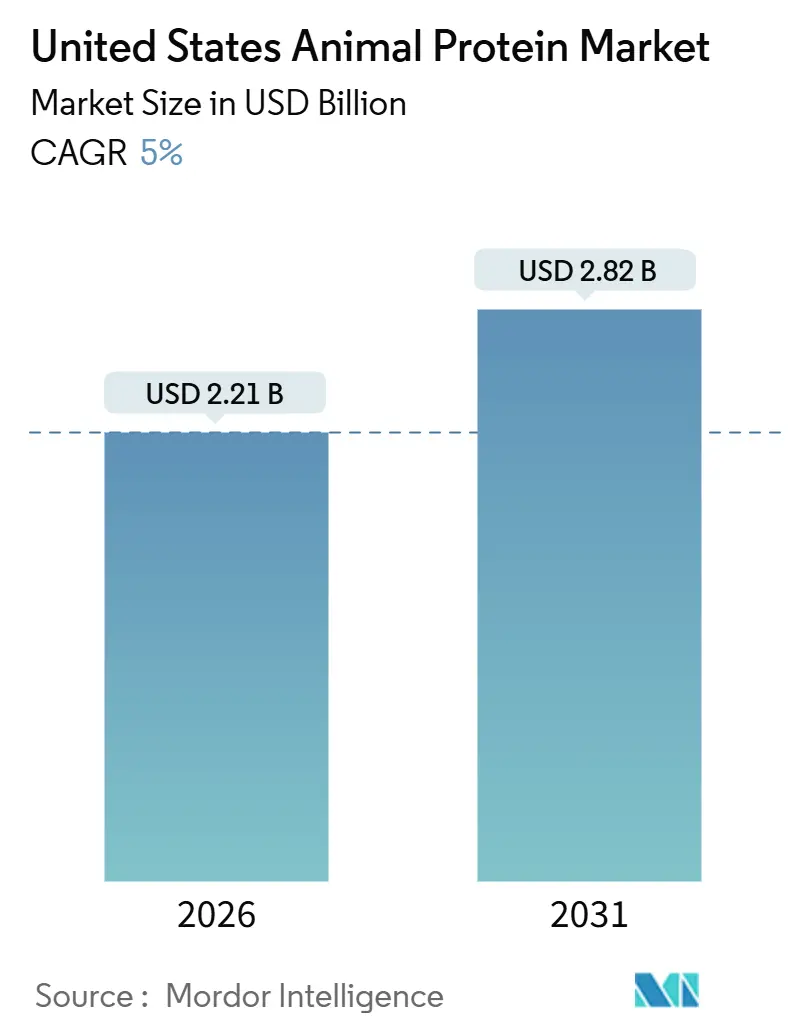
| Market Size (2026) | USD 2.21 Billion |
| Market Size (2031) | USD 2.82 Billion |
| Growth Rate (2026 - 2031) | 5.00% CAGR |
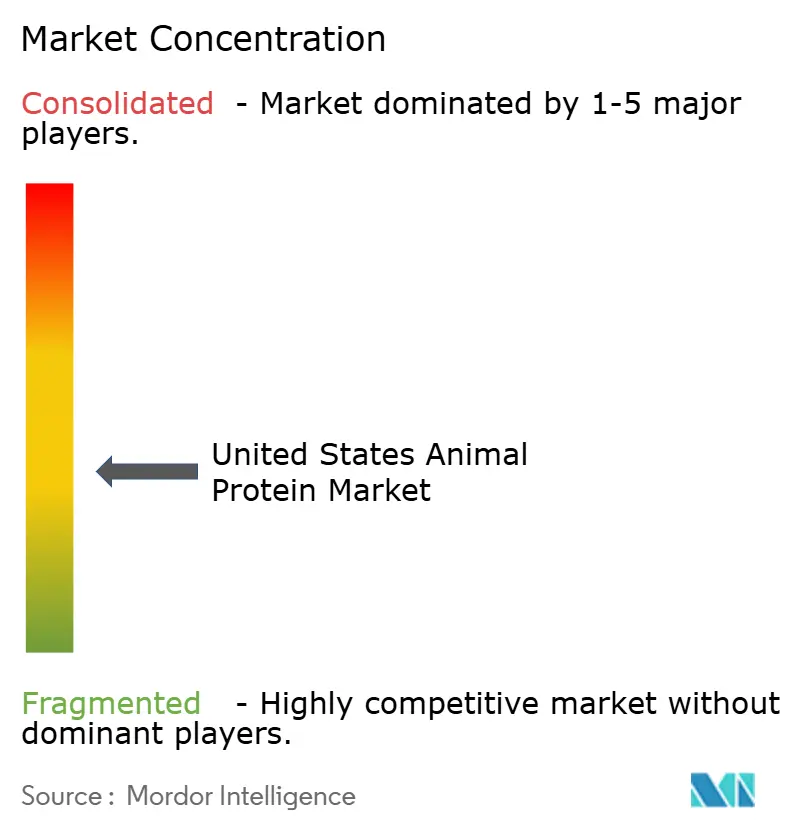
| Market Concentration | Medium |
Major Players*Disclaimer: Major Players sorted in no particular order Image © Mordor Intelligence. Reuse requires attribution under CC BY 4.0. |
|
United States Animal Protein Market Analysis by Mordor Intelligence
The United States animal protein market size stood at USD 2.21 billion in 2026 and is projected to reach USD 2.82 billion by 2031, advancing at a 5.0% CAGR. This growth highlights a market that is both evolving and maturing. Factors such as demographic changes, favorable regulations, and diversified applications are driving value growth, even as overall volume increases remain modest. The demand is increasingly focused on high-functionality ingredients, including whey protein isolate, hydrolyzed collagen, and purified milk-protein fractions, which integrate seamlessly into mainstream food and beverage products. Furthermore, sectors like sports-performance nutrition, medical foods, and premium pet-food reformulations are gaining momentum. These sectors not only consume more tonnage but also pay premiums for attributes like safety, traceability, and clean-label credentials. On the supply side, dairy cooperatives and rendering specialists are strengthening their vertical integration by adopting technologies such as membrane-filtration, enzymatic-hydrolysis, and anaerobic-digester systems. These advancements help mitigate risks from fluctuating raw-material costs and stricter environmental regulations. As a result, the United States animal protein market offers significant opportunities for processors capable of meeting emerging functionality demands while ensuring cost-efficient and lower-carbon production methods.
Key Report Takeaways
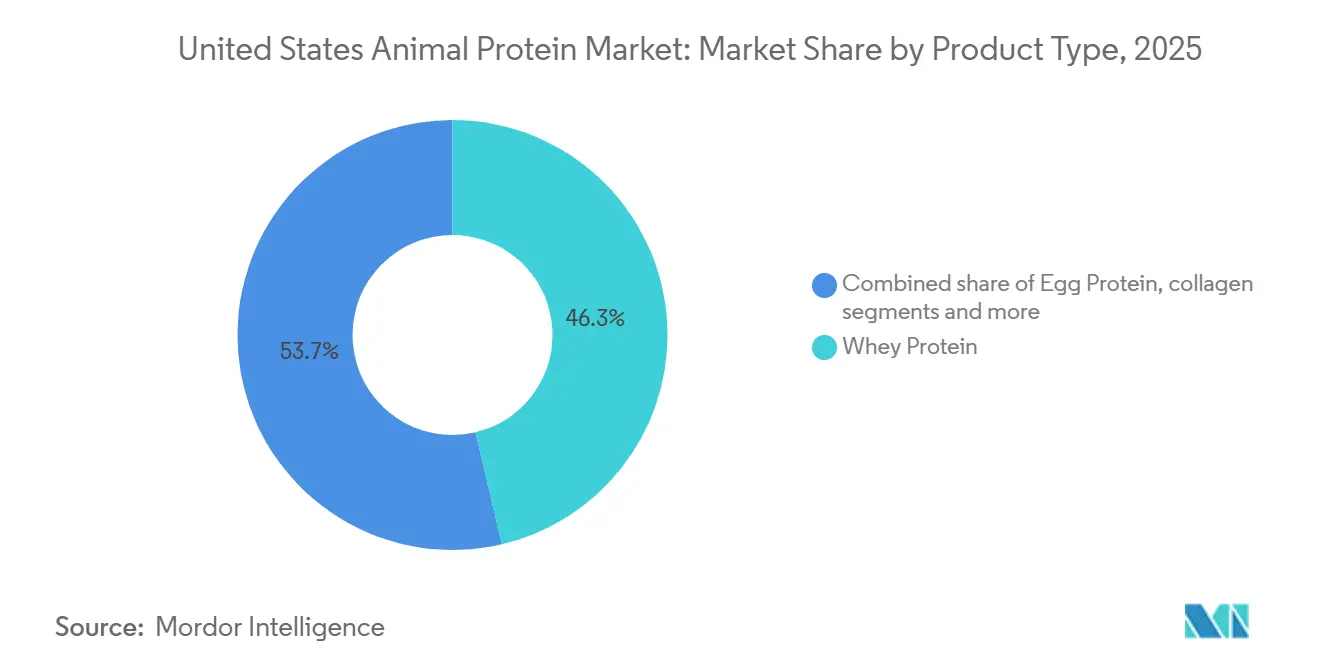
- By product type, whey protein held 46.32% of the United States animal protein market share in 2025, while insect protein is forecast to advance at a 5.95% CAGR through 2031.
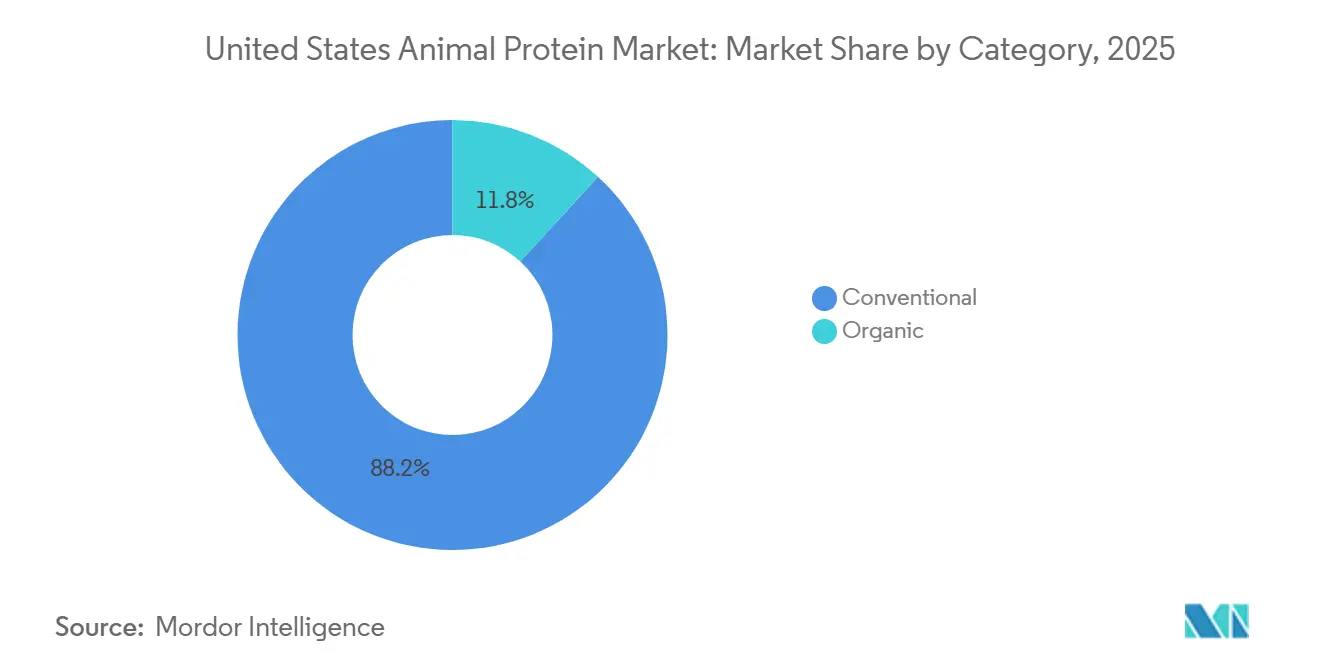
- By category, conventional formats commanded 88.17% of 2025 volume, whereas organic variants are set to grow at a 6.12% CAGR to 2031.
- By application, food and beverage led with a 47.85% contribution in 2025; supplements are projected to record the fastest expansion at 6.02% CAGR through 2031.
Note: Market size and forecast figures in this report are generated using Mordor Intelligence’s proprietary estimation framework, updated with the latest available data and insights as of 2026.
United States Animal Protein Market Trends and Insights
Drivers Impact Analysis*
| Driver | (~) % Impact on CAGR Forecast | Geographic Relevance | Impact Timeline |
|---|---|---|---|
| Growing demand for protein-fortified food and beverages | +1.2% | National, with concentration in urban centers and health-conscious demographics | Medium term (2-4 years) |
| Expansion of sports/performance nutrition | +1.0% | National, strongest in Sun Belt states and college-town markets | Short term (≤ 2 years) |
| Aging-linked medical nutrition uptake | +0.9% | National, with early adoption in Florida, Arizona, and retirement communities | Long term (≥ 4 years) |
| Premiumization of pet and livestock feed | +0.8% | National, led by coastal metro areas for pet food; Midwest for livestock feed | Medium term (2-4 years) |
| Product and technology innovation | +0.7% | National, concentrated in R and D hubs (California, Wisconsin, New York) | Medium term (2-4 years) |
| Sustainability and positioning responses | +0.4% | National, with regulatory pressure highest in California and Northeast states | Long term (≥ 4 years) |
| Source: Mordor Intelligence | |||


Growing demand for protein-fortified food and beverages
Protein fortification has shifted from being exclusive to sports nutrition to becoming a key feature in mainstream food and beverage categories. This change has been supported by the FDA's revised guidance on health claims for protein and muscle health, enabling brands to communicate these functional benefits more effectively. Ready-to-drink coffee beverages, breakfast cereals, and snack bars now frequently contain 10 to 20 grams of protein per serving. Whey protein isolate remains the preferred ingredient due to its neutral taste and compatibility with acidic systems. Dairy processors are responding to this demand by offering micro-particulated whey and native whey proteins, which provide clean-label declarations to meet consumer expectations for transparency in ingredient lists, particularly regarding additives and processing aids. Awareness of protein consumption among consumers has grown significantly. More Americans are not only incorporating protein into their diets but are also prioritizing increased intake, with numbers rising from 59% in 2022 to an anticipated 71% in 2024, according to the International Food Information Council[1]Source: International Food Information Council, "2024 IFIC Food & Health SURVEY IFIC", ific.org. . Furthermore, beverage manufacturers are utilizing collagen peptides in hydration products, leveraging emerging research on joint and skin health to appeal to active adults aged 35 to 55. This convergence of sports nutrition and wellness has created additional opportunities for animal-protein suppliers while reducing their reliance on traditional commodity whey powder sales.
Expansion of sports/performance nutrition
Sports nutrition has expanded its focus, now addressing the needs of not only bodybuilders and elite athletes but also recreational fitness enthusiasts, weekend warriors, and adolescents involved in competitive youth sports. With the growing participation in sports, the sports/performance nutrition market is witnessing substantial growth. In 2024, the Bureau of Labor Statistics indicated that 21.5% of the United States population participated daily in sports, exercise, and recreational activities[2]Source: Bureau of Labor Statistics, "American Time Use Survey", bls.gov.. Whey protein isolate and hydrolysate lead this segment due to their fast digestion and high leucine content, which are critical for muscle protein synthesis. Brands are differentiating themselves through third-party testing for banned substances, with certifications like NSF Certified for Sport and Informed-Choice becoming standard for products targeting collegiate and professional athletes. Egg-white protein is gaining popularity among consumers seeking dairy-free animal-based options, particularly within paleo and Whole30 communities. To meet this demand, several contract manufacturers have increased their spray-drying capacity for egg albumin. Furthermore, the segment's growth is driven by direct-to-consumer subscription models, which bypass traditional retail channels, allowing brands to achieve higher margins and provide customized protein blends tailored to individual activity levels and body composition.
Aging-linked medical nutrition uptake
With the growing awareness of sarcopenia and an aging population, the demand for high-protein medical foods is increasing. Physicians are prescribing oral nutritional supplements more frequently, particularly for patients recovering from surgery, managing chronic illnesses, or dealing with age-related muscle loss. According to the World Bank, 18% of the United States population aged 65 and older in 2024[3]Source: World Bank, "World Population Prospects", worldbank.org.. These formulations primarily use whey protein isolate and hydrolyzed collagen due to their rapid absorption and amino-acid profiles that support muscle maintenance. Medicare reimbursement policies for these supplements have remained consistent, ensuring a stable revenue stream for manufacturers. In response, several large dairy cooperatives have established medical-nutrition divisions to serve hospitals, long-term care facilities, and home health agencies. Additionally, collagen peptides are being incorporated into bone-health supplements targeting postmenopausal women. Clinical trials have demonstrated their effectiveness in improving bone mineral density when combined with calcium and vitamin D. This development represents a strategic shift for gelatin and collagen producers, who have traditionally focused on food and pharmaceutical capsules but are now capitalizing on higher-margin opportunities in nutraceuticals.
Premiumization of pet and livestock feed
Pet owners are increasingly treating their animals as family members, driving a shift toward premium pet food. This trend focuses on ingredient transparency, digestibility, and functional benefits. Packaging prominently highlights animal-protein sources such as chicken meal, egg protein, and marine collagen. Brands are enhancing their dry kibble formulations, raising crude-protein content from 24-26% to 30-35%. This reformulation is increasing demand for rendered poultry protein and egg-white powder. In response, several rendering companies are investing in dedicated pet-food production lines with improved food-safety protocols. Similarly, livestock feed is evolving as dairy and swine producers implement precision-nutrition strategies to optimize amino-acid profiles, improve feed conversion ratios, and reduce nitrogen excretion. Whey permeate and milk-protein concentrate are replacing less digestible vegetable proteins in calf milk replacers and weaning diets. Data from the USDA's National Animal Health Monitoring System shows that feed costs remain the largest variable expense for livestock operations. Therefore, even small improvements in feed efficiency, driven by higher-quality protein sources, can result in substantial cost savings over a production cycle.
Restraints Impact Analysis*
| Restraint | (~) % Impact on CAGR Forecast | Geographic Relevance | Impact Timeline |
|---|---|---|---|
| Dairy commodity price volatility | -0.6% | National, with acute effects in Wisconsin, California, and Idaho dairy regions | Short term (≤ 2 years) |
| Consumer shift toward plant proteins | -0.4% | National, strongest in coastal urban markets and among younger demographics | Medium term (2-4 years) |
| Environmental and climate pressures | -0.3% | National, with regulatory intensity highest in California and Northeast states | Long term (≥ 4 years) |
| Regulatory and compliance burdens | -0.2% | National, with disproportionate impact on smaller processors and new entrants | Medium term (2-4 years) |
| Source: Mordor Intelligence | |||
Dairy commodity price volatility
From 2024 to 2025, dairy commodity markets saw significant volatility. Class III milk prices, which serve as a benchmark for cheese and whey production, fluctuated by 32 percent. This volatility compressed margins for whey processors, who often operate on narrow spreads between raw milk costs and finished ingredient prices. Smaller processors, lacking robust hedging capabilities, faced heightened challenges. Some halted their drying capacity during periods of high milk prices, reducing whey protein concentrate availability and driving buyers to source imported alternatives from Europe and New Zealand. According to the USDA's Dairy Market News service, this volatility stemmed from weather disruptions in key dairy states, changing export demand from China, and labor shortages that constrained milk production. Forward contracting has become increasingly common, with ingredient buyers and processors entering six-to-twelve-month pricing agreements to stabilize cash flows. However, this approach limits processors' ability to take advantage of spot-market price increases. The uncertainty also influenced investment decisions. Projects such as new membrane-filtration lines or spray-drying towers require stable input costs to ensure viable payback periods. Consequently, some planned expansions have been postponed due to the ongoing instability.
Consumer shift toward plant proteins
Although the adoption of plant-based proteins has slowed from its peak, it continues to create significant competition for animal-protein ingredients, particularly in retail protein powders, ready-to-drink shakes, and meat alternatives. To address this, brands are increasingly adopting hybrid formulations that combine traditional proteins like whey or collagen with plant-based options such as pea, oat, or rice protein. These formulations aim to balance cost, functionality, and shifting consumer preferences. Typically, hybrids consist of 30 to 50 percent animal protein, which reduces the per-unit demand for whey isolate or egg albumin. This trend is especially prominent among millennials and Gen Z consumers, who prioritize environmental and ethical considerations in their purchasing decisions. As these demographics gain purchasing power, they present a growing challenge for products that rely solely on animal proteins. However, the plant-protein sector continues to face obstacles, including issues with taste, texture, and digestibility. Some leading brands have either reformulated their products or exited the market entirely, indicating that the substitution threat may be stabilizing rather than accelerating.
*Our forecasts treat driver/restraint impacts as directional, not additive. The impact forecasts reflect baseline growth, mix effects, and variable interactions.
Segment Analysis
By Product Type: Whey Dominance Anchors Volume, Insect Protein Signals Diversification
In 2025, whey protein accounted for 46.32 percent of the product-type volume, driven by its established role in sports nutrition, clinical formulations, and bakery applications, where its emulsification and foaming properties are challenging to replicate. Dairy cooperatives in Wisconsin, Idaho, and California have increased membrane-filtration capacities to produce whey protein isolates with protein content exceeding 90 percent. Milk protein, which includes caseinates, milk protein concentrates, and isolates, is utilized in infant formulas, cheese analogs, and high-protein beverages, benefiting from casein's ability to provide a sustained release of amino acids. Collagen and gelatin serve the personal care, pharmaceutical capsule, and nutraceutical markets. Type I collagen peptides are gaining popularity in skin-health supplements, while Type II collagen is preferred for joint support. Egg protein appeals to paleo and dairy-free consumers, prompting several contract manufacturers to establish spray-drying lines dedicated to egg albumin. Casein and caseinates are valued in coffee creamers and processed cheese for their heat stability and emulsifying properties, though their volumes have plateaued as plant-based creamers increasingly dominate this application.
In 2025, insect protein held a small market share but is projected to grow at an annual rate of 5.95 percent through 2031. This growth is fueled by the FDA's gradual approvals for cricket, mealworm, and black soldier fly larvae in pet food and aquaculture feed. Enterra Feed Corporation operates a commercial-scale black soldier fly facility in British Columbia, supplying United States pet-food brands, and announced plans in early 2025 to establish a second facility in the southern United States to cater to poultry and swine feed markets. Insect protein's appeal lies in its low land and water requirements compared to conventional animal proteins. Life-cycle assessments show that black soldier fly production generates 80 percent fewer greenhouse gas emissions than fishmeal on a per-kilogram-of-protein basis. Regulatory momentum is increasing, with the Association of American Feed Control Officials updating ingredient definitions to include insect meals, and several state feed-control officials granting provisional approvals pending federal harmonization. Early adopters in the pet-food industry are using insect protein as a differentiation strategy, prominently featuring it on labels to attract environmentally conscious consumers. This positioning is expected to support premium pricing even as production scales up.


By Category: Conventional Scale Meets Organic's Premium Trajectory
In 2025, conventional animal proteins represented 88.17 percent of the category's volume, highlighting the dominance of large-scale dairy cooperatives, renderers, and egg processors. These organizations supply both commodity and value-added ingredients while benefiting from economies of scale in procurement, processing, and distribution. Their vertically integrated structures enable them to secure margins across the value chain. For instance, conventional whey protein concentrate is manufactured in multi-ton batches using standardized membrane-filtration and spray-drying techniques, ensuring consistent functional properties that meet industrial buyer requirements. Although the category faces challenges such as mature penetration in core applications and competition from plant proteins, incremental demand from medical nutrition and premium pet food is driving modest volume growth. To protect margins, processors are adopting automation and energy-efficient practices. Many have also implemented cogeneration systems that convert biogas from anaerobic digesters into electricity and process heat, reducing operating costs.
Organic animal proteins, which accounted for 11.83 percent of the volume in 2025, are projected to grow at an annual rate of 6.12 percent through 2031. This growth is driven by retailer requirements for organic SKUs and consumers' willingness to pay a 20 to 40 percent premium for USDA-certified ingredients. Organic egg protein and collagen are emerging as key categories, with several small-scale producers pursuing USDA organic certification to access premium markets. However, the organic segment faces structural challenges, including higher feed costs for organic livestock, limited availability of organic processing co-packers, and the administrative burden of annual USDA audits. Despite these obstacles, demographic trends are favorable. Millennials and Gen Z, who prioritize organic certifications, are entering their peak earning years. Their increasing purchasing power is expected to sustain demand growth. Additionally, retailers are expanding their organic private-label offerings, creating opportunities for mid-sized processors to supply store brands and capture additional volume.
By Application: Food and Beverage Anchors Demand, Supplements Drive Margin
In 2025, food and beverage applications utilized 47.85 percent of the animal-protein volume, covering a wide array of products such as bakery goods, beverages, breakfast cereals, condiments, confectionery, dairy alternatives, and ready-to-eat meals. Whey protein isolate emerged as a key ingredient in this segment due to its neutral flavor, solubility, and ability to increase protein content without affecting texture. In bakery applications, whey improves dough handling and extends shelf life through its water-binding and emulsification properties. Beverage manufacturers use whey isolate in protein-enriched juices, smoothies, and coffee drinks. Collagen peptides are gaining traction in functional beverages aimed at improving skin and joint health. Several brands have introduced ready-to-drink collagen waters and sparkling beverages to attract beauty-conscious consumers. Egg protein is finding specialized use in gluten-free baking and meringue, while caseinates are critical in coffee creamers and processed cheese for their heat stability. Although the food and beverage segment faces competition from plant proteins and price-sensitive consumers, premiumization trends and the adoption of functional ingredients are driving value growth, even as volume growth slows.
Supplements, while representing a smaller market share in 2025, are expected to grow at an annual rate of 6.02 percent through 2031. This growth is driven by an aging population, the expansion of sports nutrition, and direct-to-consumer models that deliver higher margins. Whey protein isolate and hydrolysate dominate this segment, with brands differentiating themselves through flavor innovations, third-party testing, and personalized formulations tailored to activity levels and body composition. Egg-white protein is gaining popularity among dairy-free consumers, and insect protein is beginning to appear in sustainability-focused supplement brands, though consumer acceptance remains limited. The supplement market's appeal lies in its premium pricing, retail protein powders are priced between USD 30 and USD 60 per kilogram on a protein-equivalent basis, far exceeding ingredient costs. Additionally, brands effectively communicate functional benefits directly to consumers through digital marketing and influencer partnerships.
Geography Analysis
Production and consumption patterns in the United States. depend on raw-material availability, consumer demographics, and regulatory climates. In dairy-rich states like Wisconsin, California, and Idaho, dense milk sheds and established cheese plants drive whey-protein production. California's strict water-use and methane-capture mandates, while increasing capital requirements, encourage innovation in anaerobic digesters. These digesters produce renewable natural gas and qualify for federal tax credits. The Midwest, with its proximity to feed-grain baskets, houses most rendering assets. These assets process poultry and pork into proteins for pet food and livestock feed, benefiting from lower inbound freight costs.
Demand trends show that coastal metro areas lead in premium pet-food and collagen-beverage consumption, reflecting higher disposable incomes and wellness preferences. Sun Belt states and Big Ten college towns dominate sports nutrition demand, driven by athletic department purchases and a high density of fitness clubs. Florida and Arizona, known for their retirement communities, have become key markets for medical nutrition. Hospital systems in these states procure whey-isolate-based oral supplements through group purchasing contracts. Meanwhile, rural feed-mill regions in the Upper Midwest and Southeast leverage local supply loops to absorb livestock-feed proteins, reducing feed costs and addressing nitrogen runoff concerns.
Logistics operations align with these production and consumption patterns. Refrigerated tanker trucks transport liquid whey from cheese plants to nearby concentration towers, while dry bulk trailers deliver spray-dried isolates to blending facilities, primarily located near East Coast population centers. Collagen imports from Latin America are unloaded at Gulf ports and transferred by rail to Midwestern nutraceutical plants, showcasing the complex multimodal logistics supporting national supply resilience. Additionally, integration with Canadian dairy pools helps offset United States milk flow disruptions caused by heat stress or drought, highlighting the broad sourcing strategies within the United States animal protein market.
Competitive Landscape
The United States animal protein market exhibits moderate fragmentation, with the top five players—Glanbia Plc, Fonterra Co-operative Group Limited, Kerry Group Plc, Arla Foods amba, and Darling Ingredients Inc. collectively holding a significant share of whey and milk protein volume, while the rendering and collagen segments remain more fragmented across regional specialists like Darling Ingredients and Tyson Foods. Companies rely on strategies such as vertical integration, application-specific innovation, and geographic diversification to manage input-cost volatility and regulatory challenges. Dairy cooperatives utilize farmer-ownership structures to maintain a steady milk supply at predictable costs. Many have also adopted on-farm anaerobic digesters and renewable-energy systems to meet sustainability targets and qualify for carbon-credit programs. Rendering companies are shifting their focus toward higher-margin collagen and gelatin markets for nutraceuticals and cosmetics, moving away from commodity protein meals where plant-based alternatives have reduced pricing power. Insect-protein companies like Enterra are pursuing vertical integration, covering feedstock aggregation to processing, to replicate the cost efficiencies achieved by established animal-protein producers.
In the United States. animal protein market, companies are emphasizing product innovation, particularly in developing specialized protein ingredients for specific applications. Significant investments are being directed toward expanding production capabilities, including constructing new facilities and upgrading existing plants to meet the rising demand for animal protein. Operational flexibility has become critical, with manufacturers implementing advanced ERP systems and quality tracking tools to ensure consistent product quality and efficient supply chains. Strategic partnerships between protein manufacturers and food companies have emerged as a key trend, enhancing market presence and distribution networks. Geographic expansion is also a priority, with companies establishing regional warehouses and distribution centers to better serve local markets and reduce delivery times. The focus on sustainable and clean-label products has driven research and development efforts, resulting in the introduction of grass-fed, organic, and specialized protein variants.
Emerging opportunities are centered on hybrid protein formulations, novel applications in personal care, and precision nutrition for medical and sports sectors. Many processors are collaborating with food-tech startups to create animal-plant protein blends that balance functionality, cost, and sustainability. These hybrids are gaining popularity among plant-forward brands seeking to improve texture and nutritional profiles. Collagen peptides are becoming a prominent application in topical cosmetics, supported by clinical evidence that oral and topical collagen can work together to enhance skin hydration and elasticity. Technology adoption is accelerating, with advancements such as membrane-filtration upgrades, enzymatic-hydrolysis optimization, and real-time quality-control systems. These technologies enable processors to produce high-purity fractions and quickly adapt to customer requirements. Patent filings from 2025 indicate a focus on bioactive peptide isolation, microencapsulation for controlled release, and fermentation-derived collagen. This collagen replicates animal-derived structures without relying on livestock, signaling that industry leaders are preparing for potential long-term substitution risks.
United States Animal Protein Industry Leaders
-
Arla Foods amba
-
Darling Ingredients Inc.
-
Fonterra Co-operative Group Limited
-
Glanbia PLC
-
Kerry Group PLC
- *Disclaimer: Major Players sorted in no particular order

Recent Industry Developments
- July 2025: Lactalis USA invested USD 75 million to expand and modernize its dairy processing plants in Buffalo and Walton, New York, as part of its strategy to strengthen United States operations. This initiative aims to address the growing demand for high-protein dairy products while improving operational efficiency and fostering innovation.
- April 2025: Actus Nutrition has acquired a whey protein production facility from Foremost Farms USA in Sparta, Wisconsin. This facility produces micellar casein and milk protein concentrates, enhancing Actus Nutrition's portfolio of specialty dairy ingredients designed for sports nutrition and functional food applications.
- March 2025: Arla Foods Ingredients has entered into a contract manufacturing agreement with Valley Queen, enhancing its ability to address the increasing demand for protein-enriched dairy products in the United States.


United States Animal Protein Market Report Scope
Animal protein refers to proteins obtained from natural sources, including meat, eggs, milk, fish, and insects, which are widely used in various industries. The United States animal protein market is segmented based on the protein type, category, and application. Based on protein type, the market is segmented into casein and caseinates, collagen, egg protein, gelatin, insect protein, milk protein, whey protein, and other animal protein. Based on category, the market is segmented into conventional and organic. Based on the application, the market is segmented into animal feed, personal care and cosmetics, food and beverages, and supplements. The food and beverages segment is further segmented into bakery, beverages, breakfast cereals, condiments/sauces, confectionery, dairy and dairy alternative products, RTE/RTC food products, and others. The report provides market size and forecasts in both value (USD) and volume (tons) for all the mentioned segments.
By Product Type
| Casein and Caseinates |
| Collagen |
| Egg Protein |
| Gelatin |
| Insect Protein |
| Milk Protein |
| Whey Protein |
| Other Animal Protein |
By Category
| Conventional |
| Organic |
By Application
| Animal Feed | |
| Personal Care and Cosmetics | |
| Food and Beverages | Bakery |
| Beverages | |
| Breakfast Cereals | |
| Condiments/Sauces | |
| Confectionery | |
| Dairy and Dairy Alternatives Products | |
| RTE/RTC Food Products | |
| Others | |
| Supplements |
| By Product Type | Casein and Caseinates | |
| Collagen | ||
| Egg Protein | ||
| Gelatin | ||
| Insect Protein | ||
| Milk Protein | ||
| Whey Protein | ||
| Other Animal Protein | ||
| By Category | Conventional | |
| Organic | ||
| By Application | Animal Feed | |
| Personal Care and Cosmetics | ||
| Food and Beverages | Bakery | |
| Beverages | ||
| Breakfast Cereals | ||
| Condiments/Sauces | ||
| Confectionery | ||
| Dairy and Dairy Alternatives Products | ||
| RTE/RTC Food Products | ||
| Others | ||
| Supplements | ||


Market Definition
- End User - The Protein Ingredients Market operates on a B2B basis. Food, Beverages, Supplements, Animal Feed, and Personal Care & Cosmetic manufacturers are considered to be end-consumers in the market studied. The scope excludes manufacturers buying liquid/dry whey to be used for application as a binding agent or thickener or other non-protein applications.
- Penetration Rate - Penetration Rate is defined as the percentage of Protein-Fortified End User Market Volume in the Overall End User Market Volume.
- Average Protein Content - Average protein content is the average protein content present per 100 g of product manufactured by all end-user companies considered under the scope of this report.
- End User Market Volume - End-user market volume is the consolidated volume of all types and forms of end-user products in the country or region.
| Keyword | Definition |
|---|---|
| Alpha-lactalbumin (α-Lactalbumin) | It is a protein that regulates the production of lactose in the milk of almost all mammalian species. |
| Amino acid | It is an organic compound that contains both amino and carboxylic acid functional groups, which are required for the synthesis of body protein and other important nitrogen-containing compounds, such as creatine, peptide hormones, and some neurotransmitters. |
| Blanching | It is the process of briefly heating vegetables with steam or boiling water. |
| BRC | British Retail Consortium |
| Bread improver | It is a flour-based blend of several components with specific functional properties designed to modify dough characteristics and give quality attributes to bread. |
| BSF | Black Soldier Fly |
| Caseinate | It is a substance produced by adding an alkali to acid casein, a derivative of casein. |
| Celiac disease | Celiac disease is an immune reaction to eating gluten, a protein found in wheat, barley, and rye. |
| Colostrum | It is a milky fluid that’s released by mammals that have recently given birth before breast milk production begins. |
| Concentrate | It is the least processed form of protein and has a protein content ranging from 40-90% by weight. |
| Dry protein basis | It refers to the percentage of "pure protein" present in a supplement after the water in it is completely removed through heat. |
| Dry whey | It is the product resulting from drying fresh whey which has been pasteurized and to which nothing has been added as a preservative. |
| Egg protein | It is a mixture of individual proteins, including ovalbumin, ovomucoid, ovoglobulin, conalbumin, vitellin, and vitellenin. |
| Emulsifier | It is a food additive that facilitates the blending of foods that are immiscible with one another, such as oil and water. |
| Enrichment | It is the process of addition of micronutrients that are lost during the processing of the product. |
| ERS | Economic Research Service of the USDA |
| Extrusion | It is the process of forcing soft mixed ingredients through an opening in a perforated plate or die designed to produce the required shape. The extruded food is then cut to a specific size by blades. |
| Fava | Also known as Faba, it is another word for yellow split beans. |
| FDA | Food and Drug Administration |
| Flaking | It is a process in which typically a cereal grain (like corn, wheat, or rice) is broken down into grits, cooked with flavors and syrups, and then pressed into flakes between cooled rollers. |
| Foaming agent | It is a food ingredient that makes it possible to form or maintain a uniform dispersion of a gaseous phase in a liquid or solid food. |
| Foodservice | It refers to the part of the food industry which includes businesses, institutions, and companies which prepare meals outside the home. It includes restaurants, school and hospital cafeterias, catering operations, and many other formats. |
| Fortification | It is the deliberate addition of micronutrients that are not found in them naturally or which are lost during processing, to improve a food product's nutritional value. |
| FSANZ | Food Standards Australia New Zealand |
| FSIS | Food Safety and Inspection Service |
| FSSAI | Food Safety and Standards Authority of India |
| Gelling agent | It is an ingredient that functions as a stabilizer and thickener to provide thickening without stiffness through the formation of gel. |
| GHG | Greenhouse Gas |
| Gluten | It is a family of proteins found in grains, including wheat, rye, spelt, and barley. |
| Hemp | It is a botanical class of Cannabis sativa cultivars grown specifically for industrial or medicinal use. |
| Hydrolysate | It is a form of protein manufactured by exposing the protein to enzymes that can partially break the bonds between the protein's amino acids and break down large, complicated proteins into smaller pieces. Its processing makes it easier and quicker to digest. |
| Hypoallergenic | It refers to a substance that causes fewer allergic reactions. |
| Isolate | It is the purest and most processed form of protein which has undergone separation to obtain a pure protein fraction. It typically contains ≥ 90% of protein by weight. |
| Keratin | It is a protein that helps form hair, nails, and the outer layer of skin. |
| Lactalbumin | It is the albumin contained in milk and obtained from whey. |
| Lactoferrin | It is an iron‑binding glycoprotein that is present in the milk of most mammals. |
| Lupin | It is the yellow legume seeds of the genus Lupinus. |
| Millenial | Also known as Generation Y or Gen Y, it refers to the people born from 1981 to 1996. |
| Monogastric | It refers to an animal with a single-compartmented stomach. Examples of monogastric include humans, poultry, pigs, horses, rabbits, dogs, and cats. Most monogastric are generally unable to digest much cellulose food materials such as grasses. |
| MPC | Milk protein concentrate |
| MPI | Milk protein isolate |
| MSPI | Methylated soy protein isolate |
| Mycoprotein | Mycoprotein is a form of single-cell protein, also known as fungal protein, derived from fungi for human consumption. |
| Nutricosmetics | It is a category of products and ingredients that act as nutritional supplements to care for skin, nails, and hair natural beauty. |
| Osteoporosis | It is a medical condition in which the bones become brittle and fragile from loss of tissue, typically as a result of hormonal changes, or deficiency of calcium or vitamin D. |
| PDCAAS | Protein digestibility-corrected amino acid score (PDCAAS) is a method of evaluating the quality of a protein based on both the amino acid requirements of humans and their ability to digest it. |
| Per-capita consumption of animal protein | It is the average amount of animal protein (such as milk, whey, gelatin, collagen, and egg proteins) that is readily available for consumption by each person in an actual population. |
| Per-capita consumption of plant protein | It is the average amount of plant protein (such as soy, wheat, pea, oat, and hemp proteins) that is readily available for consumption by each person in an actual population. |
| Quorn | It is a microbial protein manufactured using mycoprotein as an ingredient, in which the fungus culture is dried and mixed with egg albumen or potato protein, which acts as a binder, and then is adjusted in texture and pressed into various forms. |
| Ready-to-Cook (RTC) | It refers to food products that include all of the ingredients, where some preparation or cooking is required through a process that is given on the package. |
| Ready-to-Eat (RTE) | It refers to a food product prepared or cooked in advance, with no further cooking or preparation required before being eaten. |
| RTD | Ready-to-Drink |
| RTS | Ready-to-Serve |
| Saturated fat | It is a type of fat in which the fatty acid chains have all single bonds. It is generally considered unhealthy. |
| Sausage | It is a meat product made of finely chopped and seasoned meat, which may be fresh, smoked, or pickled and which is then usually stuffed into a casing. |
| Seitan | It is a plant-based meat substitute made out of wheat gluten. |
| Softgel | It is a gelatin-based capsule with a liquid fill. |
| SPC | Soy protein concentrate |
| SPI | Soy protein isolate |
| Spirulina | It is a biomass of cyanobacteria that can be consumed by humans and animals. |
| Stabilizer | It is an ingredient added to food products to help maintain or enhance their original texture, and physical and chemical characteristics. |
| Supplementation | It is the consumption or provision of concentrated sources of nutrients or other substances that are intended to supplement nutrients in the diet and is intended to correct nutritional deficiencies. |
| Texturant | It is a specific type of food ingredient that is used to control and alter the mouthfeel and texture of food and beverage products. |
| Thickener | It is an ingredient that is used to increase the viscosity of a liquid or dough and make it thicker, without substantially changing its other properties. |
| Trans fat | Also called trans-unsaturated fatty acids or trans fatty acids, it is a type of unsaturated fat that naturally occurs in small amounts in meat. |
| TSP | Textured soy protein |
| TVP | Textured vegetable protein |
| WPC | Whey protein concentrate |
| WPI | Whey protein isolate |


Research Methodology
Mordor Intelligence follows a four-step methodology in all our reports.
- Step-1: Identify Key Variables: The quantifiable key variables (industry and extraneous) pertaining to the specific product segment and country are selected from a group of relevant variables & factors based on desk research & literature review; along with primary expert inputs. These variables are further confirmed through regression modeling (wherever required).
- Step-2: Build a Market Model: In order to build a robust forecasting methodology, the variables and factors identified in Step-1 are tested against available historical market numbers. Through an iterative process, the variables required for market forecast are set and the model is built on the basis of these variables.
- Step-3: Validate and Finalize: In this important step, all market numbers, variables and analyst calls are validated through an extensive network of primary research experts from the market studied. The respondents are selected across levels and functions to generate a holistic picture of the market studied.
- Step-4: Research Outputs: Syndicated Reports, Custom Consulting Assignments, Databases & Subscription Platforms


