Market Overview
| Study Period | 2021 - 2031 |
|---|---|
| Forecast Data Period | 2026 - 2031 |
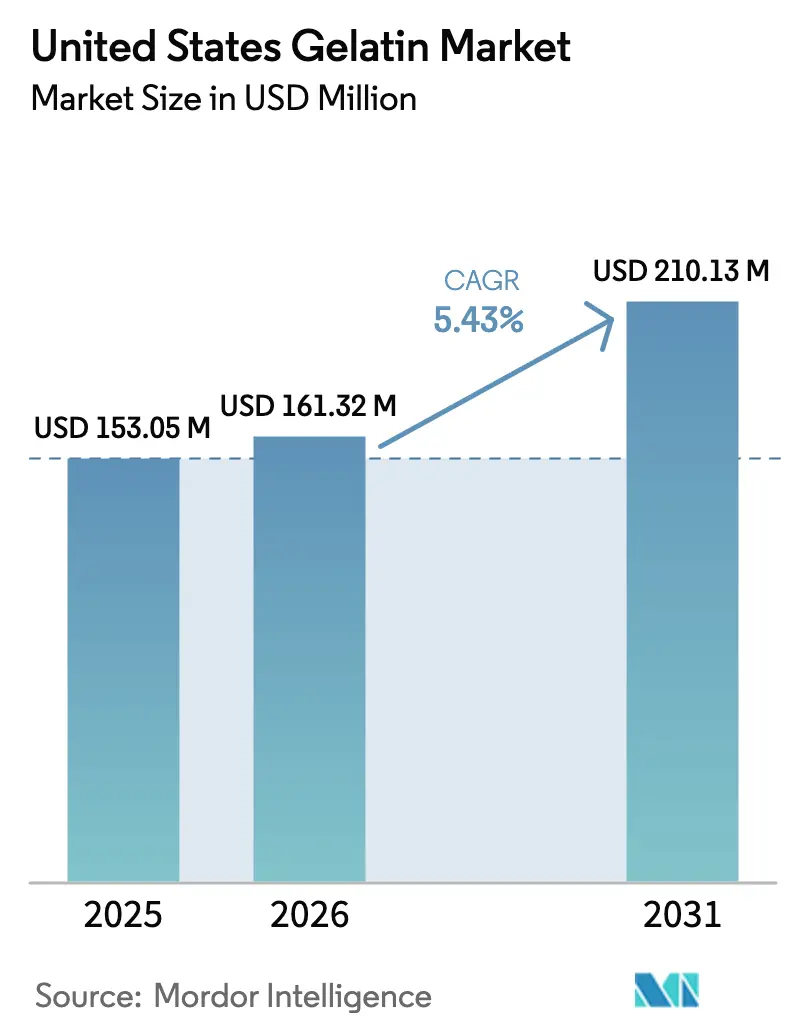
| Base Year Market Size (2025) | USD 153.05 Million |
| Market Size (2026) | USD 161.32 Million |
| Market Size (2031) | USD 210.13 Million |
| Growth Rate (2026 - 2031) | 5.43% CAGR |
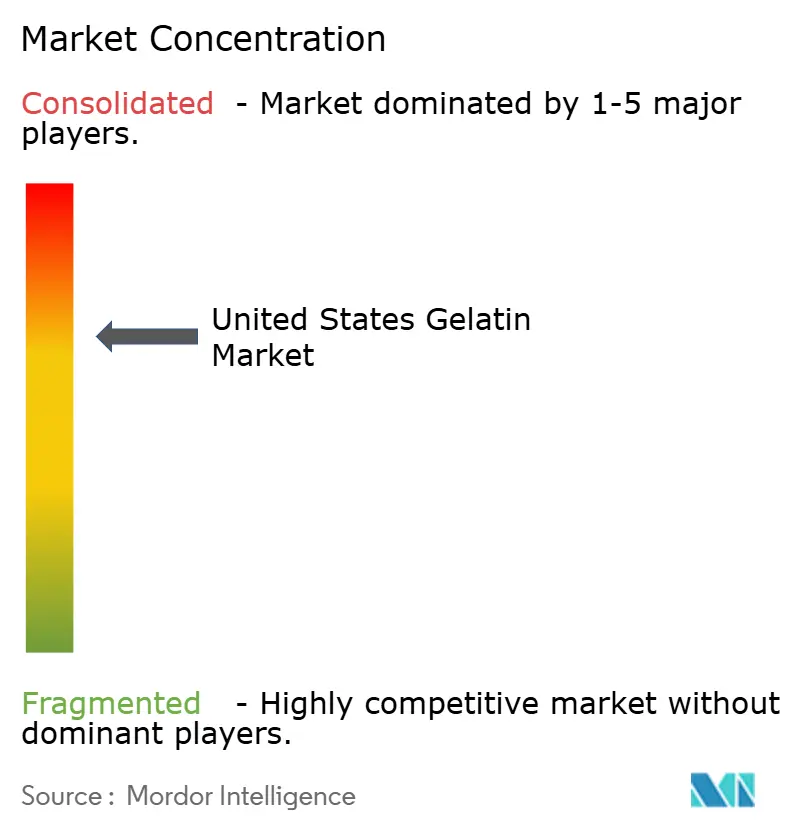
| Market Concentration | Medium |
Major Players *Disclaimer: Major Players sorted in no particular order Image © Mordor Intelligence. Reuse requires attribution under CC BY 4.0. | |
United States Gelatin Market Analysis by Mordor Intelligence
The United States gelatin market size is expected to grow from USD 153.05 million in 2025 to USD 161.32 million in 2026 and is forecast to reach USD 210.13 million by 2031 at 5.43% CAGR over 2026-2031. Rising demand for functional food, nutraceutical, and clean-label ingredients continues to anchor the United States gelatin market, while premium personal-care and pharmaceutical applications unlock higher margins. Animal-based grades still dominate because of entrenched supply chains and superior gel strength, yet marine alternatives are growing as halal, kosher, and pescatarian consumers seek certified sources. Capacity investments and joint-venture activity are reshaping the competitive field, and technology upgrades in enzymatic hydrolysis are shortening processing cycles and boosting yields. At the same time, raw-material volatility, tariffs, and compliance expenses pressure profitability and accelerate the search for diversified feedstocks.
Key Report Takeaways
- By form, animal-based gelatin held 94.21% of the United States gelatin market share in 2025, while marine-based grades are forecast to expand at a 7.23% CAGR through 2031.
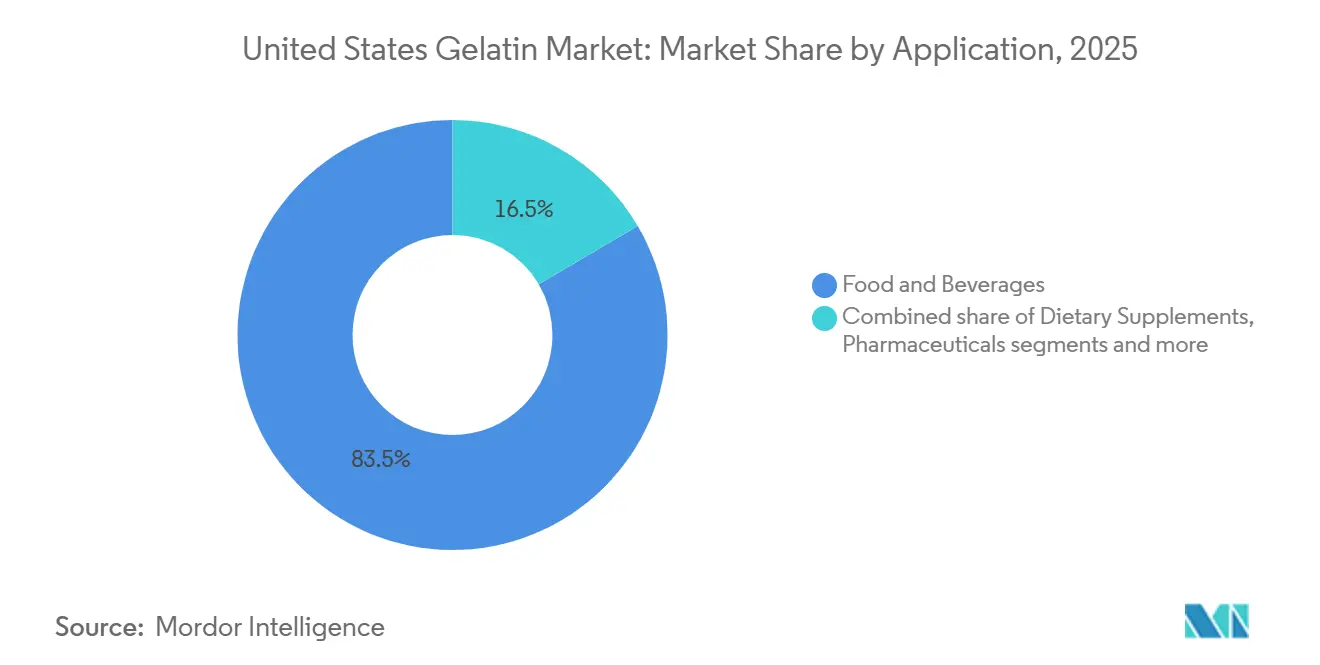
- By application, food and beverages commanded 83.46% revenue in 2025, whereas personal care and cosmetics are advancing at a 6.79% CAGR to 2031.
Note: Market size and forecast figures in this report are generated using Mordor Intelligence’s proprietary estimation framework, updated with the latest available data and insights as of January 2026.
United States Gelatin Market Trends and Insights
Drivers Impact Analysis*
| Driver | (~) % Impact on CAGR Forecast | Geographic Relevance | Impact Timeline |
|---|---|---|---|
| Rising demand for functional and nutraceutical products | +1.2% | United States (national, with concentration in health-conscious urban markets) | Medium term (2-4 years) |
| Increasing consumer preference for natural and clean-label ingredients | +1.0% | United States (national, strongest in coastal and metropolitan areas) | Short term (≤ 2 years) |
| Expansion of cosmetics and personal care products using gelatin | +0.8% | United States (national, led by premium beauty segments) | Medium term (2-4 years) |
| Technological advancements in extraction and processing | +0.6% | United States (manufacturing hubs in Midwest, California) | Long term (≥ 4 years) |
| Functional benefits in food & beverages | +0.9% | United States (national, driven by confectionery and dairy applications) | Short term (≤ 2 years) |
| Increasing investment in gelatin production capacity and innovation | +0.7% | United States (Midwest production corridors, coastal marine gelatin facilities) | Medium term (2-4 years) |
| Source: Mordor Intelligence | |||


Rising demand for functional and nutraceutical products
Rising demand for functional and nutraceutical products is a key driver of the United States gelatin market, supported by growing consumer focus on health, wellness, and preventive nutrition. Gelatin is widely used in dietary supplements, functional foods, and pharmaceutical capsules due to its high protein content, digestibility, and functional properties. This trend is reinforced by the 2025 IFIC Protein Perceptions Spotlight Survey, which found that 8 in 10 Americans prioritize protein intake during at least one eating occasion daily, signaling strong demand for protein-rich ingredients[1]Source: International Food Information Council, “Americans Perception of Proteins”, ific.org. As consumers increasingly seek products that support joint health, skin health, muscle maintenance, and satiety, gelatin continues to gain traction as a preferred nutraceutical ingredient. Additionally, expanding use of gelatin in gummies, soft capsules, and fortified foods is accelerating demand across both food and pharmaceutical nutraceutical segments.
Increasing consumer preference for natural and clean-label ingredients
Clean-label reformulation is accelerating, with food and nutraceutical brands replacing synthetic stabilizers and emulsifiers with gelatin, which is perceived as a natural, single-ingredient solution. Gelatin’s regulatory positioning further strengthens its adoption, as it is recognized by the FDA as Generally Recognized as Safe (GRAS) under 21 CFR 184.1550, providing manufacturers with regulatory clarity[2]Source: United States Food and Drug Administration, “Substances Added to Food”, hfpappexternal.fda.gov. Its inherent protein content and exclusion from major allergen lists also support front-of-pack nutrition and “free-from” claims. This shift is reinforced by consumer behavior data, as the 2024 IFIC Food & Health Survey indicates that 36% of U.S. consumers prioritize foods labeled “Natural,” “Organic,” or “Healthy” during in-store purchases[3]Source: International Food Information Council, “2024 IFIC Food & Health SURVEY”, ific.org. Collectively, these factors position gelatin as a preferred ingredient for clean-label foods, beverages, supplements, and functional products.
Expansion of cosmetics and personal care products using gelatin
Expansion of cosmetics and personal care products using gelatin is an important driver of the United States gelatin market, supported by rising demand for natural and functional beauty ingredients. Gelatin is widely used in skincare, haircare, and nail-care formulations due to its film-forming properties, moisture retention, and protein content that supports skin elasticity and hair strength. Its compatibility with clean-label and naturally derived product positioning aligns well with growing consumer preference for transparent and sustainable beauty formulations. Additionally, gelatin and collagen-based ingredients are increasingly incorporated into anti-aging, skin-firming, and repair-focused products. The rise of “beauty-from-within” trends, including ingestible beauty supplements, further reinforces gelatin demand across cosmetic applications.
Technological advancements in extraction and processing
Technological advancements in extraction and processing are driving growth in the United States gelatin market by improving efficiency, consistency, and application performance. Modern extraction techniques enable higher yields, better molecular weight control, and improved purity, allowing manufacturers to tailor gelatin grades for specific food, pharmaceutical, and cosmetic applications. Advances in enzymatic processing and filtration have also enhanced functional properties such as gel strength, clarity, and solubility. These improvements support broader adoption of gelatin in high-value applications, including nutraceuticals, soft capsules, and functional foods. Enhanced processing technologies further reduce impurities and variability, helping manufacturers meet stringent quality and regulatory standards.
Restraints Impact Analysis*
| Restraint | (~) % Impact on CAGR Forecast | Geographic Relevance | Impact Timeline |
|---|---|---|---|
| Fluctuating raw material prices | -0.9% | United States (national, with acute impact on Midwest rendering hubs) | Short term (≤ 2 years) |
| Supply chain disruptions affecting raw material sourcing | -0.7% | United States (national, exacerbated by import dependencies) | Short term (≤ 2 years) |
| High production and compliance costs for specialized gelatin grades | -0.5% | United States (pharmaceutical and nutraceutical production corridors) | Medium term (2-4 years) |
| Perception and allergen concerns linked to animal products | -0.6% | United States (strongest in coastal and urban markets with high vegan/vegetarian populations) | Long term (≥ 4 years) |
| Source: Mordor Intelligence | |||
Fluctuating raw material prices
Fluctuating raw material prices act as a key restraint for the United States gelatin market, as gelatin production is highly dependent on animal-derived inputs such as bovine hides, bones, and porcine skins. Variability in livestock supply, feed costs, and slaughter rates directly impacts the availability and pricing of these raw materials. Additionally, shifts in meat consumption patterns and export dynamics can tighten supply, leading to cost volatility for gelatin manufacturers. Rising input prices increase production costs and pressure profit margins, particularly for food- and pharmaceutical-grade gelatin. This volatility also complicates long-term pricing agreements with customers and limits cost predictability. As a result, manufacturers face challenges in maintaining stable pricing and ensuring consistent supply in the market.
Supply chain disruptions affecting raw material sourcing
Supply chain disruptions affecting raw material sourcing represent a significant restraint for the United States gelatin market, as production relies heavily on consistent access to animal-derived materials such as hides, bones, and skins. Disruptions caused by logistics bottlenecks, transportation delays, or processing plant shutdowns can restrict raw material availability and slow gelatin production. Events such as disease outbreaks in livestock, labor shortages, and regulatory changes in meat processing further intensify supply risks. Dependence on both domestic and imported raw materials exposes manufacturers to cross-border trade uncertainties and freight cost volatility. These challenges can lead to longer lead times and inconsistent supply for end-use industries. Consequently, supply chain instability undermines production planning and limits market growth momentum.
*Our forecasts treat driver/restraint impacts as directional, not additive. The impact forecasts reflect baseline growth, mix effects, and variable interactions.
Segment Analysis
By Form: Marine Alternatives Gain Traction Despite Animal-Based Dominance
Animal-based gelatin accounted for 94.21% of the United States gelatin market in 2025, making it the overwhelmingly dominant form by volume and value. Its leadership reflects long-established supply chains that efficiently source porcine and bovine raw materials at scale. These mature logistics and processing networks translate into clear cost advantages for food, pharmaceutical, and industrial buyers. Animal-based gelatin also offers superior gel strength and reliable setting properties that are critical for confectionery products such as gummies, marshmallows, and jellies. In pharmaceutical applications, its proven performance in capsules and tablets reinforces its entrenched position.
Marine-based gelatin, while occupying only a small share of the United States market in 2025, is projected to be the fastest-growing form, with a forecast CAGR of 7.23% through 2031. Its growth momentum is closely tied to the ease of meeting halal and kosher certification requirements compared with traditional animal sources. This makes marine gelatin particularly attractive for brands targeting religiously observant consumers and export markets with stringent dietary laws. The ingredient also benefits from allergen-avoidance and “cleaner label” trends, as some consumers seek alternatives to porcine or bovine-derived products. In nutraceuticals, marine gelatin is increasingly used in premium capsules, softgels, and collagen blends positioned around joint, skin, and beauty benefits.


By Application: Food Dominance Masks Faster Growth in Personal Care
Food and beverages accounted for 83.46% of the United States gelatin market in 2025, making it the dominant application segment by a wide margin. This leadership reflects the extensive use of gelatin in confectionery, dairy desserts, meat products, and ready-to-eat foods where its gelling, stabilizing, and texturizing properties are critical. Manufacturers rely on gelatin to deliver the characteristic chewiness of gummies, the smooth texture of yogurts and panna cotta, and the structural integrity of aspics and meat products. Its versatility across sweet and savory formats helps concentrate demand in this single, broad application bucket. The cost-effectiveness of animal-based gelatin further reinforces its continued preference in large-scale food processing. As a result, food and beverages are expected to remain the primary demand anchor for gelatin in the US over the foreseeable forecast horizon.
Personal care and cosmetics, while still smaller in absolute tonnage compared with food uses, represent the fastest-growing application for gelatin in the United States, with an expected CAGR of 6.79% through 2031. Growth in this segment is fueled by rising consumer interest in anti-aging serums, creams, and masks that incorporate collagen and gelatin-derived actives. Ingestible beauty formats, such as beauty gummies and capsules, are gaining traction as brands promote “beauty-from-within” concepts that link skin, hair, and nail health to collagen intake. Marine collagen, in particular, is being positioned on platforms of superior bioavailability and cleaner, premium sourcing, which resonates with both beauty and wellness consumers. This is encouraging greater use of gelatin and collagen in nutricosmetics that sit at the intersection of supplements and skincare.
Geography Analysis
The United States gelatin market is closely tied to the broader structure of the United States animal protein and food ingredient industries. Production and distribution activities are predominantly concentrated in states with established meat, hide, and bone processing infrastructure, such as Iowa, Nebraska, Texas, and California. These regions support the supply of raw materials needed for gelatin extraction and house several processing facilities that convert bovine and porcine byproducts into commercial gelatin. Proximity to livestock production hubs reduces transportation costs for raw inputs and strengthens integration between upstream suppliers and gelatin manufacturers.
On the demand side, consumption of gelatin is widely spread across the country, with heightened activity in metropolitan and industrialized regions like the Northeast (New York, Pennsylvania), Midwest (Illinois, Ohio), and West Coast (California, Washington). These areas have dense populations and diverse food manufacturing sectors that incorporate gelatin into products such as confectionery, desserts, dairy alternatives, and processed foods. Additionally, significant pharmaceutical, nutraceutical, and personal care industries in these regions drive demand for specialized gelatin grades used in capsules, supplements, and cosmetic formulations.
The United States also plays a role in international trade within the gelatin market, serving as both an importer of specialty gelatins and an exporter of commodity grades. States with strong transportation networks and port access, such as Louisiana and Texas, facilitate exports to South America and Asia. Regional regulatory frameworks, environmental considerations, and availability of skilled processing labor further influence where companies invest in new capacity or expand existing facilities. Overall, the geographic dynamics reflect a balance between resource availability, industrial demand centers, and logistical advantages that shape how the gelatin market operates across the country.
Competitive Landscape
The United States gelatin market exhibits moderate concentration, with a handful of large multinational ingredient producers commanding significant share, while smaller regional manufacturers and specialty suppliers operate in niche segments. Key players compete on the basis of product quality, functional performance, and reliability of supply, particularly in categories such as food-grade, pharmaceutical-grade, and technical-grade gelatin. Large incumbents benefit from extensive processing infrastructure, established distribution networks, and long-standing relationships with major food, nutraceutical, and pharmaceutical manufacturers, giving them a competitive edge in volume contracts and customized solutions.
Product differentiation and value-added offerings are important factors shaping competition in this market. Established companies invest in research and development to optimize gelatin functionalities including gelling strength, viscosity, and purity for specific applications like confectionery, dairy, cosmetics, and capsule production. Meanwhile, agile mid-tier and regional players often compete on flexibility, customer service, and tailored formulations for smaller customers or specialized end uses. Certifications and quality standards (e.g., halal, kosher, non-GMO) also contribute to competitive positioning, as buyers increasingly seek compliance with diverse regulatory and consumer-driven requirements.
Pricing dynamics and production cost management further influence the competitive environment. Raw material price fluctuations and energy costs can impact margins, compelling manufacturers to focus on operational efficiencies and supply chain integration. Strategic partnerships, mergers, and capacity expansions are observed as companies seek to broaden their product portfolios and geographic reach. In addition, competition from alternative hydrocolloids and plant-based gelling agents adds pressure, prompting gelatin producers to reinforce their value proposition through innovation and quality.
United States Gelatin Industry Leaders
Darling Ingredients Inc.
GELITA AG
Nitta Gelatin Co., Ltd.
Weishardt Group
Ajinomoto Co., Inc.
- *Disclaimer: Major Players sorted in no particular order

Recent Industry Developments
- December 2025: Darling Ingredients Inc. and Tessenderlo Group NV have inked a definitive agreement, merging their collagen and gelatin ventures into a new joint entity, Nextida. In this venture, Darling commands an 85% stake, while Tessenderlo holds the remaining 15%. This move brings together an impressive annual revenue of around USD 1.5 billion and a production capacity of 200,000 metric tons, spread across 22 to 23 facilities worldwide.
- October 2025: ACG, a global leader in solid-dosage pharmaceutical and nutraceutical solutions, announced a USD 200 million phased investment to establish its first U.S. empty hard-shell capsule manufacturing facility in Atlanta, Georgia. The project, set to begin operations in early 2027, will create over 200 jobs. The site will produce gelatin and vegetarian (HPMC) capsules, enhancing ACG's regional presence and improving supply reliability, lead times, and service quality for North American customers.
- April 2024: GELITA AG unveiled two new products: PeptENDURE, a collagen peptide formulation tailored for endurance athletes and those focused on active aging, and EASYSEAL, a pharmaceutical-grade gelatin fine-tuned for softgel capsule production. These launches underscore GELITA's commitment to tapping into higher-margin specialty markets through targeted innovation and expert technical service.


United States Gelatin Market Report Scope
Animal Based, Marine Based are covered as segments by Form. Food and Beverages, Personal Care and Cosmetics, Supplements are covered as segments by End User.By Form
| Animal-Based |
| Marine-Based |
By Application
| Personal Care and Cosmetics | |
| Food and Beverages | Bakery |
| Beverages | |
| Confectionery | |
| Dairy and Dairy Alternatives Products | |
| RTE/RTC Food Products | |
| Others | |
| Dietary Supplements | |
| Pharmaceuticals | |
| Others |
| By Form | Animal-Based | |
| Marine-Based | ||
| By Application | Personal Care and Cosmetics | |
| Food and Beverages | Bakery | |
| Beverages | ||
| Confectionery | ||
| Dairy and Dairy Alternatives Products | ||
| RTE/RTC Food Products | ||
| Others | ||
| Dietary Supplements | ||
| Pharmaceuticals | ||
| Others | ||


Market Definition
- End User - The Protein Ingredients Market operates on a B2B basis. Food, Beverages, Supplements, Animal Feed, and Personal Care & Cosmetic manufacturers are considered to be end-consumers in the market studied. The scope excludes manufacturers buying liquid/dry whey to be used for application as a binding agent or thickener or other non-protein applications.
- Penetration Rate - Penetration Rate is defined as the percentage of Protein-Fortified End User Market Volume in the Overall End User Market Volume.
- Average Protein Content - Average protein content is the average protein content present per 100 g of product manufactured by all end-user companies considered under the scope of this report.
- End User Market Volume - End-user market volume is the consolidated volume of all types and forms of end-user products in the country or region.
| Keyword | Definition |
|---|---|
| Alpha-lactalbumin (α-Lactalbumin) | It is a protein that regulates the production of lactose in the milk of almost all mammalian species. |
| Amino acid | It is an organic compound that contains both amino and carboxylic acid functional groups, which are required for the synthesis of body protein and other important nitrogen-containing compounds, such as creatine, peptide hormones, and some neurotransmitters. |
| Blanching | It is the process of briefly heating vegetables with steam or boiling water. |
| BRC | British Retail Consortium |
| Bread improver | It is a flour-based blend of several components with specific functional properties designed to modify dough characteristics and give quality attributes to bread. |
| BSF | Black Soldier Fly |
| Caseinate | It is a substance produced by adding an alkali to acid casein, a derivative of casein. |
| Celiac disease | Celiac disease is an immune reaction to eating gluten, a protein found in wheat, barley, and rye. |
| Colostrum | It is a milky fluid that’s released by mammals that have recently given birth before breast milk production begins. |
| Concentrate | It is the least processed form of protein and has a protein content ranging from 40-90% by weight. |
| Dry protein basis | It refers to the percentage of "pure protein" present in a supplement after the water in it is completely removed through heat. |
| Dry whey | It is the product resulting from drying fresh whey which has been pasteurized and to which nothing has been added as a preservative. |
| Egg protein | It is a mixture of individual proteins, including ovalbumin, ovomucoid, ovoglobulin, conalbumin, vitellin, and vitellenin. |
| Emulsifier | It is a food additive that facilitates the blending of foods that are immiscible with one another, such as oil and water. |
| Enrichment | It is the process of addition of micronutrients that are lost during the processing of the product. |
| ERS | Economic Research Service of the USDA |
| Extrusion | It is the process of forcing soft mixed ingredients through an opening in a perforated plate or die designed to produce the required shape. The extruded food is then cut to a specific size by blades. |
| Fava | Also known as Faba, it is another word for yellow split beans. |
| FDA | Food and Drug Administration |
| Flaking | It is a process in which typically a cereal grain (like corn, wheat, or rice) is broken down into grits, cooked with flavors and syrups, and then pressed into flakes between cooled rollers. |
| Foaming agent | It is a food ingredient that makes it possible to form or maintain a uniform dispersion of a gaseous phase in a liquid or solid food. |
| Foodservice | It refers to the part of the food industry which includes businesses, institutions, and companies which prepare meals outside the home. It includes restaurants, school and hospital cafeterias, catering operations, and many other formats. |
| Fortification | It is the deliberate addition of micronutrients that are not found in them naturally or which are lost during processing, to improve a food product's nutritional value. |
| FSANZ | Food Standards Australia New Zealand |
| FSIS | Food Safety and Inspection Service |
| FSSAI | Food Safety and Standards Authority of India |
| Gelling agent | It is an ingredient that functions as a stabilizer and thickener to provide thickening without stiffness through the formation of gel. |
| GHG | Greenhouse Gas |
| Gluten | It is a family of proteins found in grains, including wheat, rye, spelt, and barley. |
| Hemp | It is a botanical class of Cannabis sativa cultivars grown specifically for industrial or medicinal use. |
| Hydrolysate | It is a form of protein manufactured by exposing the protein to enzymes that can partially break the bonds between the protein's amino acids and break down large, complicated proteins into smaller pieces. Its processing makes it easier and quicker to digest. |
| Hypoallergenic | It refers to a substance that causes fewer allergic reactions. |
| Isolate | It is the purest and most processed form of protein which has undergone separation to obtain a pure protein fraction. It typically contains ≥ 90% of protein by weight. |
| Keratin | It is a protein that helps form hair, nails, and the outer layer of skin. |
| Lactalbumin | It is the albumin contained in milk and obtained from whey. |
| Lactoferrin | It is an iron‑binding glycoprotein that is present in the milk of most mammals. |
| Lupin | It is the yellow legume seeds of the genus Lupinus. |
| Millenial | Also known as Generation Y or Gen Y, it refers to the people born from 1981 to 1996. |
| Monogastric | It refers to an animal with a single-compartmented stomach. Examples of monogastric include humans, poultry, pigs, horses, rabbits, dogs, and cats. Most monogastric are generally unable to digest much cellulose food materials such as grasses. |
| MPC | Milk protein concentrate |
| MPI | Milk protein isolate |
| MSPI | Methylated soy protein isolate |
| Mycoprotein | Mycoprotein is a form of single-cell protein, also known as fungal protein, derived from fungi for human consumption. |
| Nutricosmetics | It is a category of products and ingredients that act as nutritional supplements to care for skin, nails, and hair natural beauty. |
| Osteoporosis | It is a medical condition in which the bones become brittle and fragile from loss of tissue, typically as a result of hormonal changes, or deficiency of calcium or vitamin D. |
| PDCAAS | Protein digestibility-corrected amino acid score (PDCAAS) is a method of evaluating the quality of a protein based on both the amino acid requirements of humans and their ability to digest it. |
| Per-capita consumption of animal protein | It is the average amount of animal protein (such as milk, whey, gelatin, collagen, and egg proteins) that is readily available for consumption by each person in an actual population. |
| Per-capita consumption of plant protein | It is the average amount of plant protein (such as soy, wheat, pea, oat, and hemp proteins) that is readily available for consumption by each person in an actual population. |
| Quorn | It is a microbial protein manufactured using mycoprotein as an ingredient, in which the fungus culture is dried and mixed with egg albumen or potato protein, which acts as a binder, and then is adjusted in texture and pressed into various forms. |
| Ready-to-Cook (RTC) | It refers to food products that include all of the ingredients, where some preparation or cooking is required through a process that is given on the package. |
| Ready-to-Eat (RTE) | It refers to a food product prepared or cooked in advance, with no further cooking or preparation required before being eaten. |
| RTD | Ready-to-Drink |
| RTS | Ready-to-Serve |
| Saturated fat | It is a type of fat in which the fatty acid chains have all single bonds. It is generally considered unhealthy. |
| Sausage | It is a meat product made of finely chopped and seasoned meat, which may be fresh, smoked, or pickled and which is then usually stuffed into a casing. |
| Seitan | It is a plant-based meat substitute made out of wheat gluten. |
| Softgel | It is a gelatin-based capsule with a liquid fill. |
| SPC | Soy protein concentrate |
| SPI | Soy protein isolate |
| Spirulina | It is a biomass of cyanobacteria that can be consumed by humans and animals. |
| Stabilizer | It is an ingredient added to food products to help maintain or enhance their original texture, and physical and chemical characteristics. |
| Supplementation | It is the consumption or provision of concentrated sources of nutrients or other substances that are intended to supplement nutrients in the diet and is intended to correct nutritional deficiencies. |
| Texturant | It is a specific type of food ingredient that is used to control and alter the mouthfeel and texture of food and beverage products. |
| Thickener | It is an ingredient that is used to increase the viscosity of a liquid or dough and make it thicker, without substantially changing its other properties. |
| Trans fat | Also called trans-unsaturated fatty acids or trans fatty acids, it is a type of unsaturated fat that naturally occurs in small amounts in meat. |
| TSP | Textured soy protein |
| TVP | Textured vegetable protein |
| WPC | Whey protein concentrate |
| WPI | Whey protein isolate |


Research Methodology
Mordor Intelligence follows a four-step methodology in all our reports.
- Step-1: Identify Key Variables: The quantifiable key variables (industry and extraneous) pertaining to the specific product segment and country are selected from a group of relevant variables & factors based on desk research & literature review; along with primary expert inputs. These variables are further confirmed through regression modeling (wherever required).
- Step-2: Build a Market Model: In order to build a robust forecasting methodology, the variables and factors identified in Step-1 are tested against available historical market numbers. Through an iterative process, the variables required for market forecast are set and the model is built on the basis of these variables.
- Step-3: Validate and Finalize: In this important step, all market numbers, variables and analyst calls are validated through an extensive network of primary research experts from the market studied. The respondents are selected across levels and functions to generate a holistic picture of the market studied.
- Step-4: Research Outputs: Syndicated Reports, Custom Consulting Assignments, Databases & Subscription Platforms


