Market Overview
| Study Period | 2021 - 2031 |
|---|---|
| Forecast Data Period | 2026 - 2031 |
| Historical Data Period | 2021 - 2024 |
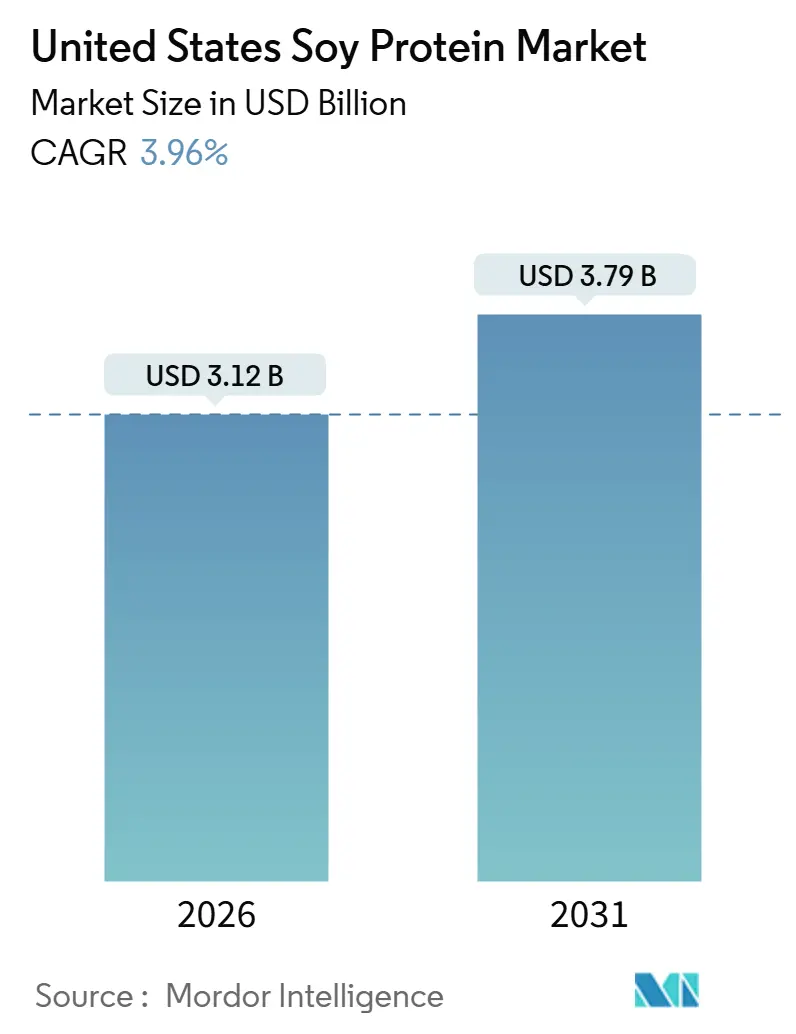
| Market Size (2026) | USD 3.12 Billion |
| Market Size (2031) | USD 3.79 Billion |
| Growth Rate (2026 - 2031) | 3.96% CAGR |
| Market Concentration | Medium |
Major Players
*Disclaimer: Major Players sorted in no particular order Image © Mordor Intelligence. Reuse requires attribution under CC BY 4.0. |
|
United States Soy Protein Market Analysis by Mordor Intelligence
The United States soy protein market size is projected to reach USD 3.12 billion by 2026 and is expected to grow to USD 3.79 billion by 2031, registering a compound annual growth rate (CAGR) of 3.96% during the forecast period. This growth reflects steady, structurally driven expansion rather than rapid acceleration. The market's progress is supported by soy protein's established position as a nutritionally complete, functionally reliable, and industrially scalable plant protein, backed by decades of scientific research and regulatory acceptance. The increasing adoption of plant-based dietary patterns, coupled with greater awareness of protein's importance in long-term health and wellness, continues to drive demand for soy protein within the food and nutrition industry. Additionally, the growing focus on clean-label transparency and ingredient familiarity is favoring well-established proteins like soy over newer, less familiar alternatives.
Key Report Takeaways
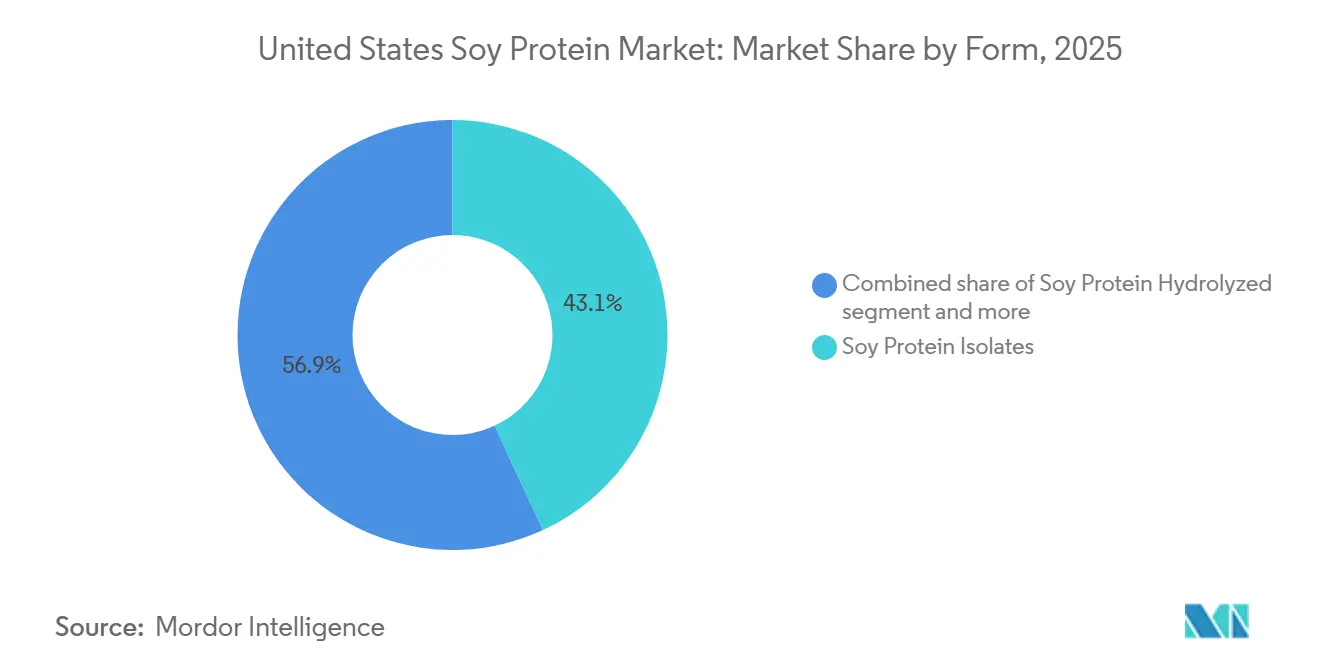
- By form, soy protein isolates held 43.09% of the United States soy protein market share in 2025 and are expanding at a 4.26% CAGR through 2031.
- By category, organic soy proteins commanded 23.37% share in 2025 and posted the fastest 5.67% CAGR to 2031.
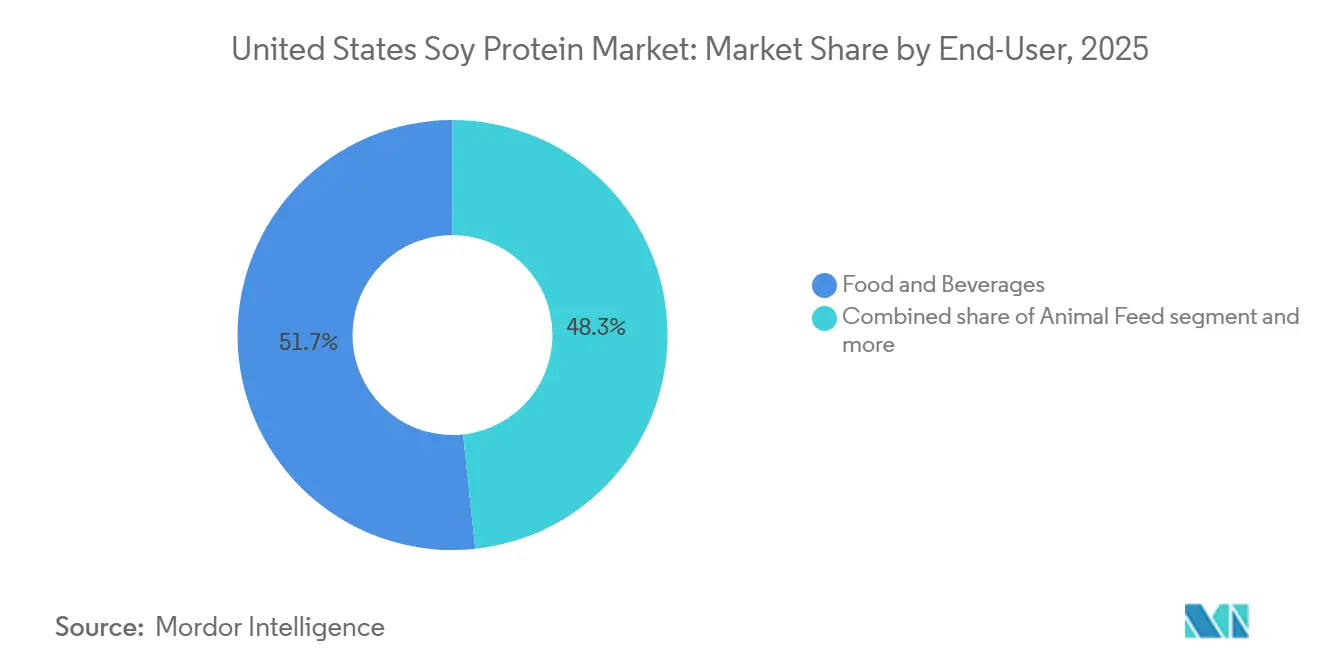
- By end-user, supplements lead value growth at a 4.63% CAGR, even though food and beverages retained 51.69% volume share in 2025.
Note: Market size and forecast figures in this report are generated using Mordor Intelligence’s proprietary estimation framework, updated with the latest available data and insights as of 2026.
United States Soy Protein Market Trends and Insights
Drivers Impact Analysis*
| Driver | (~) % Impact on CAGR Forecast | Geographic Relevance | Impact Timeline |
|---|---|---|---|
| Rising adoption of plant-based diets | +0.9% | National, with concentration in West Coast urban centers and Northeast metro areas | Medium term (2-4 years) |
| Rising demand for clean-label and familiar ingredients | +0.7% | National, strongest in retail channels serving health-conscious demographics | Short term (≤ 2 years) |
| Health benefits awareness | +0.5% | National, with clinical nutrition applications concentrated in healthcare and senior-living facilities | Long term (≥ 4 years) |
| Product innovation supporting market growth | +0.6% | Midwest processing hubs (Iowa, Illinois) and West Coast Research and Development centers (California, Washington) | Medium term (2-4 years) |
| Broad acceptance in sports and clinical nutrition | +0.4% | National, with early gains in sports nutrition retail and hospital foodservice | Short term (≤ 2 years) |
| Increasing focus on high-protein and fortified foods | +0.3% | National, led by bakery and snack manufacturers in Midwest and South | Medium term (2-4 years) |
| Source: Mordor Intelligence | |||
Rising adoption of plant-based diets
The increasing adoption of plant-based diets is driving the market, emphasizing soy protein's role as a key ingredient in the country's evolving protein landscape. A growing number of consumers are adopting flexitarian, vegetarian, and plant-forward eating habits, motivated by health awareness, sustainability concerns, and dietary diversification rather than the complete exclusion of animal products. Soy protein benefits from long-standing consumer familiarity, its complete amino acid profile, and extensive validation across various food systems, making it a trusted plant protein compared to newer alternatives. For example, according to the Good Food Institute, 53% of Americans reported consuming plant-based meat at some point in 2024, demonstrating the significant penetration of plant-based products into mainstream consumption [1]Source: Good Food Institute (GFI), "Plant-Based Meat in the United States", gfi.org. This widespread acceptance supports ongoing product reformulation and portfolio expansion by manufacturers, many of whom depend on soy protein for its nutritional equivalence, formulation stability, and protein labeling efficiency.
Rising demand for clean-label and familiar ingredients
The growing demand for clean-label and familiar ingredients is a key driver of the United States soy protein market, reinforcing soy protein's role as a trusted and widely recognized plant-based ingredient in mainstream food systems. As consumers increasingly prioritize transparent ingredient lists and prefer products with well-known components, soy protein benefits from its reputation for familiarity and functional reliability. This reduces formulation and marketing risks for manufacturers. Its established familiarity aligns with clean-label strategies, allowing brands to incorporate soy protein without the need for extensive explanatory claims or complex ingredient descriptions. Additionally, advancements in processing technologies have enhanced flavor neutrality and functional performance, enabling soy protein to meet clean-label requirements without relying heavily on masking agents or additives. As a result, manufacturers are increasingly retaining or reintroducing soy protein in reformulated products to achieve a balance of transparency, functionality, and consumer trust.
Health benefits awareness
Increasing awareness of the health benefits of soy protein is driving market growth, supporting its adoption across mainstream and health-focused food and nutrition categories. Consumers are paying greater attention to the role of protein in heart health, muscle maintenance, weight management, and metabolic wellness. Soy protein stands out as a complete plant protein with a well-established nutritional profile. Its consumption has been associated with improved cholesterol management and cardiovascular health, providing it with a level of clinical credibility that few plant-based proteins can achieve. Regulatory recognition further bolsters this perception. The United States Food and Drug Administration permits qualified health claims linking soy protein consumption to a reduced risk of heart disease, enhancing both consumer trust and manufacturer confidence.
Product innovation is supporting the market growth
Product innovation is a key factor driving the growth of the United States soy protein market. Advances in soybean genetics, breeding technologies, and protein extraction methods are significantly improving the efficiency and functionality of soy-based ingredients. Modern innovation efforts are increasingly concentrated upstream, focusing on genetically optimized soybean varieties that deliver higher intrinsic protein yields prior to processing. For example, Benson Hill's ultra-high-protein soybean varieties achieve approximately 53% protein content in defatted meal, compared to the traditional industry standard of 47–48%. This improvement in raw material quality enables processors to extract more usable protein per ton of soybeans, directly enhancing processing economics. Higher protein density reduces the required input volumes, lowers transportation and handling costs per unit of finished protein, and improves overall manufacturing efficiency.
Restraints Impact Analysis*
| Restraint | (~) % Impact on CAGR Forecast | Geographic Relevance | Impact Timeline |
|---|---|---|---|
| Competition from alternative plant proteins | -0.5% | National, with strongest substitution in premium plant-based meat and dairy-alternative categories | Short term (≤ 2 years) |
| Allergen labeling requirements | -0.2% | National, most acute for co-packers and contract manufacturers serving multi-allergen facilities | Medium term (2-4 years) |
| Flavor and beany off-notes in certain applications | -0.3% | National, most acute in beverage and dairy-alternative segments targeting mainstream consumers | Medium term (2-4 years) |
| Textural limitations in premium meat analogues | -0.2% | West Coast and urban markets where premium plant-based meat brands compete on sensory parity with animal proteins | Short term (≤ 2 years) |
| Source: Mordor Intelligence | |||
Competition from alternative plant proteins
Competition from alternative plant proteins poses a significant restraint on the United States soy protein market, as ingredient portfolios diversify across food and nutrition applications. Proteins sourced from pea, rice, and chickpea have gained steady traction in applications where neutral flavor profiles, lighter color, and ease of formulation are prioritized. These proteins are often simpler to integrate into beverages and delicately flavored products, requiring fewer processing modifications or flavor-masking measures compared to soy protein. Additionally, the growing focus on allergen-free and non-GMO ingredients has further boosted the appeal of these alternatives. Furthermore, advancements in innovation pipelines and capacity expansion by non-soy protein suppliers have enhanced functional performance, consistency, and scalability, making these alternatives increasingly viable for new product development.
Allergen labeling requirements
Mandatory allergen labeling requirements impose a structural limitation on the United States soy protein market by restricting its use in certain product formulations and marketing strategies. Under United States food regulations, soy must be explicitly declared on ingredient labels, reducing manufacturers' flexibility in targeting products designed for simplified labeling, minimal disclosures, or broad consumer inclusivity. This regulation influences formulation decisions during the early stages of product development, particularly for brands aiming to streamline packaging, minimize on-pack declarations, or address growing consumer scrutiny of labels. Conversely, ingredients not subject to mandatory allergen disclosure may experience smoother market acceptance in specific categories, leading some manufacturers to reconsider the inclusion of soy protein. As labeling transparency continues to influence purchasing behavior and brand strategies, allergen disclosure requirements remain a significant constraint on the adoption of soy protein in certain segments of the United States market.
*Our forecasts treat driver/restraint impacts as directional, not additive. The impact forecasts reflect baseline growth, mix effects, and variable interactions.
Segment Analysis
By Form: Isolates Dominate on Functionality, Concentrates Compete on Cost
Soy protein isolates accounted for 43.09% of the United States soy protein market in 2025 and are projected to grow at a CAGR of 4.26% through 2031. This reflects their strong positioning as the most refined and performance-oriented form of soy protein. Their dominance is primarily attributed to their high protein concentration, low fat and carbohydrate content, and consistent functional reliability. These characteristics make isolates particularly appealing to manufacturers aiming for precise nutritional specifications. As product developers increasingly focus on protein density, amino acid quality, and formulation control, isolates provide a clear advantage over concentrates and flours. Advancements in isolation and purification technologies have further improved solubility, dispersibility, and flavor neutrality, enabling their broader application across modern food systems without compromising sensory appeal.
Hydrolyzed soy proteins occupy a niche within the soy protein market, particularly in savory applications such as soups, sauces, seasonings, and meat marinades. Controlled enzymatic hydrolysis enhances umami intensity, flavor depth, and water-binding capacity, making them valuable in these formulations. However, their growth trajectory remains modest and specialized, influenced by technical and regulatory factors rather than widespread adoption. On the supply side, growth is constrained by the limited availability of food-grade protease suppliers and the need for highly controlled processing conditions to manage the degree of hydrolysis. Inadequate control can result in the formation of bitter peptides and inconsistent flavor profiles, limiting their broader use in formulations.


By Category: Conventional Volume Anchors Market, Organic Captures Premium Growth
Conventional soy protein accounted for 76.63% of the United States soy protein market in 2025, highlighting its position as the most widely available and commercially scalable category. This dominance is attributed to its established sourcing ecosystem, high processing efficiency, and consistent quality standards, which enable manufacturers to procure large volumes with reliable specifications. Conventional soy protein benefits from agronomic optimization and mature downstream processing, allowing ingredient suppliers to deliver competitive functionality and protein performance without the yield losses or certification challenges associated with organic alternatives. Additionally, conventional variants provide greater flexibility in protein standardization, solubility control, and functional customization, making them ideal for manufacturers focused on reproducibility and high throughput.
The organic soy protein segment is projected to grow at a robust CAGR of 5.67% through 2031, surpassing the overall soy protein market growth despite its smaller base. This accelerated expansion is driven by increasing demand for certified sourcing, non-GMO positioning, and reduced use of synthetic inputs, aligning with the evolving clean-label and transparency expectations of food manufacturers. Organic soy protein offers stronger traceability and auditability across the supply chain, supporting brand narratives centered on ingredient integrity and responsible sourcing. Furthermore, advancements in organic soybean yields, processing efficiency, and segregation infrastructure are gradually reducing the functionality gap between organic and conventional variants, enhancing the viability of organic soy protein for performance-oriented formulations.
By End-User: Food and Beverages Lead Volume, Supplements Drive Margin Expansion
In 2025, the food and beverages segment accounted for 51.69% of the United States soy protein market, establishing itself as the primary consumption channel for soy protein ingredients. This dominance is attributed to the sector's emphasis on nutritional optimization, functional consistency, and scalable formulation solutions within mainstream food systems. Soy protein's balanced amino acid profile, familiarity in labeling, and versatility under various processing conditions make it a reliable choice for food and beverage manufacturers aiming to enhance protein content without compromising product stability or shelf life. Additionally, reformulation efforts to improve nutritional density and align with evolving protein labeling standards further support soy protein's integration into food and beverage portfolios.
The supplements segment is projected to grow at a CAGR of 4.63% through 2031, driven by increasing clinical validation of plant-based proteins and shifting consumer health priorities across different age groups. The growing acceptance of soy protein in clinical and lifestyle nutrition underscores its credibility for muscle maintenance, metabolic health, and long-term protein supplementation. Within this segment, sports nutrition serves as a key growth driver, with manufacturers incorporating soy isolate into formulations to provide balanced amino acid delivery, improved digestibility, and allergen-conscious alternatives to dairy-based products. According to the United States Census Bureau, 23.6% of men in the United States engaged daily in sports, exercise, and recreational activities in 2024, highlighting a consistent consumer base for performance and recovery-focused supplements [2]Source: United States Census Bureau, Average percentage of the population engaged in sports, exercise, and recreation", census.gov.
Geography Analysis
The United States soy protein market demonstrates significant regional specialization, influenced by agricultural concentration, processing infrastructure, and end-market demand. The Midwest soy belt, comprising Illinois, Iowa, and Indiana, serves as the primary hub for soybean production, forming the foundation of the domestic soy protein supply. According to the United States Department of Agriculture, these three states were the leading soybean producers in 2024, collectively contributing over 37% of the nation's total soybean output [3]Source: United States Department of Agriculture, "Soybeans and Oil Crops", ers.usda.gov. This concentration facilitates large-scale crushing, protein isolation, and ingredient standardization, ensuring consistent quality, high throughput, and cost-efficient upstream integration for soy protein manufacturers. Additionally, proximity to raw material sources minimizes logistical complexities and supports stable, industrial-scale production.
The West Coast, particularly California, Washington, and Oregon, operates primarily as a demand-driven market rather than a production hub. This region exhibits a strong preference for organic and non-GMO soy protein, driven by consumer demand for sustainability, clean-label products, and transparent sourcing. Food, beverage, and supplement manufacturers on the West Coast increasingly prioritize certified ingredients and traceable supply chains, fostering demand for premium soy protein variants despite limited local soybean cultivation. As a result, the region relies heavily on inbound shipments of soy protein ingredients while exerting significant influence on product specifications, certification standards, and innovation priorities.
The Southern United States, led by Texas and North Carolina, is emerging as a secondary region for soy protein processing and utilization. Growth in this area is closely tied to the expansion of poultry and livestock integrators, which are investing in localized feed milling and seeking reliable, regionally available protein sources. While the demand in this region is primarily focused on feed-grade and functional protein inputs, it is gradually driving increased crushing and processing activity. Over time, this trend is expected to enhance supply chain resilience and diversify processing activities beyond the Midwest, solidifying the South’s strategic role in the broader United States soy protein market.
Competitive Landscape
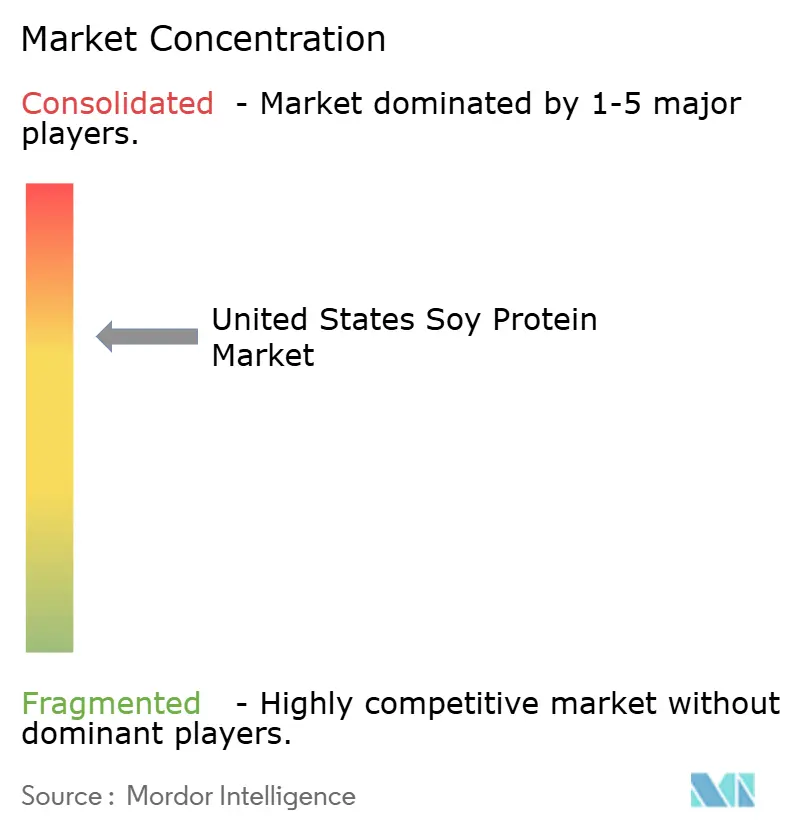
The United States soy protein market is moderately concentrated, with a small group of globally integrated agribusiness and ingredient leaders dominating the landscape. Key players include Archer Daniels Midland Company, Cargill, Incorporated, Bunge Global SA, Kerry Group plc, and Wilmar International Limited. These companies benefit from extensive vertical integration, encompassing soybean origination, crushing, protein isolation, and downstream ingredient refinement. This integration enables them to achieve scale efficiencies and cost advantages that smaller or regional processors find challenging to replicate. Additionally, their control over raw material sourcing and logistics ensures consistent supply, standardized quality, and stable pricing across food, feed, and nutrition channels.
The competitive landscape reveals a clear division between volume-driven and margin-driven business models. Large agribusiness players focus on throughput, operational efficiency, and long-term supply contracts, positioning soy protein as a reliable and scalable ingredient for mainstream food and industrial applications. Conversely, specialty ingredient firms and innovation-focused divisions within larger companies are targeting higher-margin segments. These efforts emphasize improved flavor neutrality, enhanced solubility, and tailored functional performance.
White-space opportunities are becoming evident in fermented soy proteins, including enzymatically and microbially modified variants. These products offer enhanced umami intensity, improved digestibility, and greater flavor complexity. Patent activity in this area is increasing, reflecting growing research and development efforts. However, commercial-scale production remains limited due to challenges such as process complexity, fermentation control, and regulatory validation. As a result, competitive intensity in this niche is relatively low, presenting opportunities for technologically advanced entrants or incumbents willing to invest in sophisticated bioprocessing. Over the medium term, fermented and functionally enhanced soy proteins have the potential to reshape competitive dynamics by shifting value creation from commodity-scale production to proprietary processing and differentiated performance.
United States Soy Protein Industry Leaders
-
Archer Daniels Midland Company
-
Cargill, Incorporated
-
Bunge Global SA
-
Kerry Group plc
-
Wilmar International Limited
- *Disclaimer: Major Players sorted in no particular order

Recent Industry Developments
- August 2025: ADM announced plans to streamline and enhance its global soy protein production network. The company aims to improve efficiency and better serve customers worldwide by leveraging operational capabilities at its recommissioned soy protein facility in Decatur, Illinois, along with other facilities across its global network.
- May 2025: Bunge has invested EUR 484 million in a soy protein facility in Morristown, Indiana. This facility will process an additional 4.5 million bushels of soybeans each year.


United States Soy Protein Market Report Scope
The soy protein market processes protein-rich ingredients derived from soybeans into versatile forms. These forms find diverse applications, spanning food processing, animal nutrition, and health products.
The United States soy protein market is segmented by form into soy protein concentrates, soy protein hydrolysates, and soy protein isolates. By category, the market is segmented into conventional and organic. By end user, the market is segmented into animal feed, food and beverages, personal care and cosmetics, and supplements. Market sizing has been done in value terms in USD and in volume in tons for all the abovementioned segments.
By Form
| Soy Protein Concentrates |
| Soy Protein Hydrolyzed |
| Soy Protein Isolates |
By Category
| Conventional |
| Organic |
By End-User
| Animal Feed | |
| Food and Beverages | Bakery |
| Beverages | |
| Breakfast Cereals | |
| Condiments/Sauces | |
| Confectionery | |
| Dairy and Dairy Alternatives | |
| Meat/Poultry/Seafood and Meat Alternative Products | |
| RTE/RTC Foods | |
| Snacks | |
| Personal Care and Cosmetics | |
| Supplements | Baby Food and Infant Formula |
| Elderly and Medical Nutrition | |
| Sport/Performance Nutrition |
| By Form | Soy Protein Concentrates | |
| Soy Protein Hydrolyzed | ||
| Soy Protein Isolates | ||
| By Category | Conventional | |
| Organic | ||
| By End-User | Animal Feed | |
| Food and Beverages | Bakery | |
| Beverages | ||
| Breakfast Cereals | ||
| Condiments/Sauces | ||
| Confectionery | ||
| Dairy and Dairy Alternatives | ||
| Meat/Poultry/Seafood and Meat Alternative Products | ||
| RTE/RTC Foods | ||
| Snacks | ||
| Personal Care and Cosmetics | ||
| Supplements | Baby Food and Infant Formula | |
| Elderly and Medical Nutrition | ||
| Sport/Performance Nutrition | ||


Market Definition
- End User - The Protein Ingredients Market operates on a B2B basis. Food, Beverages, Supplements, Animal Feed, and Personal Care & Cosmetic manufacturers are considered to be end-consumers in the market studied. The scope excludes manufacturers buying liquid/dry whey to be used for application as a binding agent or thickener or other non-protein applications.
- Penetration Rate - Penetration Rate is defined as the percentage of Protein-Fortified End User Market Volume in the Overall End User Market Volume.
- Average Protein Content - Average protein content is the average protein content present per 100 g of product manufactured by all end-user companies considered under the scope of this report.
- End User Market Volume - End-user market volume is the consolidated volume of all types and forms of end-user products in the country or region.
| Keyword | Definition |
|---|---|
| Alpha-lactalbumin (α-Lactalbumin) | It is a protein that regulates the production of lactose in the milk of almost all mammalian species. |
| Amino acid | It is an organic compound that contains both amino and carboxylic acid functional groups, which are required for the synthesis of body protein and other important nitrogen-containing compounds, such as creatine, peptide hormones, and some neurotransmitters. |
| Blanching | It is the process of briefly heating vegetables with steam or boiling water. |
| BRC | British Retail Consortium |
| Bread improver | It is a flour-based blend of several components with specific functional properties designed to modify dough characteristics and give quality attributes to bread. |
| BSF | Black Soldier Fly |
| Caseinate | It is a substance produced by adding an alkali to acid casein, a derivative of casein. |
| Celiac disease | Celiac disease is an immune reaction to eating gluten, a protein found in wheat, barley, and rye. |
| Colostrum | It is a milky fluid that’s released by mammals that have recently given birth before breast milk production begins. |
| Concentrate | It is the least processed form of protein and has a protein content ranging from 40-90% by weight. |
| Dry protein basis | It refers to the percentage of "pure protein" present in a supplement after the water in it is completely removed through heat. |
| Dry whey | It is the product resulting from drying fresh whey which has been pasteurized and to which nothing has been added as a preservative. |
| Egg protein | It is a mixture of individual proteins, including ovalbumin, ovomucoid, ovoglobulin, conalbumin, vitellin, and vitellenin. |
| Emulsifier | It is a food additive that facilitates the blending of foods that are immiscible with one another, such as oil and water. |
| Enrichment | It is the process of addition of micronutrients that are lost during the processing of the product. |
| ERS | Economic Research Service of the USDA |
| Extrusion | It is the process of forcing soft mixed ingredients through an opening in a perforated plate or die designed to produce the required shape. The extruded food is then cut to a specific size by blades. |
| Fava | Also known as Faba, it is another word for yellow split beans. |
| FDA | Food and Drug Administration |
| Flaking | It is a process in which typically a cereal grain (like corn, wheat, or rice) is broken down into grits, cooked with flavors and syrups, and then pressed into flakes between cooled rollers. |
| Foaming agent | It is a food ingredient that makes it possible to form or maintain a uniform dispersion of a gaseous phase in a liquid or solid food. |
| Foodservice | It refers to the part of the food industry which includes businesses, institutions, and companies which prepare meals outside the home. It includes restaurants, school and hospital cafeterias, catering operations, and many other formats. |
| Fortification | It is the deliberate addition of micronutrients that are not found in them naturally or which are lost during processing, to improve a food product's nutritional value. |
| FSANZ | Food Standards Australia New Zealand |
| FSIS | Food Safety and Inspection Service |
| FSSAI | Food Safety and Standards Authority of India |
| Gelling agent | It is an ingredient that functions as a stabilizer and thickener to provide thickening without stiffness through the formation of gel. |
| GHG | Greenhouse Gas |
| Gluten | It is a family of proteins found in grains, including wheat, rye, spelt, and barley. |
| Hemp | It is a botanical class of Cannabis sativa cultivars grown specifically for industrial or medicinal use. |
| Hydrolysate | It is a form of protein manufactured by exposing the protein to enzymes that can partially break the bonds between the protein's amino acids and break down large, complicated proteins into smaller pieces. Its processing makes it easier and quicker to digest. |
| Hypoallergenic | It refers to a substance that causes fewer allergic reactions. |
| Isolate | It is the purest and most processed form of protein which has undergone separation to obtain a pure protein fraction. It typically contains ≥ 90% of protein by weight. |
| Keratin | It is a protein that helps form hair, nails, and the outer layer of skin. |
| Lactalbumin | It is the albumin contained in milk and obtained from whey. |
| Lactoferrin | It is an iron‑binding glycoprotein that is present in the milk of most mammals. |
| Lupin | It is the yellow legume seeds of the genus Lupinus. |
| Millenial | Also known as Generation Y or Gen Y, it refers to the people born from 1981 to 1996. |
| Monogastric | It refers to an animal with a single-compartmented stomach. Examples of monogastric include humans, poultry, pigs, horses, rabbits, dogs, and cats. Most monogastric are generally unable to digest much cellulose food materials such as grasses. |
| MPC | Milk protein concentrate |
| MPI | Milk protein isolate |
| MSPI | Methylated soy protein isolate |
| Mycoprotein | Mycoprotein is a form of single-cell protein, also known as fungal protein, derived from fungi for human consumption. |
| Nutricosmetics | It is a category of products and ingredients that act as nutritional supplements to care for skin, nails, and hair natural beauty. |
| Osteoporosis | It is a medical condition in which the bones become brittle and fragile from loss of tissue, typically as a result of hormonal changes, or deficiency of calcium or vitamin D. |
| PDCAAS | Protein digestibility-corrected amino acid score (PDCAAS) is a method of evaluating the quality of a protein based on both the amino acid requirements of humans and their ability to digest it. |
| Per-capita consumption of animal protein | It is the average amount of animal protein (such as milk, whey, gelatin, collagen, and egg proteins) that is readily available for consumption by each person in an actual population. |
| Per-capita consumption of plant protein | It is the average amount of plant protein (such as soy, wheat, pea, oat, and hemp proteins) that is readily available for consumption by each person in an actual population. |
| Quorn | It is a microbial protein manufactured using mycoprotein as an ingredient, in which the fungus culture is dried and mixed with egg albumen or potato protein, which acts as a binder, and then is adjusted in texture and pressed into various forms. |
| Ready-to-Cook (RTC) | It refers to food products that include all of the ingredients, where some preparation or cooking is required through a process that is given on the package. |
| Ready-to-Eat (RTE) | It refers to a food product prepared or cooked in advance, with no further cooking or preparation required before being eaten. |
| RTD | Ready-to-Drink |
| RTS | Ready-to-Serve |
| Saturated fat | It is a type of fat in which the fatty acid chains have all single bonds. It is generally considered unhealthy. |
| Sausage | It is a meat product made of finely chopped and seasoned meat, which may be fresh, smoked, or pickled and which is then usually stuffed into a casing. |
| Seitan | It is a plant-based meat substitute made out of wheat gluten. |
| Softgel | It is a gelatin-based capsule with a liquid fill. |
| SPC | Soy protein concentrate |
| SPI | Soy protein isolate |
| Spirulina | It is a biomass of cyanobacteria that can be consumed by humans and animals. |
| Stabilizer | It is an ingredient added to food products to help maintain or enhance their original texture, and physical and chemical characteristics. |
| Supplementation | It is the consumption or provision of concentrated sources of nutrients or other substances that are intended to supplement nutrients in the diet and is intended to correct nutritional deficiencies. |
| Texturant | It is a specific type of food ingredient that is used to control and alter the mouthfeel and texture of food and beverage products. |
| Thickener | It is an ingredient that is used to increase the viscosity of a liquid or dough and make it thicker, without substantially changing its other properties. |
| Trans fat | Also called trans-unsaturated fatty acids or trans fatty acids, it is a type of unsaturated fat that naturally occurs in small amounts in meat. |
| TSP | Textured soy protein |
| TVP | Textured vegetable protein |
| WPC | Whey protein concentrate |
| WPI | Whey protein isolate |


Research Methodology
Mordor Intelligence follows a four-step methodology in all our reports.
- Step-1: Identify Key Variables: The quantifiable key variables (industry and extraneous) pertaining to the specific product segment and country are selected from a group of relevant variables & factors based on desk research & literature review; along with primary expert inputs. These variables are further confirmed through regression modeling (wherever required).
- Step-2: Build a Market Model: In order to build a robust forecasting methodology, the variables and factors identified in Step-1 are tested against available historical market numbers. Through an iterative process, the variables required for market forecast are set and the model is built on the basis of these variables.
- Step-3: Validate and Finalize: In this important step, all market numbers, variables and analyst calls are validated through an extensive network of primary research experts from the market studied. The respondents are selected across levels and functions to generate a holistic picture of the market studied.
- Step-4: Research Outputs: Syndicated Reports, Custom Consulting Assignments, Databases & Subscription Platforms


