Market Overview
| Study Period | 2021 - 2031 |
|---|---|
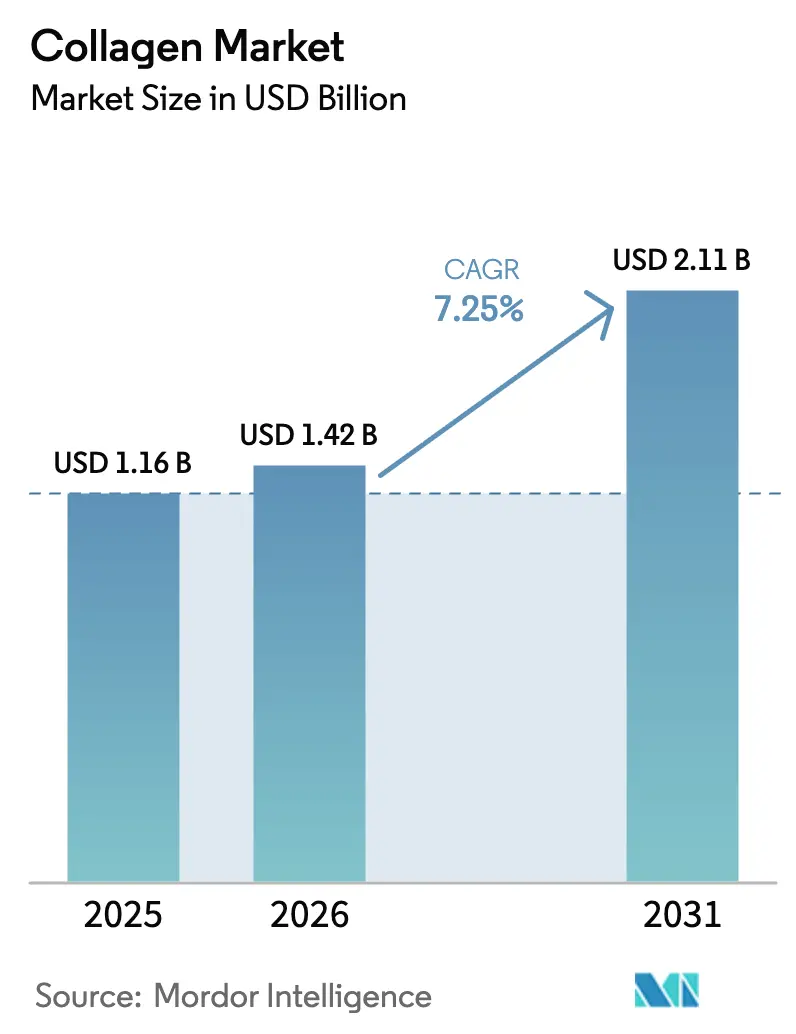
| Market Size (2026) | USD 1.42 Billion |
| Market Size (2031) | USD 2.11 Billion |
| Growth Rate (2026 - 2031) | 7.25% CAGR |
| Fastest Growing Market | Asia Pacific |
| Largest Market | North America |
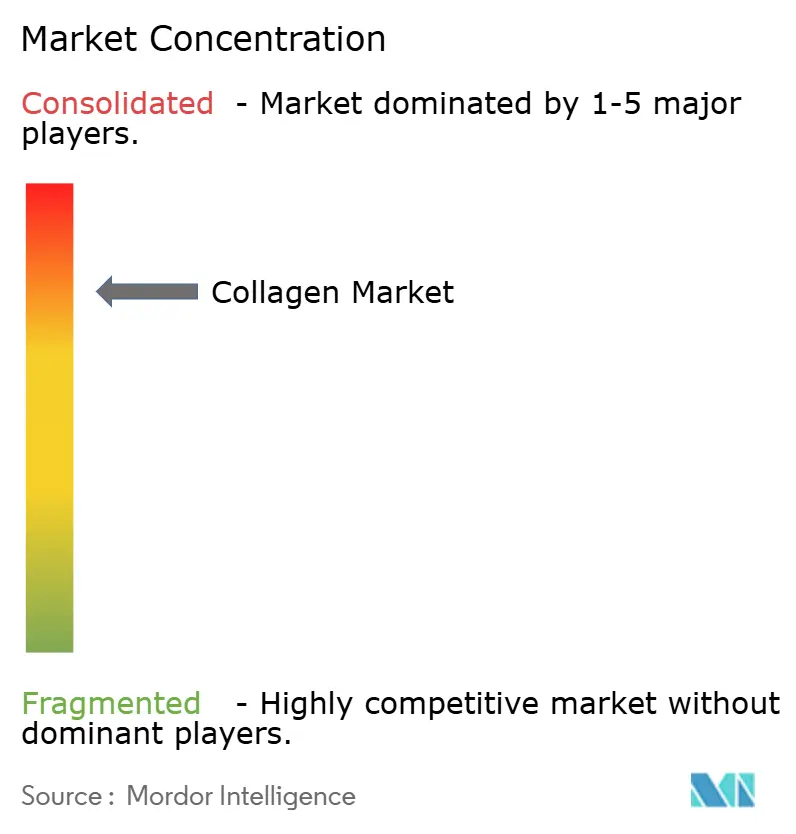
| Market Concentration | High |
Major Players*Disclaimer: Major Players sorted in no particular order Image © Mordor Intelligence. Reuse requires attribution under CC BY 4.0. | |
Collagen Market Analysis by Mordor Intelligence
The collagen market size is valued at USD 1.42 billion in 2026, growing from the 2025 value of USD 1.16 billion, and is forecast to climb to USD 2.11 billion by 2031, advancing at a 7.25% CAGR during the forecast period. Robust demand stems from healthy-aging consumers, functional food reformulations, and beauty-from-within product launches that reframe collagen as a daily wellness staple. Precision-fermentation platforms are easing halal and BSE concerns while widening ingredient sourcing options. Marine collagen is emerging as the sustainability front-runner in Asia-Pacific beauty channels, and scale-driven capacity expansions by incumbent suppliers are tightening raw material supply chains. Regulatory clarity in the United States and the European Union is also accelerating time-to-market for clinically substantiated product claims, reinforcing an innovation race among ingredient leaders.
Key Report Takeaways
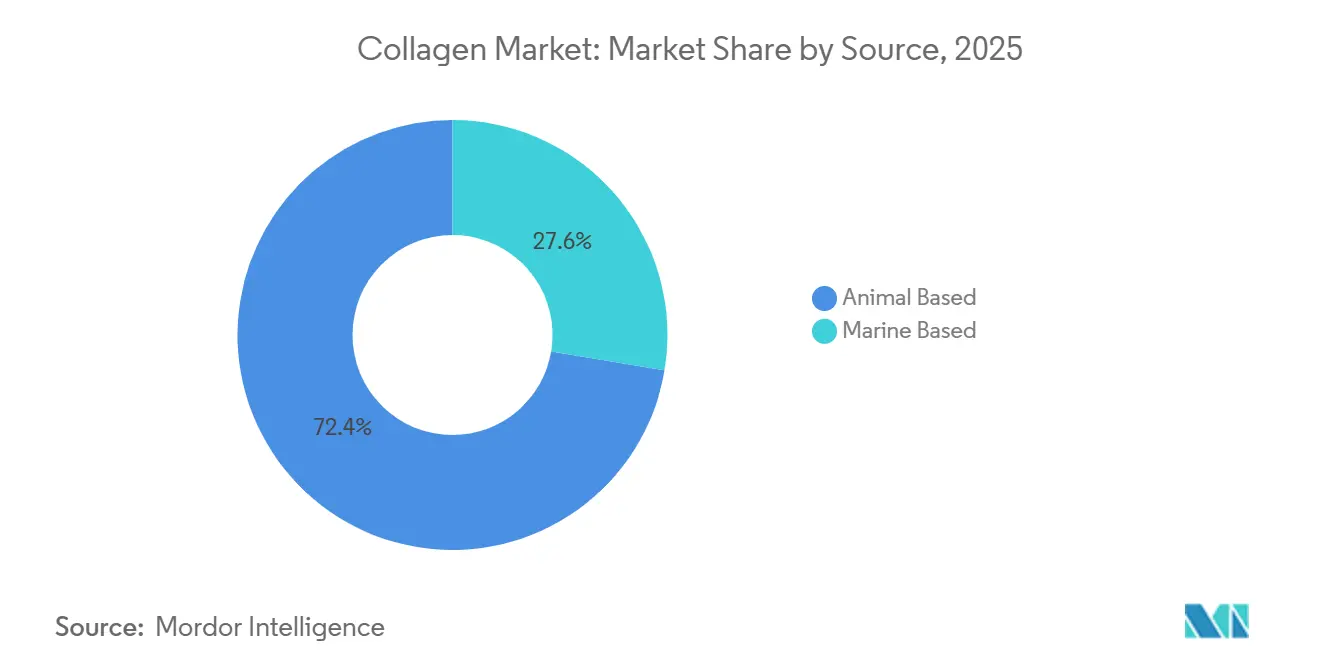
- By source, animal-based collagen retained a 72.38% share of the collagen market in 2025, whereas marine variants are tracking an 8.62% CAGR to 2031.
- By form, powder formats controlled 82.31% of the collagen market share in 2025, while liquid formats are set to grow at an 8.55% CAGR through 2031.
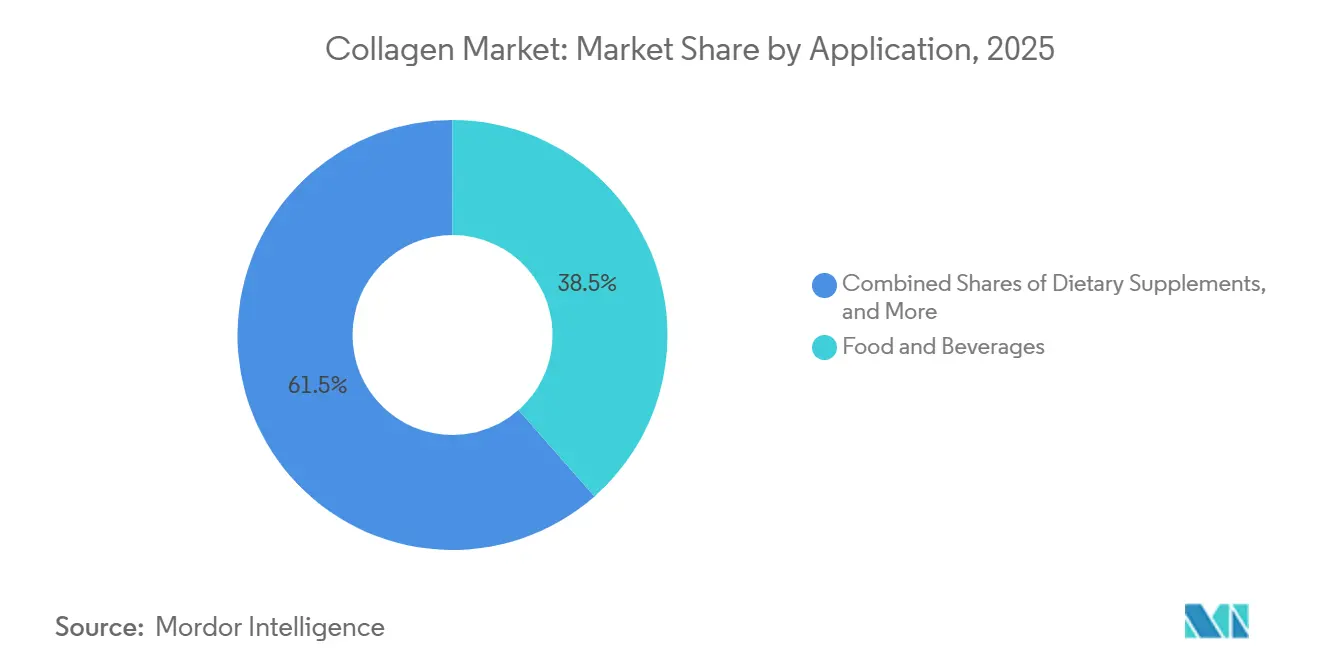
- By application, food and beverages delivered 38.52% of 2025 value, yet cosmetics and personal care is pacing the field with a 9.25% CAGR to 2031.
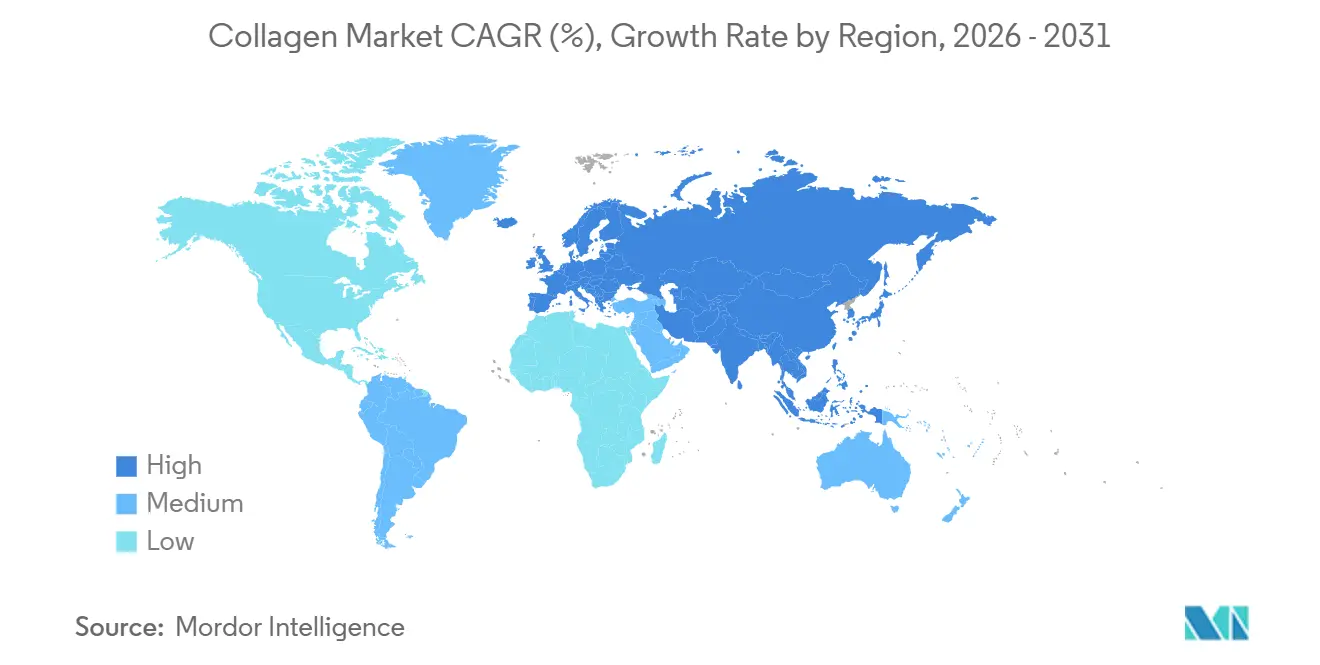
- By geography, North America generated 34.62% of 2025 revenue, and Asia-Pacific is forecast to expand at a 9.15% CAGR through 2031.
Note: Market size and forecast figures in this report are generated using Mordor Intelligence’s proprietary estimation framework, updated with the latest available data and insights as of January 2026.
Global Collagen Market Trends and Insights
Drivers Impact Analysis*
| Drivers | (~) % Impact on CAGR Forecasts | Geographic Relevance | Impact Timeline |
|---|---|---|---|
| Rising Demand for Functional Foods and Nutraceuticals | +1.2% | Global, with North America and Europe leading regulatory approvals | Medium term (2-4 years) |
| Aging Population Seeking Joint and Bone Support | +1.5% | Global, concentrated in North America, Europe, and Japan | Long term (≥ 4 years) |
| Expansion of Beauty-From-Within Nutricosmetics | +1.0% | Asia-Pacific core (China, Japan, South Korea), spill-over to North America | Short term (≤ 2 years) |
| Precision-Fermentation Enables Animal-Free Collagen | +0.8% | North America and Europe early adoption, Asia-Pacific following | Medium term (2-4 years) |
| Shift toward Sustainable Marine Collagen Sources | +0.7% | Asia-Pacific and Europe, with MSC certification driving premium positioning | Medium term (2-4 years) |
| Rising Innovation in Research and Production | +0.9% | Global, led by bioprocessing hubs in North America and Europe | Long term (≥ 4 years) |
| Source: Mordor Intelligence | |||


Rising Demand for Functional Foods and Nutraceuticals
Functional food manufacturers are incorporating hydrolyzed collagen peptides into protein bars, beverages, and dairy products to cater to consumers seeking joint health and skin elasticity benefits beyond basic nutrition. The FDA's GRAS determination for Geltor's microbial collagen in 2024 enabled its use in food matrices without requiring New Dietary Ingredient notifications, thereby accelerating the time-to-market for brands targeting clean-label positioning[1]Source: U.S. Food and Drug Administration, “GRAS Notice Inventory,” fda.gov. EFSA's health claims framework permits qualified structure-function statements for collagen peptides in the European Union, provided manufacturers substantiate bioavailability through clinical trials. This regulatory clarity is driving reformulation cycles in sports nutrition and active aging categories, where collagen's amino acid profile, rich in glycine, proline, and hydroxyproline, complements whey and plant proteins. The shift from gelatin capsules to peptide powders reflects formulators' preference for ingredients that dissolve in cold liquids and deliver molecular weights of 2,000-10,000 Daltons for enhanced intestinal absorption.
Aging Population Seeking Joint and Bone Support
The aging global population is driving growth in the collagen supplements market, particularly for products addressing osteoarthritis pain relief and bone mineral density maintenance. WHO data indicates that by 2030, the global population aged 60 and older will reach 1.4 billion. This trend is fueling demand for Type II collagen from chicken cartilage, which is clinically proven to support joint health, as well as Type I collagen from bovine and marine sources for skin and bone health. In 2015, Japan's Ministry of Health, Labour and Welfare approved collagen peptides as Foods with Function Claims. This approval, coupled with strong consumer adoption, has positioned Japan as the global leader in per-capita collagen consumption. Orthopedic surgeons are increasingly recommending collagen supplements as therapeutic adjuncts to non-steroidal anti-inflammatory drugs, elevating collagen from a wellness product to a medicalized solution. However, a key challenge remains in educating consumers about the differences between collagen types and proper dosing regimens. Clinical evidence suggests that a daily intake of 5-10 grams over 12 weeks is necessary for optimal results.
Expansion of Beauty-From-Within Nutricosmetics
Nutricosmetics brands are repositioning collagen as an ingestible skincare ingredient, leveraging clinical studies that demonstrate improvements in skin hydration, elasticity, and wrinkle depth after 8-12 weeks of supplementation. Neutrogena's 2024 launch of Collagen Bank, a daily supplement targeting dermal collagen synthesis, exemplifies how mass-market cosmetics brands are entering the dietary supplement space to capture cross-category spending. Asia-Pacific consumers exhibit the highest adoption rates, with 51% of collagen users in the region citing beauty and skin benefits as their primary motivation, compared to 29% for joint health. This preference is driving liquid collagen formats—often flavored and packaged in single-serve sachets that appeal to younger demographics seeking convenience. Shiseido's investment in collagen tripeptide research has yielded proprietary ingredients that the company claims offer superior bioavailability, creating differentiation in a crowded market. The regulatory ambiguity around cosmetic-supplement hybrids remains a friction point, as products must navigate both FDA dietary supplement rules and cosmetic ingredient safety assessments.
Precision-Fermentation Enables Animal-Free Collagen
Precision fermentation is transforming the production of recombinant human collagen. This approach uses genetically engineered microorganisms to address ethical concerns and supply chain issues associated with animal-derived sources. In 2024, Geltor reached a key regulatory milestone with FDA GRAS approval of its microbial collagen, highlighting the safety and functionality of fermentation-derived proteins for food and cosmetic applications. The process involves inserting human collagen genes into yeast or E. coli strains, which then produce collagen proteins that are harvested, purified, and converted into peptides. The USDA Economic Research Service reports that cellular agriculture production costs for recombinant proteins range between USD 10 and USD 13 per kilogram. While this cost is competitive with premium marine collagen, it can be higher than commodity bovine collagen, which is priced at approximately USD 12 per kilogram. Geltor and Modern Meadow have strengthened their market positions by filing patents covering fermentation optimization, downstream purification, and formulation stability. These intellectual property protections may slow the broader adoption of this technology. Additionally, eliminating animal-derived materials reduces the risk of bovine spongiform encephalopathy and simplifies halal and kosher certifications. This positions precision-fermented collagen as a strategic solution to mitigate disruptions caused by zoonotic diseases.
Restraint Impact Analysis*
| Restraints | (~) % Impact on CAGR Forecasts | Geographic Relevance | Impact Timeline |
|---|---|---|---|
| Rise of Vegan Protein Alternatives | -0.5% | North America and Europe, with growing adoption in Asia-Pacific urban centers | Short term (≤ 2 years) |
| Stringent Regulatory Compliance and Certification Requirements | -0.4% | Global, with EU and North America imposing highest standards | Medium term (2-4 years) |
| Ethical and Allergenic Concerns Related to Animal-Derived Collagen | -0.3% | Europe and North America, driven by consumer activism | Long term (≥ 4 years) |
| High Costs of Sourcing and Processing High-Quality Collagen Raw Materials | -0.6% | Global, with acute pressure in marine collagen supply chains | Medium term (2-4 years) |
| Source: Mordor Intelligence | |||
Rise of Vegan Protein Alternatives
Plant-based proteins, including pea, soy, and rice, are increasingly capturing market share in the sports nutrition and meal replacement categories, areas where collagen previously dominated as a complete protein source. Brands like Orgain and Sunwarrior have developed vegan protein blends fortified with amino acids to replicate collagen's glycine and proline content, appealing to consumers focused on animal welfare and environmental sustainability. Ingredion's 2024 launch of VITESSENCE Pulse pea protein highlighted the ability of plant proteins to achieve neutral taste profiles and smooth textures, addressing historical challenges in beverage applications. The vegan protein trend resonates strongly with millennials and Generation Z in North America and Europe, where flexitarian diets are becoming mainstream. However, plant proteins lack hydroxyproline, a non-essential amino acid unique to collagen, which is associated with skin and joint health benefits, limiting their functional equivalence. The competition is less about direct substitution and more about budget reallocation, as consumers with limited supplement spending may prioritize plant proteins over collagen.
Stringent Regulatory Compliance and Certification Requirements
New market entrants encounter multi-year timelines and six-figure costs due to the complex regulatory compliance requirements for collagen ingredients. These requirements cover food safety, novel food approvals, health claims substantiation, and traceability documentation. The FDA's Current Good Manufacturing Practice regulations for dietary supplements necessitate validated analytical methods to assess collagen peptide molecular weight distribution, amino acid composition, and microbial contamination. Similarly, EFSA's novel food pathway mandates toxicological studies and allergenicity assessments for recombinant collagen. For B2B ingredient suppliers serving multinational food and cosmetics brands, ISO 22000 certification for food safety management systems and ISO 9001 for quality management have become critical. The Canada Food Inspection Agency enforces traceability requirements for animal-derived collagen to address bovine spongiform encephalopathy risks, requiring documentation of hide sourcing from approved countries and slaughterhouses. These stringent compliance frameworks give an advantage to established players like Rousselot and GELITA, who can distribute certification costs across large production volumes. Conversely, these regulations create significant barriers for smaller regional producers attempting to export under FDA CGMP and EFSA's Novel Food guidelines[2]Source: European Food Safety Authority, “Nutrition and Health Claims,” efsa.europa.eu.
*Our forecasts treat driver/restraint impacts as directional, not additive. The impact forecasts reflect baseline growth, mix effects, and variable interactions.
Segment Analysis
By Source: Marine Gains on Sustainability Credentials
In 2025, animal-based inputs contributed 72.38% of the collagen market's revenue, driven by cost-efficient bovine and porcine supply chains. Meanwhile, marine collagen is projected to grow at an 8.62% CAGR through 2031, attracting premium skincare and beverage brands that emphasize traceable sourcing. Bovine collagen remains dominant in pharmaceutical gel caps and gummy confections, while porcine collagen leads in volume for mainstream functional foods. In Europe and North America, MSC-certified marine collagen holds a premium position, supported by the influence of sustainability seals on purchasing decisions. Although precision-fermented variants currently represent a minor share in 2026, they could capture 5–8% by 2031 if production costs drop below USD 10 per kilogram.
In the Asia-Pacific, there is a strong preference for fish-derived Type I collagen, particularly for beauty-from-within applications. In contrast, Western markets exhibit more diverse demand, spanning bovine, porcine, and marine sources. Darling Ingredients, which processes an estimated 15% of the world's animal by-products, reinforces its upstream control over bovine supplies. Meanwhile, Nitta Gelatin and Weishardt are expanding capacities in Southeast Asia, focusing on utilizing waste streams from tilapia and pangasius. Lastly, Type II collagen, derived from chicken cartilage and primarily targeted at mobility supplements, continues to occupy a niche segment in the market.


By Form: Liquid Formats Target Convenience Seekers
In 2025, powders accounted for 82.31% of the collagen market revenue due to their extended shelf life, 90–95% protein content, and ease of incorporation into shakes and bakery mixes. Although liquids represent a smaller share, they are expected to grow at an 8.55% CAGR, driven by the rising demand for on-the-go lifestyles and their premium positioning in nutricosmetics. These liquid shots often combine collagen with vitamins, hyaluronic acid, and botanical extracts, enabling them to achieve prices two to three times higher per gram compared to powders.
Manufacturing advancements such as aseptic filling and high-pressure processing have extended the shelf life of liquids to 18 months without refrigeration, reducing distribution challenges. Japan leads in liquid adoption, while Europe faces challenges due to strict labeling regulations that require EFSA-validated health claims for beauty benefits. Powders continue to dominate the sports nutrition market, where cost-per-serving is a key factor. Formulators are incorporating neutral-flavor peptides into cold-brew coffee and baked goods, while single-serve stick packs are being used to ensure precise dosing in clinical studies.
By Application: Cosmetics Outpaces Traditional Supplements
In 2025, mainstream brands enhanced protein bars, yogurts, and sparkling drinks, enabling the food and beverage sector to secure 38.52% of the market value. Cosmetics and personal care, fueled by ingestible beauty SKUs that integrate oral supplements with topical products, surpassed other segments with a projected 9.25% CAGR through 2031. Dietary supplements, targeting joint, bone, and skin health, capitalized on e-commerce and pharmacy channels for their capsules, tablets, and powders. Although limited in volume, pharmaceutical applications for wound dressings and regenerative scaffolds, which require high purity, command premium prices.
Beauty brands such as Elemis and Neutrogena, leveraging established consumer trust, are expanding into the supplement category, thereby increasing their average basket size. The FDA's enforcement against unapproved drug claims is driving marketers to rely on robust clinical evidence and precise structure-function claims. In pet nutrition, while still a minor revenue contributor, there is growing demand for collagen dosing to support hip and joint health in aging dogs.
Geography Analysis
In 2025, North America accounted for 34.62% of the global collagen market share, supported by well-established dietary supplement channels, strong consumer awareness of collagen's benefits for joint and skin health, and clear regulatory guidelines under the FDA's Dietary Supplement Health and Education Act. The U.S. dominates the region, with collagen supplements consistently ranking among the top-selling products in natural product stores and e-commerce platforms. The FDA's GRAS approvals for microbial collagen and updated guidance on New Dietary Ingredient notifications have driven a surge in product launches. At the same time, the Federal Trade Commission's focus on unverified health claims is prompting brands to prioritize clinical substantiation. In Canada, Health Canada's Natural Health Products Regulations influence the market by requiring pre-market licensing for collagen supplements and enforcing stricter efficacy standards compared to the U.S. In Mexico, the growing middle class and expanding retail pharmacy networks are increasing demand for affordable collagen powders, though price sensitivity limits the penetration of premium marine collagen. The competitive landscape is intense, with Vital Proteins (a Nestlé Health Science brand) and Sports Research holding significant e-commerce market share, alongside private-label offerings from major retailers like Costco and Amazon.
Asia-Pacific is expected to grow at a 9.15% CAGR from 2026 to 2031, driven by increasing disposable incomes, a cultural preference for collagen supplementation, and aggressive marketing by Japanese and South Korean beauty brands. Research shows that 51% of collagen users in Asia-Pacific prioritize beauty and skin benefits, compared to 29% who focus on joint health, a reversal of the trend seen in Western markets. Japan leads globally in per-capita collagen consumption, with collagen peptides widely accepted as Foods with Function Claims and distributed through convenience stores, pharmacies, and direct sales channels. China's market is expanding rapidly, supported by e-commerce platforms like Tmall and JD.com, which facilitate cross-border sales of imported collagen brands. However, domestic producers are gaining market share by offering more affordable alternatives. In South Korea, the nutricosmetics trend, driven by K-beauty and influencer marketing, has positioned liquid collagen shots as a daily beauty staple. Meanwhile, India's collagen market, though still emerging, is growing as urban consumers in cities like Mumbai and Delhi adopt collagen supplements through online platforms. Regulatory frameworks vary significantly across the region, with Japan's Foods with Function Claims system offering streamlined approvals compared to China's stricter health food registration process[3]Source: Consumer Affairs Agency Japan, “Foods with Function Claims,” caa.go.jp.
Europe's collagen market is defined by sustainability-conscious consumers, stringent EFSA regulations, and the premium positioning of marine collagen. Germany, the U.K., France, and Italy are the largest markets, with demand concentrated in dietary supplements and functional foods. The EU's Nutrition and Health Claims Regulation requires clinical evidence to support any claims related to skin, joint, or bone health. Following Brexit, the UK Food Standards Agency has started developing its own guidelines, diverging from EFSA standards and creating challenges for manufacturers operating in both regions. Eastern European countries like Poland and Russia have lower per-capita collagen consumption but are experiencing faster growth due to rising disposable incomes and improving retail infrastructure. In September 2025, GELITA acquired a 65% stake in Turkish halal gelatin producer SelJel, strategically positioning itself for exports to the Middle East and North Africa, where halal certification is mandatory for animal-derived ingredients. South America and the Middle East and Africa remain smaller collagen markets, but countries like Brazil, Argentina, and South Africa are showing growing demand, primarily through pharmacies and e-commerce platforms.

Competitive Landscape
The global collagen market exhibits high consolidation, as the top 5 players are Rousselot (Darling Ingredients), GELITA, PB Leiner (Tessenderlo Group), Nitta Gelatin, and Weishardt. Strategic moves center on vertical integration, with leading producers acquiring hide procurement networks and investing in enzymatic hydrolysis capacity to capture margin across the value chain. Darling Ingredients' December 2025 definitive agreement with Tessenderlo Group to form Nextida, a joint venture combining their collagen and gelatin businesses into a USD 1.5 billion revenue entity with an annual capacity of 200,000 metric tons, exemplifies the scale-driven consolidation reshaping the industry.
Patent filings reveal that competitive differentiation increasingly hinges on bioprocessing innovations, with Geltor holding multiple patents on recombinant collagen production via microbial fermentation and GELITA securing intellectual property around peptide molecular weight optimization for targeted health benefits. White-space opportunities are emerging in precision-fermented collagen and halal-certified ingredients, where regulatory approvals and certification costs create entry barriers that favor well-capitalized players. GELITA's acquisition of Turkish SelJel positions it to serve Middle East and North Africa markets where halal certification is non-negotiable, while Geltor's FDA GRAS approval for microbial collagen opens pathways in vegan and kosher segments that animal-derived sources cannot address. Smaller disruptors are targeting direct-to-consumer channels with premium positioning, though their lack of backward integration into raw material sourcing limits margin expansion.
Technology adoption is uneven, with leading players investing in continuous enzymatic hydrolysis reactors and membrane filtration systems to improve yield and reduce water consumption, while smaller producers rely on batch processing with higher unit costs. The competitive intensity is highest in commodity bovine collagen for food applications, where price competition compresses margins, whereas marine collagen and pharmaceutical-grade segments offer better pricing power due to differentiation and regulatory barriers.
Collagen Industry Leaders
Darling Ingredients Inc.
GELITA AG
Italgelatine SpA
Nippi. Inc.
Nitta Gelatin Inc.
- *Disclaimer: Major Players sorted in no particular order

Recent Industry Developments
- December 2025: Greenvit has acquired a majority stake in Synkol, a Polish producer of hydrolyzed type II collagen from chicken sternal cartilage, marketed as HYACOLL for joint, bone, and mobility supplements. This bolsters Greenvit's nutraceutical portfolio alongside berry extracts like Aronvit.
- September 2025: Meiji has introduced Amino Collagen NMN, a fish-derived powder blending 5,000mg collagen peptides and 250mg NMN per serving. Anti-counterfeit packaging features a magnified "AminoCollagen" authenticity mark.
- February 2024: Evonik launched Vecollage Fortify L, a skin-identical vegan collagen produced via fermentation technology in partnership with Modern Meadow Inc., targeting anti-aging and hydrating creams in beauty and personal care.


Global Collagen Market Report Scope
Animal Based, Marine Based are covered as segments by Form. Animal Feed, Food and Beverages, Personal Care and Cosmetics, Supplements are covered as segments by End User. Africa, Asia-Pacific, Europe, Middle East, North America, South America are covered as segments by Region.By Source
| Animal-based |
| Marine-based |
By Form
| Powder |
| Liquid |
By Application
| Food and Beverages |
| Dietary Supplements |
| Personal Care and Cosmetics |
| Pharmaceuticals |
| Animal Nutrition |
By Geography
| North America | United States |
| Canada | |
| Mexico | |
| Rest of North America | |
| Europe | Germany |
| United Kingdom | |
| France | |
| Italy | |
| Spain | |
| Russia | |
| Netherlands | |
| Belgium | |
| Poland | |
| Rest of Europe | |
| Asia-Pacific | India |
| China | |
| Japan | |
| Australia | |
| South Korea | |
| Rest of Asia-Pacific | |
| South America | Brazil |
| Argentina | |
| Rest of South America | |
| Middle East and Africa | South Africa |
| Saudi Arabia | |
| Rest of Middle East and Africa |
| By Source | Animal-based | |
| Marine-based | ||
| By Form | Powder | |
| Liquid | ||
| By Application | Food and Beverages | |
| Dietary Supplements | ||
| Personal Care and Cosmetics | ||
| Pharmaceuticals | ||
| Animal Nutrition | ||
| By Geography | North America | United States |
| Canada | ||
| Mexico | ||
| Rest of North America | ||
| Europe | Germany | |
| United Kingdom | ||
| France | ||
| Italy | ||
| Spain | ||
| Russia | ||
| Netherlands | ||
| Belgium | ||
| Poland | ||
| Rest of Europe | ||
| Asia-Pacific | India | |
| China | ||
| Japan | ||
| Australia | ||
| South Korea | ||
| Rest of Asia-Pacific | ||
| South America | Brazil | |
| Argentina | ||
| Rest of South America | ||
| Middle East and Africa | South Africa | |
| Saudi Arabia | ||
| Rest of Middle East and Africa | ||


Market Definition
- End User - The Protein Ingredients Market operates on a B2B basis. Food, Beverages, Supplements, Animal Feed, and Personal Care & Cosmetic manufacturers are considered to be end-consumers in the market studied. The scope excludes manufacturers buying liquid/dry whey to be used for application as a binding agent or thickener or other non-protein applications.
- Penetration Rate - Penetration Rate is defined as the percentage of Protein-Fortified End User Market Volume in the Overall End User Market Volume.
- Average Protein Content - Average protein content is the average protein content present per 100 g of product manufactured by all end-user companies considered under the scope of this report.
- End User Market Volume - End-user market volume is the consolidated volume of all types and forms of end-user products in the country or region.
| Keyword | Definition |
|---|---|
| Alpha-lactalbumin (α-Lactalbumin) | It is a protein that regulates the production of lactose in the milk of almost all mammalian species. |
| Amino acid | It is an organic compound that contains both amino and carboxylic acid functional groups, which are required for the synthesis of body protein and other important nitrogen-containing compounds, such as creatine, peptide hormones, and some neurotransmitters. |
| Blanching | It is the process of briefly heating vegetables with steam or boiling water. |
| BRC | British Retail Consortium |
| Bread improver | It is a flour-based blend of several components with specific functional properties designed to modify dough characteristics and give quality attributes to bread. |
| BSF | Black Soldier Fly |
| Caseinate | It is a substance produced by adding an alkali to acid casein, a derivative of casein. |
| Celiac disease | Celiac disease is an immune reaction to eating gluten, a protein found in wheat, barley, and rye. |
| Colostrum | It is a milky fluid that’s released by mammals that have recently given birth before breast milk production begins. |
| Concentrate | It is the least processed form of protein and has a protein content ranging from 40-90% by weight. |
| Dry protein basis | It refers to the percentage of "pure protein" present in a supplement after the water in it is completely removed through heat. |
| Dry whey | It is the product resulting from drying fresh whey which has been pasteurized and to which nothing has been added as a preservative. |
| Egg protein | It is a mixture of individual proteins, including ovalbumin, ovomucoid, ovoglobulin, conalbumin, vitellin, and vitellenin. |
| Emulsifier | It is a food additive that facilitates the blending of foods that are immiscible with one another, such as oil and water. |
| Enrichment | It is the process of addition of micronutrients that are lost during the processing of the product. |
| ERS | Economic Research Service of the USDA |
| Extrusion | It is the process of forcing soft mixed ingredients through an opening in a perforated plate or die designed to produce the required shape. The extruded food is then cut to a specific size by blades. |
| Fava | Also known as Faba, it is another word for yellow split beans. |
| FDA | Food and Drug Administration |
| Flaking | It is a process in which typically a cereal grain (like corn, wheat, or rice) is broken down into grits, cooked with flavors and syrups, and then pressed into flakes between cooled rollers. |
| Foaming agent | It is a food ingredient that makes it possible to form or maintain a uniform dispersion of a gaseous phase in a liquid or solid food. |
| Foodservice | It refers to the part of the food industry which includes businesses, institutions, and companies which prepare meals outside the home. It includes restaurants, school and hospital cafeterias, catering operations, and many other formats. |
| Fortification | It is the deliberate addition of micronutrients that are not found in them naturally or which are lost during processing, to improve a food product's nutritional value. |
| FSANZ | Food Standards Australia New Zealand |
| FSIS | Food Safety and Inspection Service |
| FSSAI | Food Safety and Standards Authority of India |
| Gelling agent | It is an ingredient that functions as a stabilizer and thickener to provide thickening without stiffness through the formation of gel. |
| GHG | Greenhouse Gas |
| Gluten | It is a family of proteins found in grains, including wheat, rye, spelt, and barley. |
| Hemp | It is a botanical class of Cannabis sativa cultivars grown specifically for industrial or medicinal use. |
| Hydrolysate | It is a form of protein manufactured by exposing the protein to enzymes that can partially break the bonds between the protein's amino acids and break down large, complicated proteins into smaller pieces. Its processing makes it easier and quicker to digest. |
| Hypoallergenic | It refers to a substance that causes fewer allergic reactions. |
| Isolate | It is the purest and most processed form of protein which has undergone separation to obtain a pure protein fraction. It typically contains ≥ 90% of protein by weight. |
| Keratin | It is a protein that helps form hair, nails, and the outer layer of skin. |
| Lactalbumin | It is the albumin contained in milk and obtained from whey. |
| Lactoferrin | It is an iron‑binding glycoprotein that is present in the milk of most mammals. |
| Lupin | It is the yellow legume seeds of the genus Lupinus. |
| Millenial | Also known as Generation Y or Gen Y, it refers to the people born from 1981 to 1996. |
| Monogastric | It refers to an animal with a single-compartmented stomach. Examples of monogastric include humans, poultry, pigs, horses, rabbits, dogs, and cats. Most monogastric are generally unable to digest much cellulose food materials such as grasses. |
| MPC | Milk protein concentrate |
| MPI | Milk protein isolate |
| MSPI | Methylated soy protein isolate |
| Mycoprotein | Mycoprotein is a form of single-cell protein, also known as fungal protein, derived from fungi for human consumption. |
| Nutricosmetics | It is a category of products and ingredients that act as nutritional supplements to care for skin, nails, and hair natural beauty. |
| Osteoporosis | It is a medical condition in which the bones become brittle and fragile from loss of tissue, typically as a result of hormonal changes, or deficiency of calcium or vitamin D. |
| PDCAAS | Protein digestibility-corrected amino acid score (PDCAAS) is a method of evaluating the quality of a protein based on both the amino acid requirements of humans and their ability to digest it. |
| Per-capita consumption of animal protein | It is the average amount of animal protein (such as milk, whey, gelatin, collagen, and egg proteins) that is readily available for consumption by each person in an actual population. |
| Per-capita consumption of plant protein | It is the average amount of plant protein (such as soy, wheat, pea, oat, and hemp proteins) that is readily available for consumption by each person in an actual population. |
| Quorn | It is a microbial protein manufactured using mycoprotein as an ingredient, in which the fungus culture is dried and mixed with egg albumen or potato protein, which acts as a binder, and then is adjusted in texture and pressed into various forms. |
| Ready-to-Cook (RTC) | It refers to food products that include all of the ingredients, where some preparation or cooking is required through a process that is given on the package. |
| Ready-to-Eat (RTE) | It refers to a food product prepared or cooked in advance, with no further cooking or preparation required before being eaten. |
| RTD | Ready-to-Drink |
| RTS | Ready-to-Serve |
| Saturated fat | It is a type of fat in which the fatty acid chains have all single bonds. It is generally considered unhealthy. |
| Sausage | It is a meat product made of finely chopped and seasoned meat, which may be fresh, smoked, or pickled and which is then usually stuffed into a casing. |
| Seitan | It is a plant-based meat substitute made out of wheat gluten. |
| Softgel | It is a gelatin-based capsule with a liquid fill. |
| SPC | Soy protein concentrate |
| SPI | Soy protein isolate |
| Spirulina | It is a biomass of cyanobacteria that can be consumed by humans and animals. |
| Stabilizer | It is an ingredient added to food products to help maintain or enhance their original texture, and physical and chemical characteristics. |
| Supplementation | It is the consumption or provision of concentrated sources of nutrients or other substances that are intended to supplement nutrients in the diet and is intended to correct nutritional deficiencies. |
| Texturant | It is a specific type of food ingredient that is used to control and alter the mouthfeel and texture of food and beverage products. |
| Thickener | It is an ingredient that is used to increase the viscosity of a liquid or dough and make it thicker, without substantially changing its other properties. |
| Trans fat | Also called trans-unsaturated fatty acids or trans fatty acids, it is a type of unsaturated fat that naturally occurs in small amounts in meat. |
| TSP | Textured soy protein |
| TVP | Textured vegetable protein |
| WPC | Whey protein concentrate |
| WPI | Whey protein isolate |


Research Methodology
Mordor Intelligence follows a four-step methodology in all our reports.
- Step-1: Identify Key Variables: The quantifiable key variables (industry and extraneous) pertaining to the specific product segment and country are selected from a group of relevant variables & factors based on desk research & literature review; along with primary expert inputs. These variables are further confirmed through regression modeling (wherever required).
- Step-2: Build a Market Model: In order to build a robust forecasting methodology, the variables and factors identified in Step-1 are tested against available historical market numbers. Through an iterative process, the variables required for market forecast are set and the model is built on the basis of these variables.
- Step-3: Validate and Finalize: In this important step, all market numbers, variables and analyst calls are validated through an extensive network of primary research experts from the market studied. The respondents are selected across levels and functions to generate a holistic picture of the market studied.
- Step-4: Research Outputs: Syndicated Reports, Custom Consulting Assignments, Databases & Subscription Platforms


