Market Overview
| Study Period | 2021 - 2031 |
|---|---|
| Forecast Data Period | 2026 - 2031 |
| Historical Data Period | 2021 - 2024 |
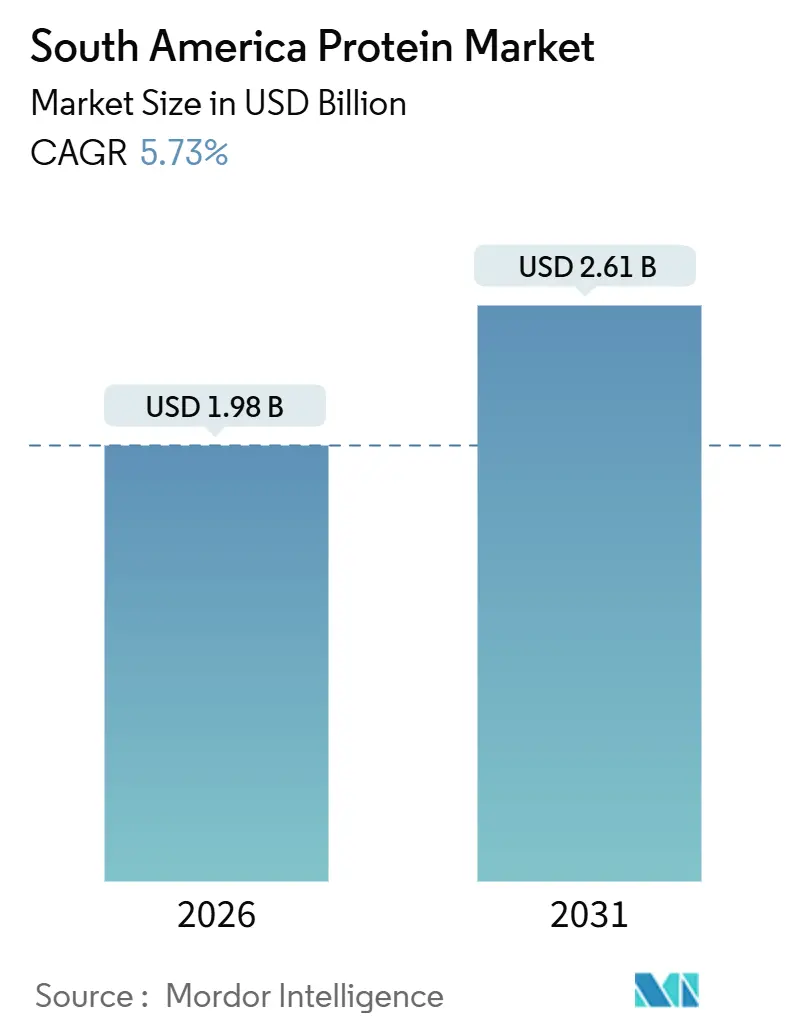
| Market Size (2025) | USD 1.98 Billion |
| Market Size (2030) | USD 2.61 Billion |
| Growth Rate (2026 - 2031) | 5.73% CAGR |
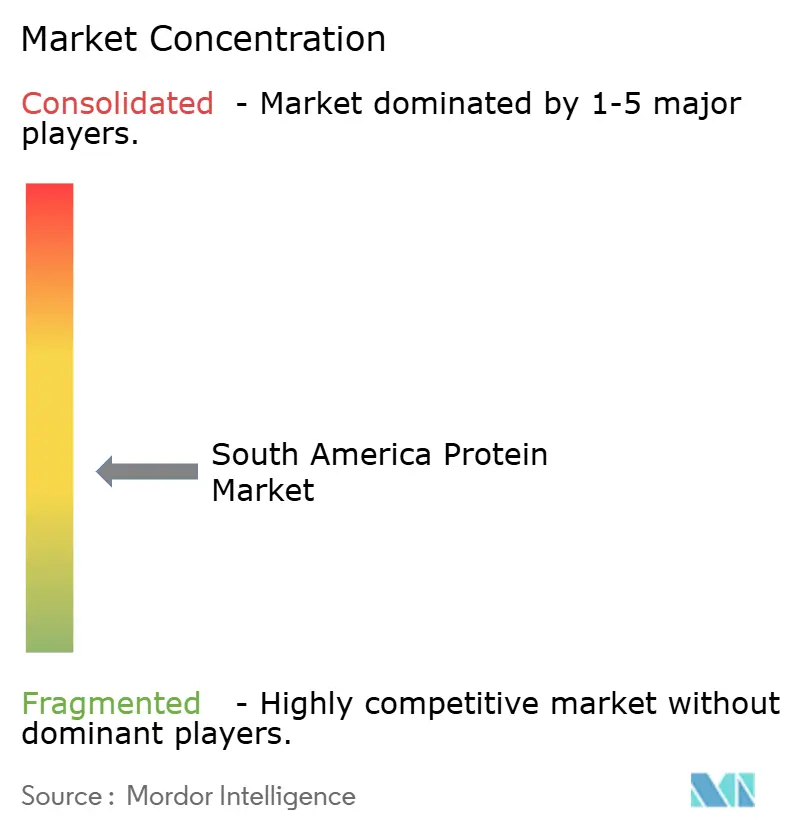
| Market Concentration | Medium |
Major Players
*Disclaimer: Major Players sorted in no particular order Image © Mordor Intelligence. Reuse requires attribution under CC BY 4.0. |
|
South America Protein Market Analysis by Mordor Intelligence
The South America protein market size is valued to be USD 1.98 billion in 2026 and is forecast to climb to USD 2.61 billion by 2031, advancing at a 5.73% CAGR over the period. This tempered trajectory follows the region’s 5.77% CAGR between 2020 and 2025 and signals a shift from post-pandemic rebound to steadier, supply-chain-anchored growth. Plant proteins, led by soy, already dominate but still post the quickest gains as urban flexitarian diets spread from São Paulo and Buenos Aires to secondary cities. Integrated oilseed-to-protein value chains now shape margin capture, with the 2025 Bunge-Viterra merger and Cargill’s takeover of SJC Bioenergia illustrating how multinationals leverage scale to manage raw-material volatility. Meanwhile, sustainability compliance, especially the European Union Deforestation Regulation, raises traceability costs that tilt competitive advantage toward processors with satellite monitoring and digital sourcing systems.
Key Report Takeaways
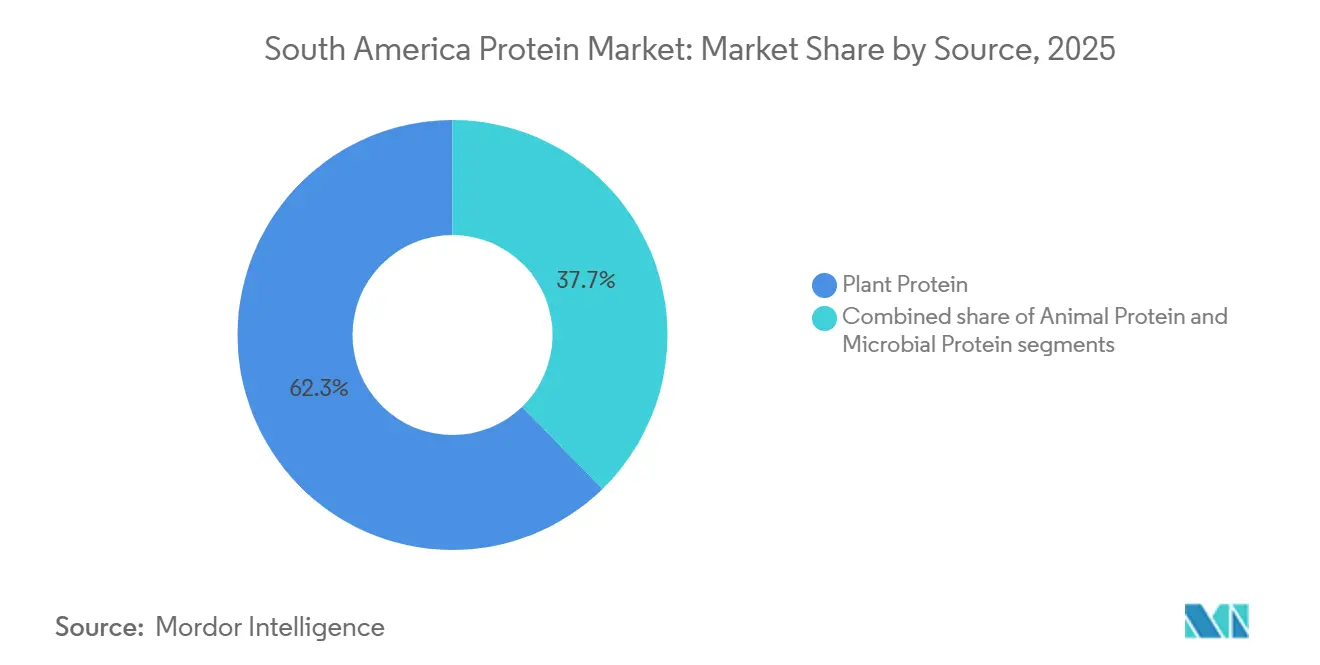
- By source, plant proteins led with 62.29% South America protein market share in 2025 and are projected to post a 7.34% CAGR through 2031.
- By end user, food and beverages captured 61.83% of the South American protein market size in 2025, while personal care and cosmetics are poised for the fastest 7.04% CAGR to 2031.
- By country, Brazil held 60.18% South American protein market share in 2025 and is forecast to expand at a 6.75% CAGR through 2031.
Note: Market size and forecast figures in this report are generated using Mordor Intelligence’s proprietary estimation framework, updated with the latest available data and insights as of January 2026.
South America Protein Market Trends and Insights
Drivers Impact Analysis*
| Driver | (~) % Impact on CAGR Forecast | Geographic Relevance | Impact Timeline |
|---|---|---|---|
| Increasing demand for plant-based and vegan alternatives driven by the shift toward flexitarian diets | +1.2% | Brazil (São Paulo, Rio de Janeiro), Argentina (Buenos Aires), Chile (Santiago, Valparaíso) | Medium term (2-4 years) |
| Sports nutrition and preventive health trends | +0.9% | Brazil, Argentina, Chile urban centers; spillover to Colombia, Peru | Medium term (2-4 years) |
| Government incentives to expand soybean and pea-processing capacity | +1.5% | Brazil (Paraná, Santa Catarina, Mato Grosso), Argentina (Santa Fe, Córdoba) | Long term (≥ 4 years) |
| Impact of clean-label trends on protein preferences | +0.8% | Domestic premium retail in Brazil, Chile | Medium term (2-4 years) |
| Surge in extruded-plant-protein contract manufacturing in Paraná and Santa Catarina | +0.6% | Brazil (Paraná, Santa Catarina) | Short term (≤ 2 years) |
| Investments in processing facilities and local acquisitions | +0.7% | Brazil, Argentina; selective expansion in Peru, Colombia | Medium term (2-4 years) |
| Source: Mordor Intelligence | |||


Increasing demand for plant-based and vegan alternatives driven by the shift toward flexitarian diets
The growing preference for plant-based and vegan alternatives is driven by a shift toward flexitarian diets, where consumers reduce meat consumption while prioritizing clean-label products. This trend has positioned the plant protein segment as a market leader, accounting for approximately 63% of the share, supported by increasing vegetarianism and high lactose intolerance rates, which affect 60-80% of the population and drive demand for non-dairy alternatives. A 2024 survey by the Brazilian Vegetarian Society highlights that 7% of Brazil’s population, or around 14 million individuals, identify as vegan or vegetarian, reflecting reduced meat consumption and reinforcing Brazil’s 61% regional leadership, supported by its significant soy production [1]Source: Brazilian Vegetarian Society, "Vegan Market," svb.org.br. Investments in processing facilities and acquisitions by protein ingredient manufacturers, such as Roquette Frères, which supplies pea protein isolates for bakery and dairy alternatives, enable scalable, clean-label innovations for flexitarian consumers seeking allergen-free options. Startups specializing in sustainable pea and soy proteins complement these efforts, aligning with sports nutrition trends where brands like Ingredion provide rice and pea protein ingredients for functional foods. The food and beverages segment, holding a 61% market share, sees strong demand for bakery and dairy alternatives tied to clean-label preferences, with companies like Cargill offering soy protein products replicating animal textures. Agri-tech innovations in Argentina further enhance plant protein yields, driving ethical and health-conscious diversification as plant proteins outpace animal-based counterparts.
Sports nutrition and preventive health trends
Trends in sports nutrition and preventive health are driving growth in the South American protein market, particularly within the supplements and personal care segment, which is the fastest-growing end-user category. Consumers are increasingly focusing on muscle recovery and wellness, supported by rising fitness participation. A 2024 survey by J. Wallin Opinion Research for the Health & Fitness Association revealed that 61% of Latin Americans in select urban areas exercise multiple times weekly, while 78% engage in physical activity at least a few times each month [2]Source: Health & Fitness Association, "2024 Latin America Fitness Consumer Survey," healthandfitness.org. This shift towards health and fitness aligns with the growing adoption of plant-based diets and the high prevalence of lactose intolerance (60-80%), fueling demand for non-dairy protein ingredients in performance shakes. Brazil leads the region with a 60% market share, and food and beverage applications account for 61% of the market. Protein ingredient manufacturers, such as Glanbia Nutritionals, are addressing this demand with whey and plant protein isolates optimized for bioavailability, supporting preventive health and allergen-free options for active flexitarians. Investments in processing facilities are fostering innovations in sustainable pea and soy proteins, catering to gym-goers seeking clean-label recovery solutions, while bakery and dairy alternatives extend these benefits to everyday snacks. Vertical integration ensures reliable supply chain operations, countering fragmented competition and supporting clean-label vegan product launches. Agri-tech advancements in Argentina are enhancing protein yields for fitness formulations, while marine and fishmeal proteins in Peru address diverse athlete needs. Plant proteins are increasingly challenging animal-based dominance through health-focused diversification, with Glanbia’s offerings bridging preventive wellness and performance in urban fitness markets.
Government incentives to expand soybean and pea-processing capacity
Government incentives to expand soybean and pea-processing capacities are driving growth in the protein market across South America. These initiatives channel subsidized financing into value-added production, significantly benefiting Brazil, which holds a 61% regional market share due to its strong soy production. Brazil's Plano Safra 2024/25 allocated USD 88.2 billion (BRL 475.5 billion) in subsidized credit to agricultural producers and processors, targeting a 12% increase in domestic soybean crushing capacity by 2027. This approach reduces reliance on raw bean exports and enhances domestic value-added protein meal production, as reported by USDA Brazil. The policy ensures a stable feedstock supply and lowers costs for protein ingredient manufacturers, such as Bunge, enabling scalable production of soy protein concentrates for bakery and dairy alternatives, particularly relevant given the high lactose intolerance rates in the region. In addition, vertical integration by companies strengthens supply chain control, addressing fragmented competition in a market where plant proteins account for approximately 63% of the market share. In Argentina, export tax differentials, 31% for soybean meal versus 33% for raw beans in 2025, encourage domestic crushing and protein concentrate production, though political uncertainty under the Milei administration raises concerns about policy continuity [3]Source: U.S. Department of Agriculture (USDA), "Argentina Permanently Lowers Ag Export Taxes - August 2025," apps.fas.usda.gov . These measures also support sports nutrition trends and food and beverage applications, which hold a 61% market share, reinforcing plant protein leadership over animal-based segments and meeting the demands of flexitarian consumers and preventive health trends.
Impact of clean-label trends on protein preferences
The clean-label trend is reshaping protein ingredient preferences, compelling food and beverage manufacturers to prioritize transparency, simplicity, and natural sourcing across the supply chain. Consumer demand for minimally processed, recognizable protein components, combined with regulatory pressures for clear labeling in countries like Brazil and Argentina, is driving the adoption of plant-based proteins that align with clean-label standards. Suppliers are increasingly offering options such as pea and soy proteins, which are naturally non-GMO and allergen-friendly, making them suitable for transparent labeling and appealing to health-conscious, label-aware consumers. Ingredion’s VITESSENCE® pea protein isolates, for example, provide clean-label, non-GMO, gluten-free solutions that enable brands to meet consumer expectations for simple ingredient lists while enhancing nutritional profiles in products like beverages and snacks. Similarly, Cargill’s PURIS™ pea protein offers organic and non-GMO certified ingredients that support clean-label formulations and cater to the growing preference for natural, traceable components. These trends underscore a shift toward plant-based, transparent protein ingredients, with suppliers aligning their production and sourcing strategies to meet evolving consumer expectations and regulatory requirements, while avoiding unnecessary additives or complex formulations.
Restraints Impact Analysis*
| Restraint | (~) % Impact on CAGR Forecast | Geographic Relevance | Impact Timeline |
|---|---|---|---|
| Volatile raw-material prices | -0.6% | Brazil, Argentina (soybean, pea); spillover to Peru, Colombia (import-dependent) | Short term (≤ 2 years) |
| High costs of premium plant protein processing | -0.4% | Brazil, Argentina (non-GMO, organic certification); Chile (import-dependent specialty proteins) | Medium term (2-4 years) |
| Supply chain disruptions from macro volatility | -0.3% | Regional (currency fluctuations, port congestion); Argentina (policy uncertainty) | Short term (≤ 2 years) |
| Stringent sustainability compliance burdens | -0.5% | Brazil (EUDR traceability), Argentina (export certification); Chile (import standards) | Long term (≥ 4 years) |
| Source: Mordor Intelligence | |||
Volatile raw-material prices
Volatile raw material prices present a significant challenge for protein ingredient manufacturers in South America, disrupting cost planning and margin stability. For example, soybean prices in Brazil dropped by 6–6.5% in August 2024 due to record harvests; however, factors such as La Niña-driven droughts and shifts in Argentina's export tax policies continue to cause sharp quarterly fluctuations in regional crush margins, complicating pricing strategies. This instability impacts suppliers reliant on consistent soybean meal and isolate inputs for protein concentrates used in food and feed applications. Net importers like Peru and Colombia face additional challenges, as sudden regional price spikes lead to pass-through inflation, limiting their ability to scale domestic protein processing without long-term procurement contracts to stabilize feedstock costs. Manufacturers increasingly prefer vertically integrated or globally diversified suppliers to mitigate sourcing risks. Companies like Bunge and Louis Dreyfus Company, with operations spanning soybean origination, crushing, and protein ingredient processing in South America, are better positioned to manage raw material shocks and ensure supply continuity. In contrast, smaller regional processors without hedging capabilities face margin compression, restricting their capacity for expansion and innovation. This environment reinforces buyer preference for large-scale suppliers with risk management expertise, slowing market growth and investment in the region.
High costs of premium plant protein processing
High costs associated with premium plant protein processing present a significant challenge, constraining scalability and commercial viability for clean-label ingredient formats in South America. Non-GMO and organic soy protein isolates command 30–50% price premiums over conventional variants, while Brazil’s limited non-GMO soy acreage creates persistent supply bottlenecks for exporters targeting EU and North American clean-label standards. These shortages heighten procurement risks and restrict consistent supply volumes for protein ingredient manufacturers. Certification costs for organic and non-GMO status further add USD 50–80 per tonne to processing expenses, disproportionately affecting smaller regional processors with limited pricing power. As a result, many suppliers pass these higher costs downstream, reducing adoption in price-sensitive domestic food and beverage markets. Larger processors with vertically integrated sourcing and certification infrastructure are better positioned to navigate these challenges. For example, Caramuru Alimentos in Brazil has invested in identity-preserved non-GMO soy crushing and protein ingredient production to support export-grade formulations, though volume scalability remains constrained. Consequently, premium plant protein is concentrated in export-oriented applications rather than mass domestic use, with elevated processing and certification costs continuing to hinder broader adoption across the region.
*Our forecasts treat driver/restraint impacts as directional, not additive. The impact forecasts reflect baseline growth, mix effects, and variable interactions.
Segment Analysis
By Source: Soy Dominance Masks Microbial Protein Emergence
Plant proteins represented 62.29% of the market share in 2025 and are projected to grow at a CAGR of 7.34% through 2031. Soy protein, including textured soy protein, soy isolates, and soy concentrates, benefits from Brazil's position as the largest soybean producer. Pea protein is gaining momentum in Argentina, driven by crop rotation practices to enhance soil nitrogen levels and premium export opportunities for yellow peas used in European plant-based meat production. However, limited domestic processing capacity in Argentina restricts the production of value-added protein concentrates, with most peas exported as raw produce. Wheat protein, particularly vital wheat gluten, faces competition from imported European gluten with superior functional properties, while rice, potato, and hemp proteins remain niche due to regulatory and functional constraints.
Animal proteins, including whey, collagen, and egg protein, held a significant share in 2025. Whey protein benefits from the expansion of Brazil's dairy sector, while collagen and gelatin, derived from regional beef and pork processing, are increasingly utilized in personal care and nutraceutical applications. Egg protein remains a premium segment but is constrained by limited domestic fractionation capacity and reliance on imports for high-purity egg white powder. Microbial proteins, such as algae and mycoprotein, are the fastest-growing segment, though scalability and regulatory hurdles limit their broader adoption. Algae protein is used in aquaculture feed and functional food fortification, while mycoprotein, derived from fungal fermentation, requires extensive safety documentation for approval in key markets.


By End User: Personal Care Outpaces Food Growth
Food and beverages accounted for 61.83% of end-user demand in 2025, while personal care and cosmetics emerged as the fastest-growing segment with a CAGR of 7.04%. This growth is attributed to the increasing use of collagen and keratin hydrolysates sourced from regional abattoirs to meet clean-label and traceability requirements in export markets. The meat, poultry, seafood, and alternatives category is expanding rapidly, supported by the Marfrig-ADM PlantPlus Foods joint venture, which supplies textured soy protein to Brazilian foodservice chains. Beverages, particularly protein-fortified juices and ready-to-drink shakes, are gaining traction in urban centers, with innovations such as Arla Foods Ingredients’ protein juice drink solution introduced in August 2025. Bakery, breakfast cereals, and snacks are incorporating soy and whey proteins for fortification, though taste and texture challenges limit protein loading to 10-15% by weight. RTE/RTC foods and condiments/sauces are increasingly using proteins as functional binders and emulsifiers, with clean-label trends favoring egg and pea proteins over modified starches.
Supplements represent a significant market share, led by sports and dietary supplements, followed by baby food, infant formula, and elderly and medical nutrition. Infant formula faces strict compositional requirements under Codex Alimentarius standards (CXS 72-1981), limiting the use of novel plant proteins without clinical trials to demonstrate nutritional equivalence. In Chile, the elderly and medical nutrition segment is growing due to an aging population, driving demand for hydrolyzed proteins and amino acid blends. Additionally, animal feed remains a key segment, with soybean meal dominating poultry and swine rations. In personal care and cosmetics, collagen peptides and keratin hydrolysates are widely used in anti-aging and hair care formulations, with Brazilian suppliers meeting EUDR traceability requirements for export markets.

Geography Analysis
Brazil is expected to maintain a dominant position in the protein market, with a projected 60.18% market share in 2025 and a compound annual growth rate (CAGR) of 6.75% through 2031. This leadership is driven by its status as the largest global soybean producer and a growing hub for value-added protein ingredients. The OECD-FAO Agricultural Outlook 2025-2034 forecasts Brazil's soybean production to reach 169 million tonnes by 2034, ensuring a cost advantage in feedstock that competitors cannot replicate. Additionally, Paraná and Santa Catarina have emerged as key regions for contract manufacturing of extruded plant proteins.
Argentina, the second-largest market, benefits from export tax policies that favor processed products, with soybean meal taxed at 31% compared to 33% for raw soybeans. This incentivizes domestic crushing and protein concentrate production. However, political uncertainty under the Milei administration raises concerns about long-term policy stability. Farmers are increasingly incorporating yellow peas into crop rotations to capture premium export prices from European plant-based meat manufacturers. Despite this diversification, limited domestic crushing capacity results in most yellow pea production being exported as raw peas rather than processed protein concentrates.
Smaller markets such as Peru, Colombia, and Chile rely heavily on imports for specialty proteins. USDA FAS Peru reports that soybeans and soybean meal are primarily sourced from Brazil and Argentina, with trade flows influenced by regional crop production and logistics. In Chile, growing consumer demand for high-protein, convenient products is driving the expansion of private-label offerings and processing capacity, creating opportunities for premium whey and specialized dairy proteins. Meanwhile, countries like Paraguay, Uruguay, Ecuador, and Bolivia exhibit modest growth, driven by expanding poultry and aquaculture sectors, but remain dependent on imports due to limited domestic processing capabilities.
Competitive Landscape
The protein ingredients market in South America is characterized by moderate fragmentation. Multinational processors such as ADM, Cargill, and Ingredion dominate large-volume soy, wheat, and corn protein ingredients through integrated origination and crushing networks. These companies leverage their scale, global application labs, and export infrastructure to meet the demands of multinational food manufacturers for consistent quality and supply security. Meanwhile, regional specialists like Gelnex in Brazil have established strong positions in collagen peptides by utilizing proximity to bovine raw materials and adhering to pharmaceutical-grade processing standards. This coexistence of scale-driven efficiency and niche specialization shapes procurement strategies across food, beverage, and nutrition applications.
Regional processors are increasingly focusing on niche segments, including clean-label collagen peptides, non-GMO soy isolates, and contract manufacturing for plant-based meat analogs. Companies such as Caramuru Alimentos have expanded their offerings of identity-preserved non-GMO soy protein isolates to cater to export-oriented clean-label applications, particularly for EU and North American markets. These regional players differentiate themselves through customized functionality, traceability, and faster product iteration cycles rather than competing on volume. This specialization enables them to integrate more deeply into customer research and development pipelines, fostering long-term partnerships. As a result, competition is shifting from price-based dynamics to performance in applications and compliance with clean-label standards, reinforcing the strategic importance of mid-sized regional manufacturers.
Opportunities in microbial proteins, such as algae and mycoprotein, remain underdeveloped due to high production costs and regulatory challenges. However, these proteins offer potential differentiation for allergen-free and sustainability-focused formulations. Startups in Brazil and Argentina are leveraging EMBRAPA’s research on lentil and chickpea protein concentrates to develop novel plant proteins with lower allergen profiles than soy. Scaling these innovations beyond pilot production requires significant investment, fermentation infrastructure, and partnerships with established processors. Ingredient groups like Tereos, with existing expertise in plant-based starches and proteins, are well-positioned to integrate these novel proteins into their supply chains. This dynamic highlights the role of collaboration in driving the long-term evolution of South America’s protein ingredients market.
South America Protein Industry Leaders
-
Archer Daniels Midland Company
-
Kerry Group plc
-
Ingredion Incorporated
-
BRF S.A.
-
Cargill Incorporated
- *Disclaimer: Major Players sorted in no particular order

Recent Industry Developments
- December 2025: Brazilian food tech company Typcal established Latin America’s first large-scale mycelium fermentation facility in Pinhais, near Curitiba. This development followed a USD 2 million (BRL 10 million) fundraising round supported by local investors and the Belgian accelerator Biotope. The facility enabled Typcal to transition to commercial-scale production of mycelium-based protein ingredients, with plans to commence sales in Latin America and Europe by 2026. This initiative aimed to drive product expansion and innovation in sustainable protein solutions.
- December 2025: Brazilian authorities approved Arla Foods Ingredients' Lacprodan MFGM-10 for inclusion in food and beverage products where whey protein concentrate was permitted. Lacprodan MFGM-10 was part of Arla Foods Ingredients' MFGM product range, combining whey protein with complex milk lipids and additional nutrients.
- February 2025: Arla Foods Ingredients introduced a toolbox aimed at supporting South American functional food manufacturers in developing high-protein, dairy-based desserts. This solution included 12 recipes utilizing its Nutrilac ProteinBoost range, enabling the production of low-fat desserts with a creamy and smooth texture.


South America Protein Market Report Scope
Animal, Microbial, Plant are covered as segments by Source. Animal Feed, Food and Beverages, Personal Care and Cosmetics, Supplements are covered as segments by End User. Argentina, Brazil are covered as segments by Country.
By Source
| Animal | Casein and Caseinates |
| Collagen | |
| Egg Protein | |
| Gelatin | |
| Insect Protein | |
| Milk Protein | |
| Whey Protein | |
| Other Animal Protein | |
| Microbial | Algae Protein |
| Mycoprotein | |
| Plant | Hemp Protein |
| Pea Protein | |
| Potato Protein | |
| Rice Protein | |
| Soy Protein | |
| Wheat Protein | |
| Other Plant Protein |
By End User
| Animal Feed | |
| Food and Beverages | Bakery |
| Beverages | |
| Breakfast Cereals | |
| Condiments/Sauces | |
| Confectionery | |
| Dairy and Dairy Alternatives | |
| Meat/Poultry/Seafood and Alternatives | |
| RTE/RTC Foods | |
| Snacks | |
| Personal Care and Cosmetics | |
| Supplements | Baby Food and Infant Formula |
| Elderly and Medical Nutrition | |
| Sport and Dietary Supplements |
By Country
| Brazil |
| Argentina |
| Peru |
| Colombia |
| Chile |
| Rest of South America |
| By Source | Animal | Casein and Caseinates |
| Collagen | ||
| Egg Protein | ||
| Gelatin | ||
| Insect Protein | ||
| Milk Protein | ||
| Whey Protein | ||
| Other Animal Protein | ||
| Microbial | Algae Protein | |
| Mycoprotein | ||
| Plant | Hemp Protein | |
| Pea Protein | ||
| Potato Protein | ||
| Rice Protein | ||
| Soy Protein | ||
| Wheat Protein | ||
| Other Plant Protein | ||
| By End User | Animal Feed | |
| Food and Beverages | Bakery | |
| Beverages | ||
| Breakfast Cereals | ||
| Condiments/Sauces | ||
| Confectionery | ||
| Dairy and Dairy Alternatives | ||
| Meat/Poultry/Seafood and Alternatives | ||
| RTE/RTC Foods | ||
| Snacks | ||
| Personal Care and Cosmetics | ||
| Supplements | Baby Food and Infant Formula | |
| Elderly and Medical Nutrition | ||
| Sport and Dietary Supplements | ||
| By Country | Brazil | |
| Argentina | ||
| Peru | ||
| Colombia | ||
| Chile | ||
| Rest of South America | ||


Market Definition
- End User - The Protein Ingredients Market operates on a B2B basis. Food, Beverages, Supplements, Animal Feed, and Personal Care & Cosmetic manufacturers are considered to be end-consumers in the market studied. The scope excludes manufacturers buying liquid/dry whey to be used for application as a binding agent or thickener or other non-protein applications.
- Penetration Rate - Penetration Rate is defined as the percentage of Protein-Fortified End User Market Volume in the Overall End User Market Volume.
- Average Protein Content - Average protein content is the average protein content present per 100 g of product manufactured by all end-user companies considered under the scope of this report.
- End User Market Volume - End-user market volume is the consolidated volume of all types and forms of end-user products in the country or region.
| Keyword | Definition |
|---|---|
| Alpha-lactalbumin (α-Lactalbumin) | It is a protein that regulates the production of lactose in the milk of almost all mammalian species. |
| Amino acid | It is an organic compound that contains both amino and carboxylic acid functional groups, which are required for the synthesis of body protein and other important nitrogen-containing compounds, such as creatine, peptide hormones, and some neurotransmitters. |
| Blanching | It is the process of briefly heating vegetables with steam or boiling water. |
| BRC | British Retail Consortium |
| Bread improver | It is a flour-based blend of several components with specific functional properties designed to modify dough characteristics and give quality attributes to bread. |
| BSF | Black Soldier Fly |
| Caseinate | It is a substance produced by adding an alkali to acid casein, a derivative of casein. |
| Celiac disease | Celiac disease is an immune reaction to eating gluten, a protein found in wheat, barley, and rye. |
| Colostrum | It is a milky fluid that’s released by mammals that have recently given birth before breast milk production begins. |
| Concentrate | It is the least processed form of protein and has a protein content ranging from 40-90% by weight. |
| Dry protein basis | It refers to the percentage of "pure protein" present in a supplement after the water in it is completely removed through heat. |
| Dry whey | It is the product resulting from drying fresh whey which has been pasteurized and to which nothing has been added as a preservative. |
| Egg protein | It is a mixture of individual proteins, including ovalbumin, ovomucoid, ovoglobulin, conalbumin, vitellin, and vitellenin. |
| Emulsifier | It is a food additive that facilitates the blending of foods that are immiscible with one another, such as oil and water. |
| Enrichment | It is the process of addition of micronutrients that are lost during the processing of the product. |
| ERS | Economic Research Service of the USDA |
| Extrusion | It is the process of forcing soft mixed ingredients through an opening in a perforated plate or die designed to produce the required shape. The extruded food is then cut to a specific size by blades. |
| Fava | Also known as Faba, it is another word for yellow split beans. |
| FDA | Food and Drug Administration |
| Flaking | It is a process in which typically a cereal grain (like corn, wheat, or rice) is broken down into grits, cooked with flavors and syrups, and then pressed into flakes between cooled rollers. |
| Foaming agent | It is a food ingredient that makes it possible to form or maintain a uniform dispersion of a gaseous phase in a liquid or solid food. |
| Foodservice | It refers to the part of the food industry which includes businesses, institutions, and companies which prepare meals outside the home. It includes restaurants, school and hospital cafeterias, catering operations, and many other formats. |
| Fortification | It is the deliberate addition of micronutrients that are not found in them naturally or which are lost during processing, to improve a food product's nutritional value. |
| FSANZ | Food Standards Australia New Zealand |
| FSIS | Food Safety and Inspection Service |
| FSSAI | Food Safety and Standards Authority of India |
| Gelling agent | It is an ingredient that functions as a stabilizer and thickener to provide thickening without stiffness through the formation of gel. |
| GHG | Greenhouse Gas |
| Gluten | It is a family of proteins found in grains, including wheat, rye, spelt, and barley. |
| Hemp | It is a botanical class of Cannabis sativa cultivars grown specifically for industrial or medicinal use. |
| Hydrolysate | It is a form of protein manufactured by exposing the protein to enzymes that can partially break the bonds between the protein's amino acids and break down large, complicated proteins into smaller pieces. Its processing makes it easier and quicker to digest. |
| Hypoallergenic | It refers to a substance that causes fewer allergic reactions. |
| Isolate | It is the purest and most processed form of protein which has undergone separation to obtain a pure protein fraction. It typically contains ≥ 90% of protein by weight. |
| Keratin | It is a protein that helps form hair, nails, and the outer layer of skin. |
| Lactalbumin | It is the albumin contained in milk and obtained from whey. |
| Lactoferrin | It is an iron‑binding glycoprotein that is present in the milk of most mammals. |
| Lupin | It is the yellow legume seeds of the genus Lupinus. |
| Millenial | Also known as Generation Y or Gen Y, it refers to the people born from 1981 to 1996. |
| Monogastric | It refers to an animal with a single-compartmented stomach. Examples of monogastric include humans, poultry, pigs, horses, rabbits, dogs, and cats. Most monogastric are generally unable to digest much cellulose food materials such as grasses. |
| MPC | Milk protein concentrate |
| MPI | Milk protein isolate |
| MSPI | Methylated soy protein isolate |
| Mycoprotein | Mycoprotein is a form of single-cell protein, also known as fungal protein, derived from fungi for human consumption. |
| Nutricosmetics | It is a category of products and ingredients that act as nutritional supplements to care for skin, nails, and hair natural beauty. |
| Osteoporosis | It is a medical condition in which the bones become brittle and fragile from loss of tissue, typically as a result of hormonal changes, or deficiency of calcium or vitamin D. |
| PDCAAS | Protein digestibility-corrected amino acid score (PDCAAS) is a method of evaluating the quality of a protein based on both the amino acid requirements of humans and their ability to digest it. |
| Per-capita consumption of animal protein | It is the average amount of animal protein (such as milk, whey, gelatin, collagen, and egg proteins) that is readily available for consumption by each person in an actual population. |
| Per-capita consumption of plant protein | It is the average amount of plant protein (such as soy, wheat, pea, oat, and hemp proteins) that is readily available for consumption by each person in an actual population. |
| Quorn | It is a microbial protein manufactured using mycoprotein as an ingredient, in which the fungus culture is dried and mixed with egg albumen or potato protein, which acts as a binder, and then is adjusted in texture and pressed into various forms. |
| Ready-to-Cook (RTC) | It refers to food products that include all of the ingredients, where some preparation or cooking is required through a process that is given on the package. |
| Ready-to-Eat (RTE) | It refers to a food product prepared or cooked in advance, with no further cooking or preparation required before being eaten. |
| RTD | Ready-to-Drink |
| RTS | Ready-to-Serve |
| Saturated fat | It is a type of fat in which the fatty acid chains have all single bonds. It is generally considered unhealthy. |
| Sausage | It is a meat product made of finely chopped and seasoned meat, which may be fresh, smoked, or pickled and which is then usually stuffed into a casing. |
| Seitan | It is a plant-based meat substitute made out of wheat gluten. |
| Softgel | It is a gelatin-based capsule with a liquid fill. |
| SPC | Soy protein concentrate |
| SPI | Soy protein isolate |
| Spirulina | It is a biomass of cyanobacteria that can be consumed by humans and animals. |
| Stabilizer | It is an ingredient added to food products to help maintain or enhance their original texture, and physical and chemical characteristics. |
| Supplementation | It is the consumption or provision of concentrated sources of nutrients or other substances that are intended to supplement nutrients in the diet and is intended to correct nutritional deficiencies. |
| Texturant | It is a specific type of food ingredient that is used to control and alter the mouthfeel and texture of food and beverage products. |
| Thickener | It is an ingredient that is used to increase the viscosity of a liquid or dough and make it thicker, without substantially changing its other properties. |
| Trans fat | Also called trans-unsaturated fatty acids or trans fatty acids, it is a type of unsaturated fat that naturally occurs in small amounts in meat. |
| TSP | Textured soy protein |
| TVP | Textured vegetable protein |
| WPC | Whey protein concentrate |
| WPI | Whey protein isolate |


Research Methodology
Mordor Intelligence follows a four-step methodology in all our reports.
- Step-1: Identify Key Variables: The quantifiable key variables (industry and extraneous) pertaining to the specific product segment and country are selected from a group of relevant variables & factors based on desk research & literature review; along with primary expert inputs. These variables are further confirmed through regression modeling (wherever required).
- Step-2: Build a Market Model: In order to build a robust forecasting methodology, the variables and factors identified in Step-1 are tested against available historical market numbers. Through an iterative process, the variables required for market forecast are set and the model is built on the basis of these variables.
- Step-3: Validate and Finalize: In this important step, all market numbers, variables and analyst calls are validated through an extensive network of primary research experts from the market studied. The respondents are selected across levels and functions to generate a holistic picture of the market studied.
- Step-4: Research Outputs: Syndicated Reports, Custom Consulting Assignments, Databases & Subscription Platforms


