Market Overview
| Study Period | 2021 - 2031 |
|---|---|
| Forecast Data Period | 2026 - 2031 |
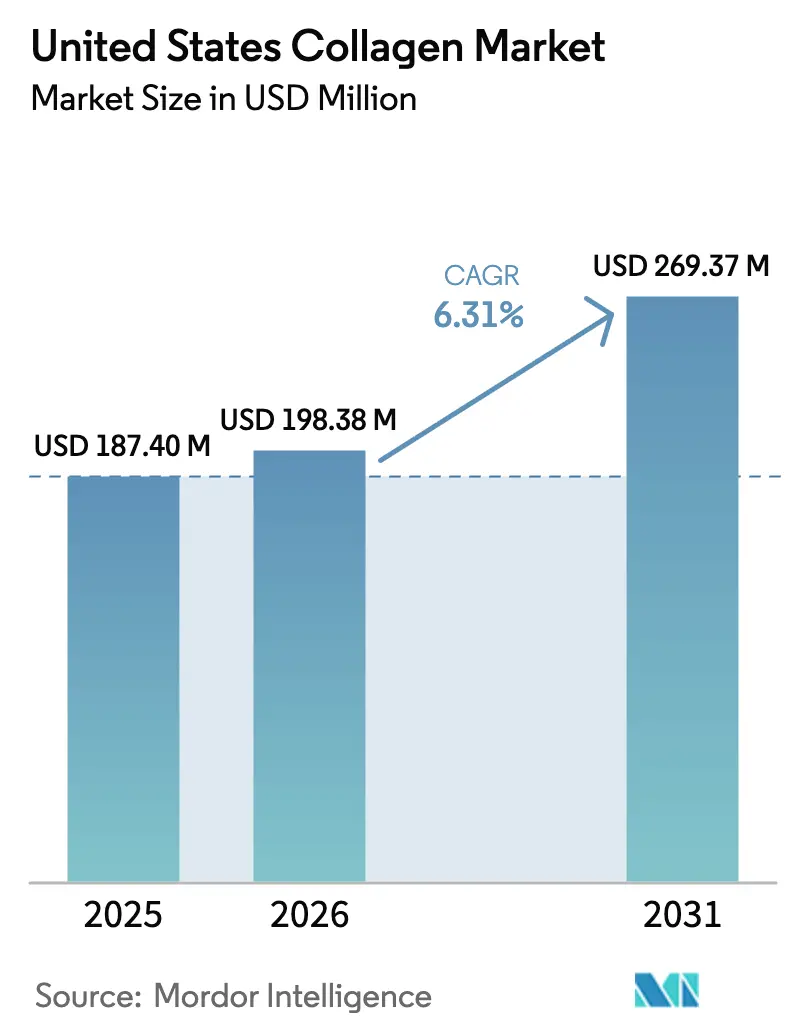
| Base Year Market Size (2025) | USD 187.40 Million |
| Market Size (2026) | USD 198.38 Million |
| Market Size (2031) | USD 269.37 Million |
| Growth Rate (2026 - 2031) | 6.31% CAGR |
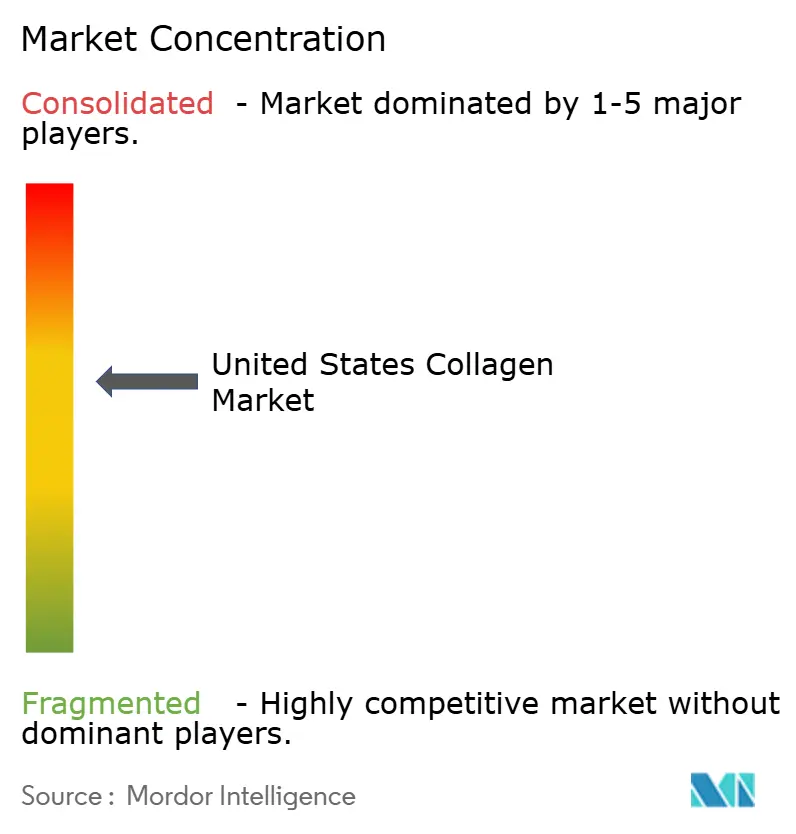
| Market Concentration | Medium |
Major Players*Disclaimer: Major Players sorted in no particular order Image © Mordor Intelligence. Reuse requires attribution under CC BY 4.0. |
|
United States Collagen Market Analysis by Mordor Intelligence
The United States collagen market size is expected to grow from USD 187.40 million in 2025 to USD 198.38 million in 2026 and is forecast to reach USD 269.37 million by 2031 at 6.31% CAGR over 2026-2031. This growth underscores a consistent demand for protein ingredients that effectively combine functionality with a wellness focus. Three key factors drive this expansion: clearer regulations on innovative production methods, an aging population prioritizing joint and skin health, and the seamless incorporation of collagen peptides into everyday foods, beverages, and beauty routines. While animal byproducts remain the primary raw material, marine and fermentation-based alternatives are gaining traction. This shift is fueled by a focus on sustainability, allergen avoidance, and accommodating religious dietary preferences. The market is bifurcating: bulk powders are popular for at-home customization, while premium ready-to-drink options cater to on-the-go consumers, commanding higher price points. Consolidation among upstream suppliers is reducing bargaining power for smaller brands. However, advancements in nutricosmetics, functional beverages, and personalized supplements are broadening the retail presence of collagen in theUnited States.
Key Report Takeaways
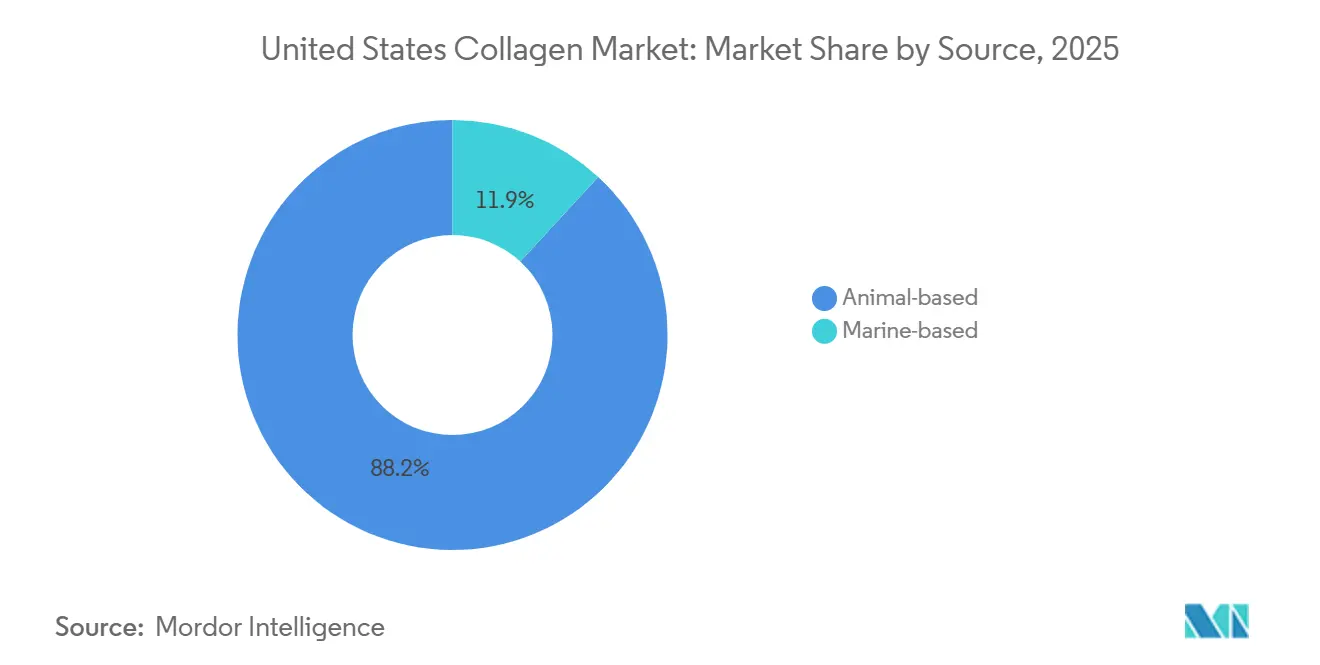
- By source, animal-based collagen held 88.15% of the United States collagen market share in 2025, while marine collagen is forecast to grow at a 7.45% CAGR through 2031, the fastest among sources.
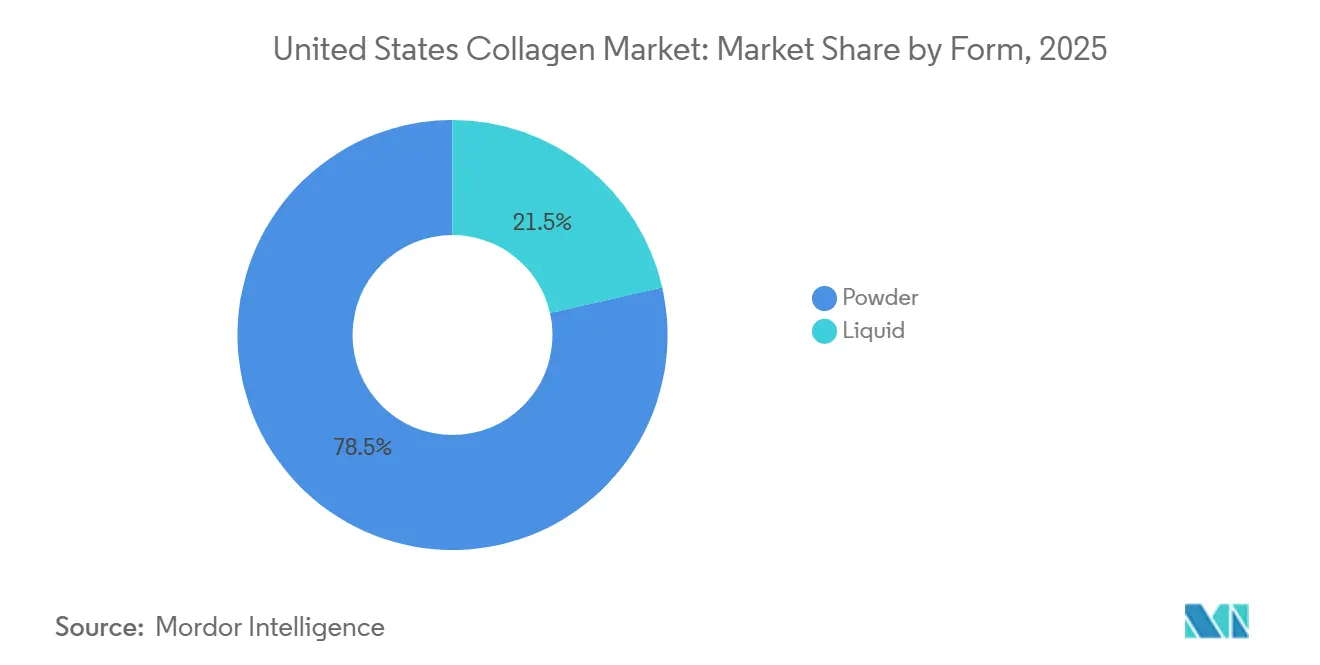
- By form, powder formats captured 78.54% of the United States collagen market size in 2025, while liquid collagen is projected to expand at a 7.36% CAGR between 2026 and 2031.
- By application, food and beverage accounted for 55.27% of the United States collagen market share in 2025, while personal care and cosmetics are advancing at a 7.62% CAGR, the quickest among applications.
Note: Market size and forecast figures in this report are generated using Mordor Intelligence’s proprietary estimation framework, updated with the latest available data and insights as of January 2026.
United States Collagen Market Trends and Insights
Drivers Impact Analysis*
| Driver | (~) % Impact on CAGR Forecast | Geographic Relevance | Impact Timeline |
|---|---|---|---|
| Rising demand for collagen-based dietary supplements | +1.2% | National, concentrated in coastal metro areas | Medium term (2-4 years) |
| Expanding adoption in functional food and beverage launches | +1.0% | National, led by West Coast and Northeast | Short term (≤ 2 years) |
| Aging population driving nutricosmetics uptake | +0.9% | National, skewed toward Sun Belt states | Long term (≥ 4 years) |
| Clean-label preference favouring animal-sourced collagen | +0.7% | National, strongest in organic-focused markets | Medium term (2-4 years) |
| Rising innovation in research and production | +0.6% | National, R and D hubs in California and Massachusetts | Medium term (2-4 years) |
| Shift toward sustainable marine collagen sources | +0.5% | Coastal states, early adoption in Pacific Northwest | Long term (≥ 4 years) |
| Source: Mordor Intelligence | |||


Rising demand for collagen-based dietary supplements
Collagen peptides have shifted from being a niche ingredient in sports nutrition to becoming a mainstream wellness essential, widely available through United States. dietary supplement sales channels such as Amazon, Costco, and specialty retailers. With increasing sports participation, the sports and performance nutrition sector is witnessing significant growth. In 2024, the Bureau of Labor Statistics reported that 21.5% of the United States population engaged daily in sports, exercise, and recreational activities[1]Source: Bureau of Labor Statistics, "American Time Use Survey", bls.gov.. Formulators are addressing this trend by combining collagen with hyaluronic acid, vitamin C, and biotin. These multi-benefit products target skin hydration, cartilage repair, and hair strength in a single serving, commanding a price premium of 15% to 25% over standard collagen powders. The FDA's New Dietary Ingredient notification pathway requires manufacturers to submit safety data for novel collagen sources, such as marine and bioengineered variants. While this has standardized quality expectations, it has also increased compliance costs, particularly for smaller brands. Although collagen purchases have traditionally been dominated by women aged 35 to 54, there is a growing adoption among male consumers. Collagen-infused protein powders are gaining popularity, especially in post-workout recovery formulations focused on tendon and ligament repair. This expanding demographic highlights collagen's market potential beyond its traditional anti-aging narrative, encompassing athletic performance and preventive orthopedic care.
Expanding adoption in functional food and beverage launches
Protein fortification, which was once limited to sports nutrition, has now become a prominent feature in mainstream food and beverage categories. The International Food Information Council reports that the proportion of Americans focusing on protein intake has risen from 59% in 2022 to 71% in 2024[2]Source: International Food Information Council, "2024 IFIC Food & Health SURVEY IFIC", ific.org.. To differentiate in the competitive protein beverage market, functional beverage brands in the U.S. introduced collagen-infused products in 2024 and 2025. These products, including ready-to-drink coffee, sparkling water, kombucha, and kefir, underscore the industry's shift toward "invisible nutrition." This approach leverages collagen's neutral taste and solubility, enabling brands to enhance nutritional content without affecting flavor or requiring changes in consumer behavior. In 2024, Vital Proteins launched collagen-infused cold-brew coffee in retail chains, utilizing Nestlé Health Science's distribution network to secure prominent shelf placement in grocery and club stores. In 2025, Urban Remedy introduced collagen-enhanced wellness shots, marketed as a premium and convenient alternative to traditional collagen powders, targeting consumers willing to spend USD 4 to USD 6 for a 2-ounce serving. Highlighting collagen's adaptability, the Institute of Food Technologists notes its gelation properties at low temperatures. This characteristic facilitates texture innovations in plant-based dairy alternatives and low-sugar desserts, expanding collagen's applications beyond traditional protein fortification.
Aging population driving nutricosmetics uptake
In 2024, 18% of the United States population is expected to be aged 65 and older, according to the World Bank[3]Source: World Bank, "World Population Prospects", worldbank.org.. This demographic trend is driving increased demand for nutricosmetics, ingestible products marketed to enhance the appearance of skin, hair, and nails from within. Collagen peptides are a key ingredient in these formulations, widely promoted for their ability to reduce visible signs of aging. The nutricosmetics market is also gaining momentum due to the influence of K-beauty and J-beauty. Korean and Japanese brands have introduced the concept of "beauty from within" through products like collagen drinks and jellies, fostering consumer awareness that U.S. brands are now leveraging. Retail pricing analysis indicates that ingestible collagen products achieve margins 30% to 50% higher than topical skincare products. This profitability is encouraging beauty brands to expand into dietary supplements, further merging the boundaries between cosmetics and functional foods. This shift is particularly evident among direct-to-consumer brands, which utilize subscription models and personalized quizzes to offer tailored collagen regimens addressing individual aging concerns. These approaches enhance customer lifetime value while reducing reliance on traditional retail distribution channels.
Rising innovation in research and production
In October 2024, Geltor received FDA GRAS notice GRN 1171 for its recombinant human collagen type I, created using genetically engineered Escherichia coli. This regulatory milestone validates bioengineered collagen as a reliable alternative to traditional animal-derived sources. By utilizing a fermentation-based process, Geltor addresses concerns about zoonotic disease transmission, complies with religious dietary restrictions, and ensures consistent amino acid profiles across batches. This establishes their bioengineered collagen as a premium ingredient for pharmaceuticals and medical devices, where purity and consistency are critical. Additionally, ultrasound-assisted extraction and supercritical CO2 processing are emerging as more sustainable alternatives to conventional acid-alkali hydrolysis. These methods reduce water usage and chemical waste while improving peptide yield, aligning with the sustainability-focused procurement strategies of multinational food and beverage companies.
Restraints Impact Analysis*
| Restraint | (~) % Impact on CAGR Forecast | Geographic Relevance | Impact Timeline |
|---|---|---|---|
| Rise of vegan protein alternatives | -0.8% | National, strongest in urban coastal markets | Medium term (2-4 years) |
| Stringent regulatory compliance and certification requirements | -0.6% | National, federal FDA oversight | Short term (≤ 2 years) |
| Ethical and allergenic concerns related to animal-derived collagen | -0.5% | National, concentrated among Gen Z consumers | Long term (≥ 4 years) |
| High costs of sourcing and processing high-quality collagen raw materials | -0.7% | National, amplified by import tariffs | Medium term (2-4 years) |
| Source: Mordor Intelligence | |||
Rise of vegan protein alternatives
Consumers who prioritize environmental sustainability, animal welfare, or allergen avoidance are increasingly opting for plant-based and bioengineered protein alternatives, which are gradually reducing the market share of animal-derived collagen. Evonik's Vecollage and Vecollan brands, developed through microbial fermentation, provide vegan-friendly collagen analogs. These analogs replicate the amino acid profile of bovine collagen without relying on livestock, making them particularly appealing to flexitarian and vegan consumers. As the market shifts toward pea, soy, and rice proteins in sports nutrition and meal replacements, collagen suppliers face mounting pressure to justify their price premiums. This challenge is heightened by the fact that plant proteins are 20% to 40% cheaper per gram and have simpler supply chains. However, collagen's unique amino acid composition, rich in glycine, proline, and hydroxyproline, remains unmatched by plant proteins. This distinctive profile serves as a functional advantage, which animal-based suppliers are defending through clinical efficacy studies and bioavailability claims. The dietary supplement channel is experiencing the most significant competitive pressure, as vegan consumers represent a growing and vocal segment that brands cannot afford to ignore.
Stringent regulatory compliance and certification requirements
Launching collagen products has become increasingly expensive and complex, particularly for startups and regional brands with limited regulatory expertise. This is primarily due to the FDA's enforcement of GRAS notification requirements, New Dietary Ingredient submissions, and Current Good Manufacturing Practice regulations. Obtaining third-party certification from organizations such as NSF International, USP, or ConsumerLab costs between USD 10,000 and USD 100,000 annually per product line. These certifications, which include testing for heavy metals, microbial contaminants, and label-claim verification, are now essential for accessing premium retail channels and e-commerce platforms. In 2024, the FDA issued warning letters to collagen-supplement manufacturers for making unapproved drug claims about joint pain and osteoarthritis, emphasizing the agency's focus on distinguishing dietary supplements from pharmaceuticals. Consequently, brands must revise their marketing language and invest in legal reviews. Sourcing challenges are further intensified by import regulations related to bovine spongiform encephalopathy. The USDA's Animal and Plant Health Inspection Service enforces strict rules prohibiting the import of certain bovine-derived materials from countries with a history of BSE, restricting suppliers' ability to source affordable hides from global markets. These regulatory demands disproportionately impact smaller players, driving consolidation as brands seek the scale and expertise needed to manage this regulatory complexity.
*Our forecasts treat driver/restraint impacts as directional, not additive. The impact forecasts reflect baseline growth, mix effects, and variable interactions.
Segment Analysis
By Source: Animal Dominance Anchored in Byproduct Economics
In 2025, animal-based collagen held a dominant 88.15% market share, reflecting the U.S. meat-processing industry's efficient use of byproducts. Bovine hides, porcine skins, and poultry bones are converted into valuable collagen peptides, reducing waste. Bovine collagen, primarily sourced from cattle hides, benefits from well-established supply chains tied to the USD 70 billion U.S. beef industry. Similarly, porcine collagen leverages byproducts from pork processing, a practice refined over decades by major players like Smithfield Foods. Although poultry-derived collagen represents a smaller share, it is gaining popularity among formulators seeking halal and kosher certifications, as chicken and turkey sources avoid the religious restrictions associated with bovine and porcine materials. The FDA's BSE regulations, which prohibit the use of specific risk materials such as brain and spinal cord tissue, have standardized safety protocols across the animal-based supply chain, easing concerns for consumers and retailers. Additionally, clean-label trends strengthen animal-based collagen's market position. Premium brands with grass-fed, pasture-raised, and organic certifications can charge 25% to 40% higher prices while addressing consumer concerns about antibiotic use and animal welfare.
Marine-based collagen is growing at an annual rate of 7.45% through 2031, driven by sustainability certifications and allergen-avoidance strategies that distinguish it from terrestrial sources. In 2024, Rousselot addressed a key market gap by launching Marine Stewardship Council-certified marine collagen. This appealed to environmentally-conscious consumers and corporate procurement teams increasingly seeking third-party verification for wild-caught fish sourcing and bycatch minimization. Marine collagen's amino acid profile, while similar to bovine collagen, is perceived by some consumers as more bioavailable due to its lower molecular weight and higher glycine content. Brands leverage these perceptions to position marine collagen as a premium product, despite limited clinical evidence supporting superior efficacy. The segment also benefits from pescatarian and flexitarian dietary trends, as consumers who avoid land-animal products but consume seafood view marine collagen as an acceptable protein source.


By Form: Powder Versatility Versus Liquid Convenience
In 2025, powder collagen accounted for 78.54% of the market share, highlighting its flexibility in formulations, extended shelf life, and cost advantages compared to liquid alternatives. Powdered collagen integrates effortlessly into protein shakes, coffee, smoothies, baked goods, and savory dishes like soups and sauces. This adaptability enables consumers to adjust their dosage without being restricted by the flavor profiles of pre-mixed liquids. Hydrolyzed collagen peptides in powdered form are popular among co-manufacturers and private-label brands due to their neutral taste and excellent solubility. Manufacturers benefit from lower transportation and storage expenses with powders; the absence of water content reduces weight and eliminates the need for refrigeration. These factors enhance profit margins, particularly in e-commerce and direct-to-consumer channels. Additionally, the powder segment is gaining traction among food-service operators. Coffee shops and smoothie chains, for example, are offering collagen boosts for an extra USD 1 to USD 2 per serving, generating additional revenue without requiring new equipment or staff training.
Liquid collagen, meanwhile, is growing at an annual rate of 7.36% through 2031, fueled by consumer demand for convenience, perceived bioavailability, and the rising popularity of premium ready-to-drink functional beverages. Companies like Bloom Nutrition and Urban Remedy have launched collagen shots and wellness drinks aimed at on-the-go consumers who value convenience over cost, a demographic that tends to be younger and more urban than traditional powder buyers. Although clinical evidence distinguishing the absorption rates of liquid and powder collagen remains limited, influencer marketing and social media testimonials have strengthened the perception of liquid collagen's superior absorption. Brands have capitalized on this perception by introducing premium pricing and limited-edition flavors. Advances in aseptic processing and high-pressure pasteurization have extended the shelf life of liquid collagen products without the need for refrigeration, easing distribution challenges and enabling nationwide retail expansion. However, the segment faces obstacles from environmentally conscious consumers who view single-use plastic bottles and aluminum cans as unsustainable. In response, brands are exploring refillable packaging and concentrated formats to reduce material waste.
By Application: Food Fortification Leads, Beauty Accelerates
In 2025, food and beverage applications accounted for 55.27% of the market share, primarily driven by the increasing use of collagen as a protein fortification ingredient. This trend spans a variety of products, including protein bars, yogurt, coffee creamers, and baked goods. The Institute of Food Technologists highlights collagen's functional properties, such as emulsification, water-binding, and texture modification, as critical drivers of innovation. These advancements address consumer demand for nutrient-dense products without compromising sensory quality. Collagen's neutral flavor and high solubility make it an ideal choice for beverages, allowing formulators to incorporate 5 to 15 grams per serving without affecting taste or mouthfeel. This provides a significant advantage over plant proteins, which often introduce earthy or beany flavors. The food-service industry is also adopting collagen, with coffee shops, juice bars, and fast-casual restaurants offering it as an optional add-in priced between USD 1 and USD 2. This strategy not only enhances their offerings but also generates additional revenue with minimal operational complexity. Moreover, regulatory clarity confirming collagen's GRAS status for conventional foods has accelerated its adoption, eliminating the compliance uncertainties that previously restricted its use to dietary supplements.
Personal care and cosmetics represent the fastest-growing application, with an annual growth rate of 7.62% projected through 2031. This growth reflects the integration of ingestible beauty and topical skincare, as consumers increasingly seek comprehensive solutions for anti-aging and skin health. Charlotte Tilbury's 2025 launch of a collagen-infused serum, paired with ingestible collagen supplements, exemplifies how premium beauty brands are developing interconnected product lines to encourage the use of both topical and oral collagen. Similarly, brands like Drunk Elephant and Olay have introduced collagen-boosting serums and creams that combine peptides with retinol, niacinamide, and hyaluronic acid, appealing to consumers who prioritize scientifically validated formulations. The ingestible beauty segment within personal care is expanding rapidly, with brands such as HUM Nutrition and mindbodygreen offering collagen supplements designed to improve skin hydration, elasticity, and reduce wrinkles. These products are often combined with vitamins C and E to enhance collagen production. Although dietary supplements and pharmaceuticals hold a smaller share of the market, they are experiencing steady growth. Collagen is increasingly used in joint-health products, wound-healing solutions, and tissue-engineering scaffolds. FDA-approved medical devices from Integra LifeSciences and Organogenesis further highlight collagen's clinical applications, extending its importance beyond consumer wellness.
Geography Analysis
California, New York, Florida, and Texas dominate collagen consumption in the U.S., collectively representing a significant share of national demand. Coastal metropolitan areas favor marine collagen and clean-label products, reflecting increased sustainability awareness and seafood-based dietary habits. The Northeast corridor, known for its dense specialty retail network and high digital media engagement, fosters the growth of premium nutricosmetics and functional beverages, often driven by influencer promotions.
As retirees relocate to the Sun Belt states, sales of joint-care powders are steadily rising, particularly in club stores and pharmacy chains. In the Midwest and South, mass and club outlets lead the market, with value-priced private labels performing strongly. Conversely, coastal consumers lean toward direct-to-consumer subscriptions and specialty nourishment stores. California's Proposition 65 heavy-metal disclosure requirements are prompting brands to invest in third-party testing or reformulate products, creating compliance costs that often favor larger suppliers.
E-commerce continues to grow nationwide, with Amazon accounting for an estimated 25%–30% of U.S. collagen market sales. However, direct-to-consumer platforms like HUM Nutrition and The Collagen Co. are gaining traction, generating 40%–60% of their revenue through subscription models that ensure recurring cash flow. This omnichannel environment is driving brands to enhance both their shelf presence and digital algorithm visibility, leading to increased marketing investments and advanced data analytics across the U.S. collagen market.
Competitive Landscape
The United States collagen market demonstrates moderate consolidation. The top five suppliers, such as Darling Ingredients Inc., Gelita AG, Nitta Gelatin Inc., Tessenderlo Group, and Nagase and Co. Ltd, control a significant portion of the ingredient supply. However, the downstream branded-product segment remains highly fragmented, encompassing hundreds of companies in dietary supplements, food, and cosmetics. In December 2025, Darling Ingredients announced a merger agreement to combine its Rousselot division with Tessenderlo Group's gelatin and collagen business. This merger is expected to generate USD 1.5 billion in combined revenue, enabling the new entity to exert considerable influence over pricing, innovation, and sustainability standards across North America and Europe. This consolidation highlights an industry trend where larger players capitalize on scale advantages in raw material procurement, enzymatic hydrolysis technology, and regulatory compliance, creating significant barriers for smaller suppliers.
In the United States collagen market, companies are heavily focused on product innovation and strategic expansion to maintain their competitive positions. Leading players are investing in research and development to develop innovative collagen formulations for specific applications, particularly in the food and beverages and personal care sectors. Many companies are upgrading their manufacturing capabilities through facility expansions and technological advancements while also expanding their distribution networks. Strategic collaborations with ingredient suppliers and end-product manufacturers are becoming more prevalent to secure stable supply chains and market access. In response to growing consumer awareness of environmental concerns, many players are emphasizing sustainability in their sourcing and production processes. The industry is also seeing increased investment in specialized collagen variants, such as marine-based collagen for premium cosmetics and bovine collagen for food applications.
Emerging players are disrupting the market by utilizing bioengineered collagen and direct-to-consumer models to challenge established suppliers. Geltor's receipt of FDA GRAS notice GRN 1171 in October 2024 for its recombinant human collagen type I, produced using genetically engineered Escherichia coli, validates fermentation-based production as a viable alternative to animal-derived sources. This approach eliminates concerns related to zoonotic diseases, religious dietary restrictions, and batch variability. With this regulatory approval, Geltor is well-positioned to enter the pharmaceutical and medical-device markets, where purity and consistency command premium pricing, potentially reducing the dominance of animal-based suppliers in high-margin segments. Opportunities also exist in personalized nutrition, where brands can leverage genetic testing, microbiome analysis, or skin-health diagnostics to offer customized collagen regimens, fostering customer loyalty and creating a competitive edge through data-driven differentiation.
United States Collagen Industry Leaders
-
Darling Ingredients Inc.
-
Gelita AG
-
Nitta Gelatin Inc.
-
Tessenderlo Group
-
Nagase and Co. Ltd
- *Disclaimer: Major Players sorted in no particular order

Recent Industry Developments
- December 2025: Darling Ingredients and Tessenderlo Group have merged their gelatin and collagen businesses, creating a new entity with USD 1.5 billion in revenue and an annual production capacity of 200,000 metric tons. With an 85/15 ownership split in favor of Darling, the merger consolidates North American and European collagen supply chains. This strategic partnership enables the combined company to lead in pricing decisions and innovation timelines across the pharmaceutical, food, and cosmetics industries.
- October 2024: NutriScience Innovations, LLC, based in North America, has acquired XSTO Solutions, LLC. ("XSTO") XSTO is recognized as a value-added supplier specializing in nutraceutical and functional ingredients.


United States Collagen Market Report Scope
Collagen is the main structural protein in the extracellular matrix of the connective tissues of many animals. The United States collagen market is segmented by source, form, and application. By source, the market is segmented into animal-based and marine-based. By form, the market is segmented into powder and liquid. By application, the market is segmented into food and beverages, dietary supplements, personal care and cosmetics, pharmaceuticals, and animal nutrition. The market forecasts are provided in terms of value (USD) and volume (tons).
By Source
| Animal-based |
| Marine-based |
By Form
| Powder |
| Liquid |
By Application
| Food and Beverages |
| Dietary Supplements |
| Personal Care and Cosmetics |
| Pharmaceuticals |
| Animal Nutrition |
| By Source | Animal-based |
| Marine-based | |
| By Form | Powder |
| Liquid | |
| By Application | Food and Beverages |
| Dietary Supplements | |
| Personal Care and Cosmetics | |
| Pharmaceuticals | |
| Animal Nutrition |


Market Definition
- End User - The Protein Ingredients Market operates on a B2B basis. Food, Beverages, Supplements, Animal Feed, and Personal Care & Cosmetic manufacturers are considered to be end-consumers in the market studied. The scope excludes manufacturers buying liquid/dry whey to be used for application as a binding agent or thickener or other non-protein applications.
- Penetration Rate - Penetration Rate is defined as the percentage of Protein-Fortified End User Market Volume in the Overall End User Market Volume.
- Average Protein Content - Average protein content is the average protein content present per 100 g of product manufactured by all end-user companies considered under the scope of this report.
- End User Market Volume - End-user market volume is the consolidated volume of all types and forms of end-user products in the country or region.
| Keyword | Definition |
|---|---|
| Alpha-lactalbumin (α-Lactalbumin) | It is a protein that regulates the production of lactose in the milk of almost all mammalian species. |
| Amino acid | It is an organic compound that contains both amino and carboxylic acid functional groups, which are required for the synthesis of body protein and other important nitrogen-containing compounds, such as creatine, peptide hormones, and some neurotransmitters. |
| Blanching | It is the process of briefly heating vegetables with steam or boiling water. |
| BRC | British Retail Consortium |
| Bread improver | It is a flour-based blend of several components with specific functional properties designed to modify dough characteristics and give quality attributes to bread. |
| BSF | Black Soldier Fly |
| Caseinate | It is a substance produced by adding an alkali to acid casein, a derivative of casein. |
| Celiac disease | Celiac disease is an immune reaction to eating gluten, a protein found in wheat, barley, and rye. |
| Colostrum | It is a milky fluid that’s released by mammals that have recently given birth before breast milk production begins. |
| Concentrate | It is the least processed form of protein and has a protein content ranging from 40-90% by weight. |
| Dry protein basis | It refers to the percentage of "pure protein" present in a supplement after the water in it is completely removed through heat. |
| Dry whey | It is the product resulting from drying fresh whey which has been pasteurized and to which nothing has been added as a preservative. |
| Egg protein | It is a mixture of individual proteins, including ovalbumin, ovomucoid, ovoglobulin, conalbumin, vitellin, and vitellenin. |
| Emulsifier | It is a food additive that facilitates the blending of foods that are immiscible with one another, such as oil and water. |
| Enrichment | It is the process of addition of micronutrients that are lost during the processing of the product. |
| ERS | Economic Research Service of the USDA |
| Extrusion | It is the process of forcing soft mixed ingredients through an opening in a perforated plate or die designed to produce the required shape. The extruded food is then cut to a specific size by blades. |
| Fava | Also known as Faba, it is another word for yellow split beans. |
| FDA | Food and Drug Administration |
| Flaking | It is a process in which typically a cereal grain (like corn, wheat, or rice) is broken down into grits, cooked with flavors and syrups, and then pressed into flakes between cooled rollers. |
| Foaming agent | It is a food ingredient that makes it possible to form or maintain a uniform dispersion of a gaseous phase in a liquid or solid food. |
| Foodservice | It refers to the part of the food industry which includes businesses, institutions, and companies which prepare meals outside the home. It includes restaurants, school and hospital cafeterias, catering operations, and many other formats. |
| Fortification | It is the deliberate addition of micronutrients that are not found in them naturally or which are lost during processing, to improve a food product's nutritional value. |
| FSANZ | Food Standards Australia New Zealand |
| FSIS | Food Safety and Inspection Service |
| FSSAI | Food Safety and Standards Authority of India |
| Gelling agent | It is an ingredient that functions as a stabilizer and thickener to provide thickening without stiffness through the formation of gel. |
| GHG | Greenhouse Gas |
| Gluten | It is a family of proteins found in grains, including wheat, rye, spelt, and barley. |
| Hemp | It is a botanical class of Cannabis sativa cultivars grown specifically for industrial or medicinal use. |
| Hydrolysate | It is a form of protein manufactured by exposing the protein to enzymes that can partially break the bonds between the protein's amino acids and break down large, complicated proteins into smaller pieces. Its processing makes it easier and quicker to digest. |
| Hypoallergenic | It refers to a substance that causes fewer allergic reactions. |
| Isolate | It is the purest and most processed form of protein which has undergone separation to obtain a pure protein fraction. It typically contains ≥ 90% of protein by weight. |
| Keratin | It is a protein that helps form hair, nails, and the outer layer of skin. |
| Lactalbumin | It is the albumin contained in milk and obtained from whey. |
| Lactoferrin | It is an iron‑binding glycoprotein that is present in the milk of most mammals. |
| Lupin | It is the yellow legume seeds of the genus Lupinus. |
| Millenial | Also known as Generation Y or Gen Y, it refers to the people born from 1981 to 1996. |
| Monogastric | It refers to an animal with a single-compartmented stomach. Examples of monogastric include humans, poultry, pigs, horses, rabbits, dogs, and cats. Most monogastric are generally unable to digest much cellulose food materials such as grasses. |
| MPC | Milk protein concentrate |
| MPI | Milk protein isolate |
| MSPI | Methylated soy protein isolate |
| Mycoprotein | Mycoprotein is a form of single-cell protein, also known as fungal protein, derived from fungi for human consumption. |
| Nutricosmetics | It is a category of products and ingredients that act as nutritional supplements to care for skin, nails, and hair natural beauty. |
| Osteoporosis | It is a medical condition in which the bones become brittle and fragile from loss of tissue, typically as a result of hormonal changes, or deficiency of calcium or vitamin D. |
| PDCAAS | Protein digestibility-corrected amino acid score (PDCAAS) is a method of evaluating the quality of a protein based on both the amino acid requirements of humans and their ability to digest it. |
| Per-capita consumption of animal protein | It is the average amount of animal protein (such as milk, whey, gelatin, collagen, and egg proteins) that is readily available for consumption by each person in an actual population. |
| Per-capita consumption of plant protein | It is the average amount of plant protein (such as soy, wheat, pea, oat, and hemp proteins) that is readily available for consumption by each person in an actual population. |
| Quorn | It is a microbial protein manufactured using mycoprotein as an ingredient, in which the fungus culture is dried and mixed with egg albumen or potato protein, which acts as a binder, and then is adjusted in texture and pressed into various forms. |
| Ready-to-Cook (RTC) | It refers to food products that include all of the ingredients, where some preparation or cooking is required through a process that is given on the package. |
| Ready-to-Eat (RTE) | It refers to a food product prepared or cooked in advance, with no further cooking or preparation required before being eaten. |
| RTD | Ready-to-Drink |
| RTS | Ready-to-Serve |
| Saturated fat | It is a type of fat in which the fatty acid chains have all single bonds. It is generally considered unhealthy. |
| Sausage | It is a meat product made of finely chopped and seasoned meat, which may be fresh, smoked, or pickled and which is then usually stuffed into a casing. |
| Seitan | It is a plant-based meat substitute made out of wheat gluten. |
| Softgel | It is a gelatin-based capsule with a liquid fill. |
| SPC | Soy protein concentrate |
| SPI | Soy protein isolate |
| Spirulina | It is a biomass of cyanobacteria that can be consumed by humans and animals. |
| Stabilizer | It is an ingredient added to food products to help maintain or enhance their original texture, and physical and chemical characteristics. |
| Supplementation | It is the consumption or provision of concentrated sources of nutrients or other substances that are intended to supplement nutrients in the diet and is intended to correct nutritional deficiencies. |
| Texturant | It is a specific type of food ingredient that is used to control and alter the mouthfeel and texture of food and beverage products. |
| Thickener | It is an ingredient that is used to increase the viscosity of a liquid or dough and make it thicker, without substantially changing its other properties. |
| Trans fat | Also called trans-unsaturated fatty acids or trans fatty acids, it is a type of unsaturated fat that naturally occurs in small amounts in meat. |
| TSP | Textured soy protein |
| TVP | Textured vegetable protein |
| WPC | Whey protein concentrate |
| WPI | Whey protein isolate |


Research Methodology
Mordor Intelligence follows a four-step methodology in all our reports.
- Step-1: Identify Key Variables: The quantifiable key variables (industry and extraneous) pertaining to the specific product segment and country are selected from a group of relevant variables & factors based on desk research & literature review; along with primary expert inputs. These variables are further confirmed through regression modeling (wherever required).
- Step-2: Build a Market Model: In order to build a robust forecasting methodology, the variables and factors identified in Step-1 are tested against available historical market numbers. Through an iterative process, the variables required for market forecast are set and the model is built on the basis of these variables.
- Step-3: Validate and Finalize: In this important step, all market numbers, variables and analyst calls are validated through an extensive network of primary research experts from the market studied. The respondents are selected across levels and functions to generate a holistic picture of the market studied.
- Step-4: Research Outputs: Syndicated Reports, Custom Consulting Assignments, Databases & Subscription Platforms


