Market Overview
| Study Period | 2021 - 2031 |
|---|---|
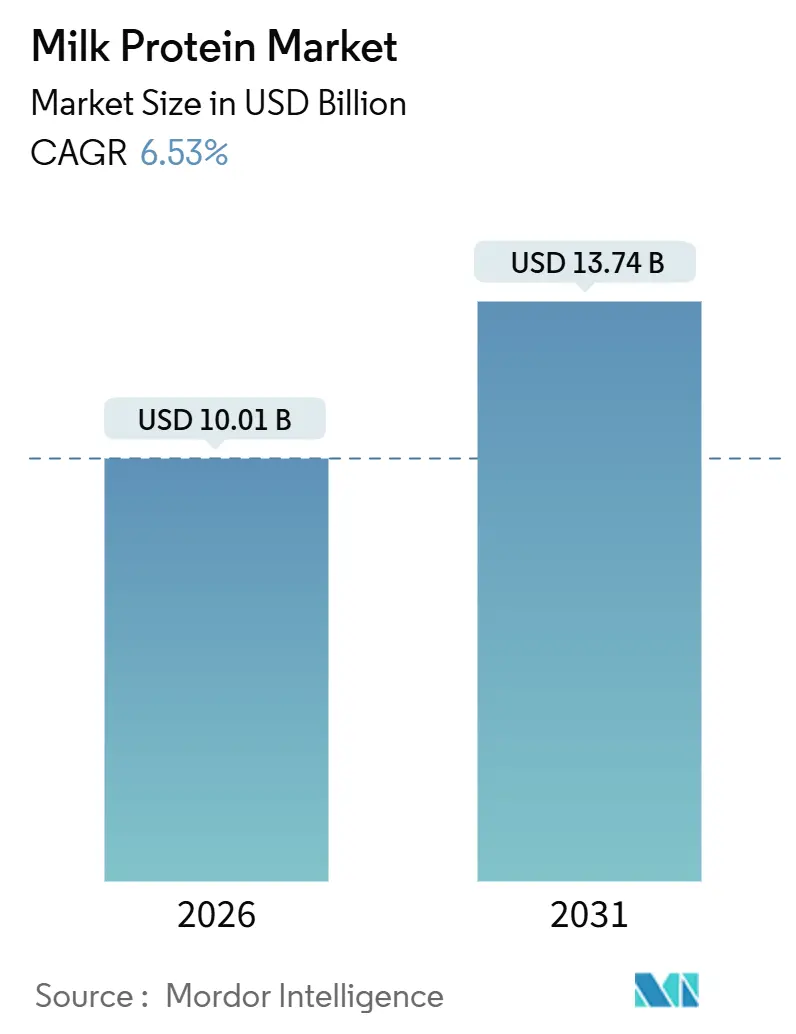
| Market Size (2026) | USD 10.01 Billion |
| Market Size (2031) | USD 13.74 Billion |
| Growth Rate (2026 - 2031) | 6.53% CAGR |
| Fastest Growing Market | Asia Pacific |
| Largest Market | North America |
| Market Concentration | Medium |
Major Players*Disclaimer: Major Players sorted in no particular order Image © Mordor Intelligence. Reuse requires attribution under CC BY 4.0. |
|
Milk Protein Market Analysis by Mordor Intelligence
The milk protein market size is estimated at USD 10.01 billion in 2026, and is expected to reach USD 13.74 billion by 2031, at a CAGR of 6.53% during the forecast period (2026-2031). Expanding consumer pursuit of higher-protein diets, regulatory support for hypoallergenic infant formulas, and rapid uptake of ready-to-drink fortified beverages together underpin steady volume gains in both mature and emerging regions. Technology upgrades, from enzymatic hydrolysis that reduces allergenicity to ceramic-membrane filtration that lifts protein purity, are enabling suppliers to shift mix toward higher-margin isolates and hydrolysates. At the same time, North American suppliers are countering raw-milk tightness with multi-year supply contracts, while Asia-Pacific players leverage urbanization and fitness-club growth to widen distribution through e-commerce and convenience retail. Competitive intensity remains moderate as vertically integrated dairy cooperatives and specialty processors pursue parallel strategies: the former defends cost leadership, the latter differentiates through clinical evidence and functional claims, shaping how each captures value along the milk protein market demand curve.
Key Report Takeaways
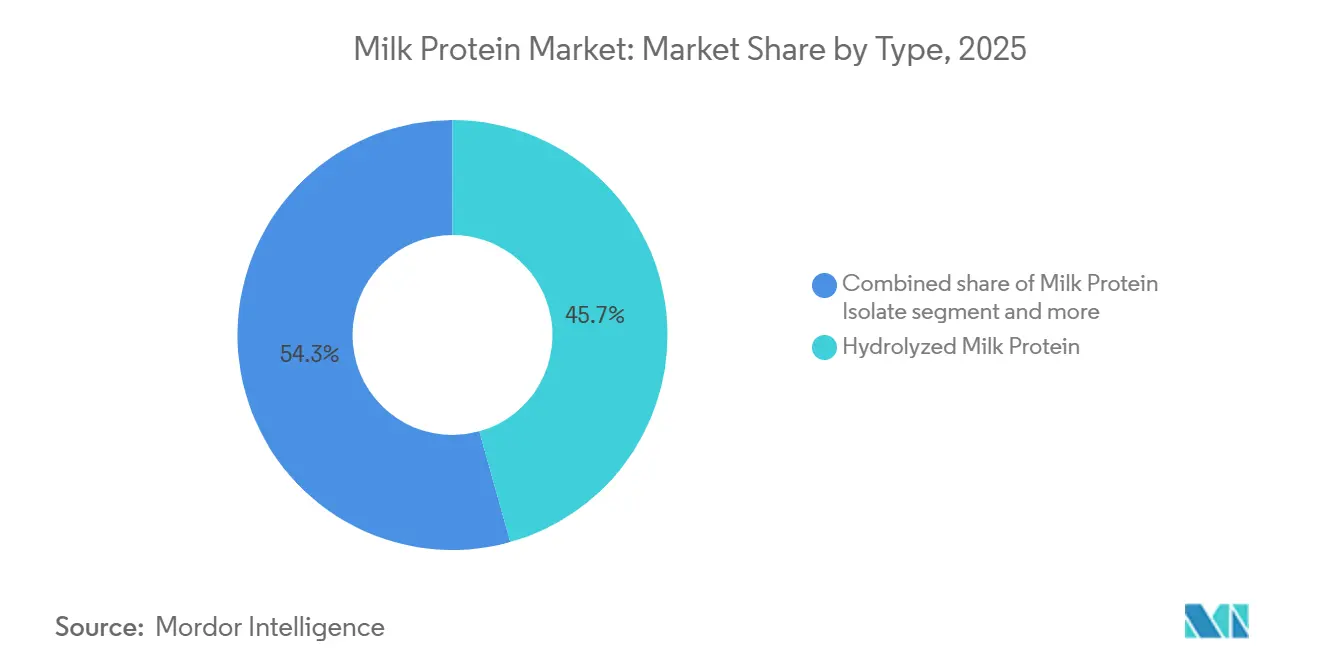
- By type, hydrolyzed milk protein led with 45.67% milk protein market share in 2025, whereas milk protein isolate is forecast to register the fastest 7.01% CAGR through 2031.
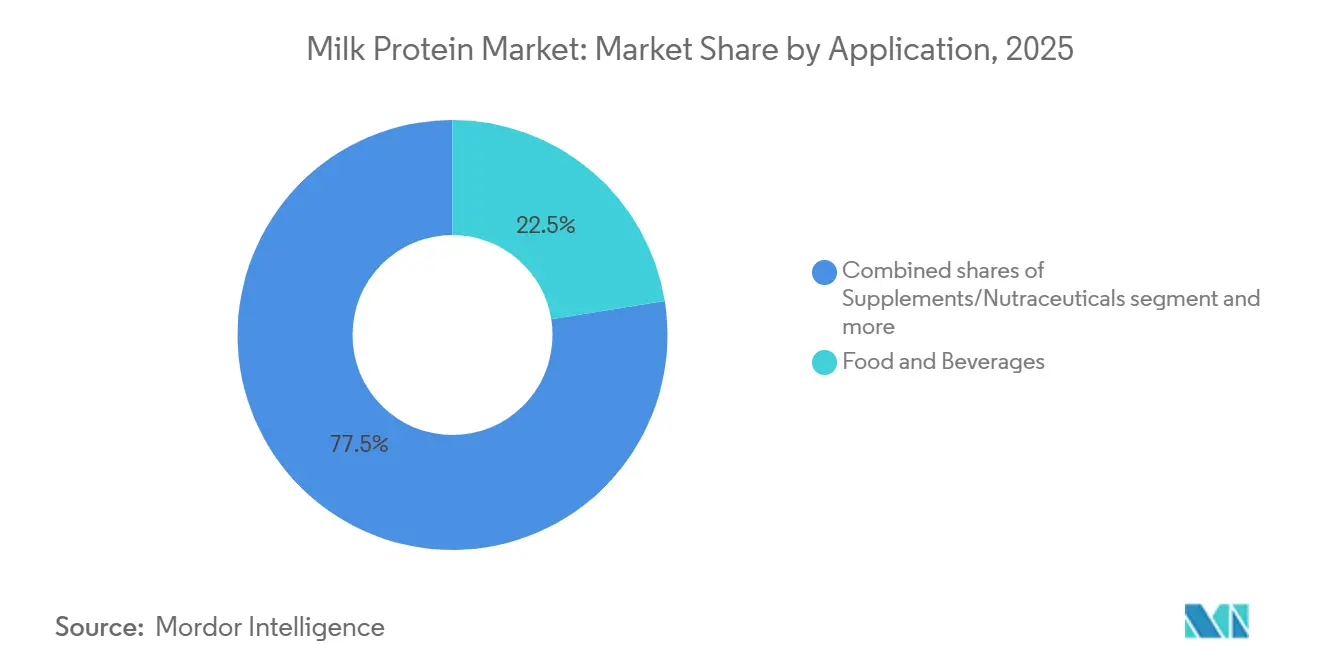
- By application, food and beverages accounted for 22.48% of the 2025 milk protein market size, while supplements and nutraceuticals are projected to grow at a 7.23% CAGR to 2031.
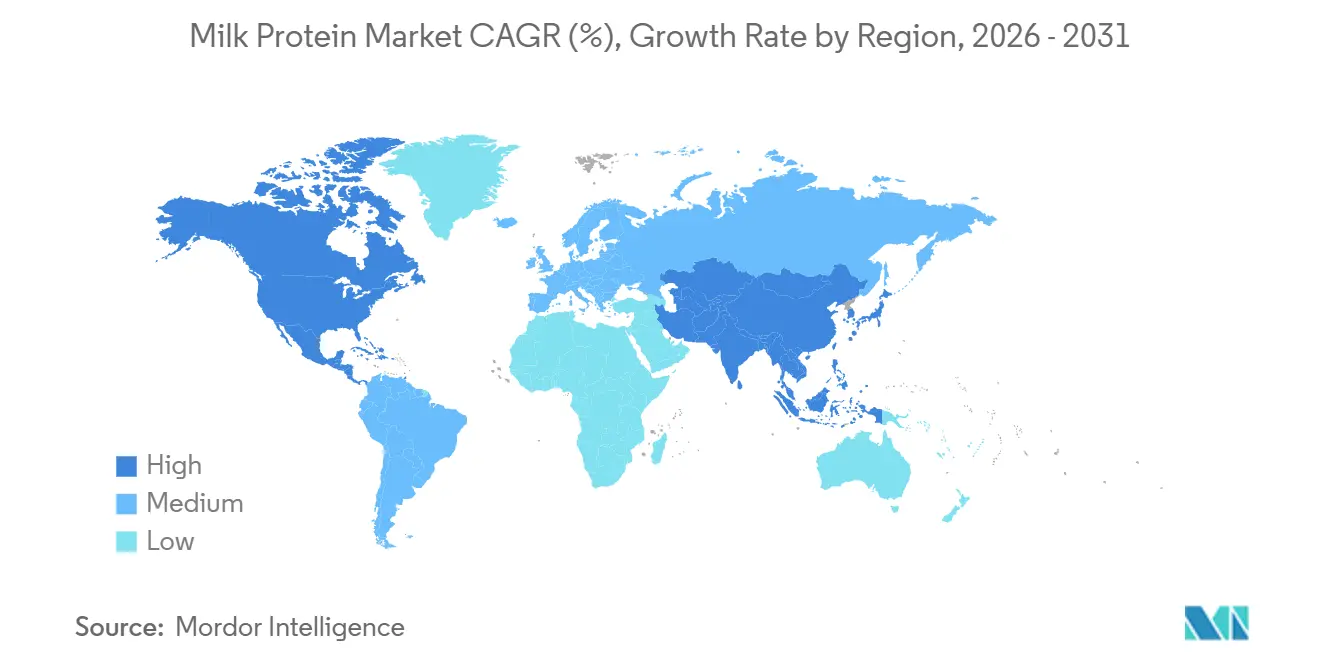
- By geography, North America captured 40.02% of the 2025; Asia-Pacific is poised for the quickest 6.87% annual expansion over the same horizon.
Note: Market size and forecast figures in this report are generated using Mordor Intelligence’s proprietary estimation framework, updated with the latest available data and insights as of January 2026.
Global Milk Protein Market Trends and Insights
Drivers Impact Analysis*
| Driver | (~) % Impact on CAGR Forecast | Geographic Relevance | Impact Timeline |
|---|---|---|---|
| Growing preference for high-protein daily diets | +1.2% | Global, pronounced in North America and urban Asia-Pacific | Medium term (2–4 years) |
| Expanding use in infant and clinical nutrition formulations | +1.4% | Global, the strongest regulatory tailwinds in the EU (European Union) and North America | Long term (≥ 4 years) |
| Innovation in whey, casein, and hydrolysate functionalities | +1.0% | North America and Europe lead R&D (Research and Development); adoption diffuses to the Asia-Pacific | Medium term (2–4 years) |
| Increasing use in fortified beverages and dairy drinks | +0.9% | Core in Asia-Pacific; spill-over into the Middle East and South America | Short term (≤ 2 years) |
| Advancements in fractionation and protein processing technologies | +0.8% | North America and Europe as patent hubs; scale-up in Asia-Pacific | Long term (≥ 4 years) |
| Growing consumer awareness of muscle and weight management benefits | +1.1% | Global, accelerated by fitness-industry growth in Asia-Pacific and North America | Medium term (2–4 years) |
| Source: Mordor Intelligence | |||
Growing preference for high-protein daily diets
National nutrition surveys released between 2020 and 2023 confirm that protein intake has risen among the general populations in the United Kingdom, Japan, and Indonesia, signaling a mainstream shift beyond the athletic circles[1]Source: Gov.UK, "National Nutrition Surveys", gov.uk. Office workers and seniors now associate protein with satiety and muscle preservation, driving the launch of convenient formats such as protein-enriched yogurts and shelf-stable shakes. Dairy proteins hold an advantage because their complete amino-acid profile meets updated leucine thresholds endorsed by the 2024 U.S. dietary guidelines[2]Source: U.S. Department of Agriculture, "Putting American Farmers First", usda.gov. Brands are therefore deploying hybrid blends that pair milk protein isolate with plant proteins to temper cost while maintaining nutritional density, a strategy that balances sustainability expectations with dairy’s sensory familiarity. European retailers amplify the trend by adding front-of-pack carbon-footprint labels, nudging formulators toward lower-emission ingredients yet without diluting demand for the creaminess consumers associate with dairy proteins.
Expanding use in infant and clinical nutrition formulations
Infant formula and medical nutrition remain the highest-value avenues for hydrolyzed milk protein, which commands a price premium over intact concentrates due to its hypoallergenicity and rapid absorption. The U.S. FDA’s January 2025 infant-formula strategy highlighted compositional transparency and domestic manufacturing resilience, accelerating investments in local hydrolysate capacity. The European Food Safety Authority echoed the momentum by issuing favorable opinions on multiple whey-protein hydrolysates the same year, lowering regulatory barriers across the EU[3]Source: European Food Safety Authority, "Highlights", efsa.europa.eu/en. Clinical nutrition is similarly expanding; studies have shown that improvement in nitrogen retention among geriatric patients occurs when consuming whey-protein hydrolysates versus intact casein. Converging standards between the FDA (Food and Drug Administration), EFSA (European Food Safety Authority), and Health Canada shorten commercialization timelines, allowing processors to amortize research costs across several high-margin jurisdictions.
Innovation in whey, casein, and hydrolysate functionalities
Advances in enzymatic hydrolysis and membrane filtration now enable peptide tailoring for precise physiological outcomes. Patent records from 2024–2025 document proteases engineered for narrow peptide-length windows that reduce bitterness while improving bioavailability. Micellar casein is gaining prominence in overnight-recovery beverages thanks to its slow-release properties, and cross-flow microfiltration preserves native protein structures while stripping lactose and ash, delivering the majority of the protein isolates suited to ultra-high-temperature processing. These technical leaps allow beverage formulators to deliver few grams of protein in a 250-milliliter serving without chalkiness, an achievement that broadens consumer appeal and cements the milk protein market as the preferred source for both rapid and sustained amino-acid delivery.
Increasing use in fortified beverages and dairy drinks
Ready-to-drink protein beverages have surged in Asia-Pacific convenience outlets since 2024 as urban consumers prioritize on-the-go nutrition. Dairy-based drinks fortified with milk protein isolate benefit from a familiar taste and straightforward regulatory path compared with novel plant proteins that often require lengthy safety reviews by bodies such as China’s National Medical Products Administration. Producers, including Saputo, reported strengthened sales of lactose-free, protein-enriched fluid milk in fiscal 2025, indicating that even traditional dairy categories can draw premium pricing through value-added fortification. Emerging technologies like ultra-high-pressure processing are removing cold-chain constraints, enabling distribution in tropical climates where refrigeration remains inconsistent and opening incremental demand pockets for the milk protein market.
Restraints Impact Analysis*
| Restraint | (~) % Impact on CAGR Forecast | Geographic Relevance | Impact Timeline |
|---|---|---|---|
| Growing popularity of plant-based and alternative proteins | -0.8% | North America and Europe lead adoption; Asia-Pacific follows selectively | Medium term (2–4 years) |
| Taste and texture issues in highly fortified high-protein products | -0.5% | Global, most acute in cost-sensitive emerging markets | Short term (≤ 2 years) |
| Fluctuating raw-milk availability due to herd pressures | -0.7% | North America and Europe face herd contraction; Asia-Pacific supply more stable | Long term (≥ 4 years) |
| Concerns over dairy allergies and milk protein intolerance | -0.6% | Global regulatory scrutiny is highest in the EU and North America | Medium term (2–4 years) |
| Source: Mordor Intelligence | |||
Growing popularity of plant-based and alternative proteins
Plant proteins captured incremental share in bakery, snack, and beverage formulations in 2024–2025 as sustainability messaging resonated with environmentally conscious consumers, particularly in Europe and North America. Pea isolates now achieve functional parity with milk-protein concentrates in extruded snacks, while soy proteins dominate meat alternatives where dairy proteins have limited functional value. Flexitarian shoppers, representing roughly one-quarter of the adult population in high-income regions, gravitate toward plant-based labels despite dairy’s superior amino-acid completeness. Milk protein suppliers thus face the choice of defending commodity segments on price or pivoting to high-value niches, an inflection that will shape the competitive contours of the milk protein market during the forecast period.
Taste and texture issues in highly fortified high-protein products
Taste and texture challenges in highly fortified high-protein products significantly restrain the growth of the milk protein market because consumers frequently encounter undesirable sensory attributes, such as astringency, chalkiness, bitterness, mouth-drying sensations, or hard, grainy textures as protein levels increase, which lower overall product acceptability and repeat purchase rates. High protein inclusion often alters the mouthfeel and flavour profile of dairy-based foods and beverages, making them less appealing compared with conventional products, and these issues present hurdles for mainstream consumer adoption beyond niche health or athlete segments. As a result, manufacturers must invest in advanced formulation strategies and flavour/texture modulation technologies to balance enhanced protein content with enjoyable sensory qualities, which can increase production complexity and cost, ultimately acting as a restraint on broader market expansion.
*Our forecasts treat driver/restraint impacts as directional, not additive. The impact forecasts reflect baseline growth, mix effects, and variable interactions.
Segment Analysis
By type: hydrolysates dominate, isolates accelerate
Hydrolyzed milk protein generated 45.67% of 2025 revenue, underscoring its entrenched role in infant formula and clinical nutrition, where pre-digested peptides ease allergen concerns and improve absorption. Continuous R&D is pushing processing frontiers: 2024–2025 patents on ceramic-membrane systems cut energy use and increase flux rates, improving the economics of both isolates and hydrolysates. Concentrates remain the cost-efficient workhorse for bakery and processed-meat applications, but face margin pressure as plant proteins narrow the functional gap.
Milk protein isolate, while smaller in 2025, is forecast to grow at a 7.01% CAGR, illustrating how clean-label trends in ready-to-drink beverages reward formulations that deliver high purity without excessive lactose or ash. Enzymes engineered for narrow peptide ranges minimize bitterness, unlocking broader flavor profiles and reinforcing the milk protein market position in high-value functional nutrition. Meanwhile, commodity concentrates risk commoditization as alternative proteins undercut pricing, compelling processors to either scale up or pivot toward value-added fractions.


By application: supplements outpace food and beverages
Food and beverages accounted for 22.48% of the 2025, encompassing bakery mixes, dairy drinks, and convenience snacks. Performance-nutrition brands capitalize on the gym culture and active aging market to push ready-to-drink shakes and bars packed with milk protein isolate, illustrating how convenience and targeted health claims can fetch premium price points. Within traditional food channels, fortified dairy retains an edge because milk proteins integrate seamlessly without regulatory hurdles.
In contrast, supplements and nutraceuticals are projected to expand at a 7.23% CAGR through 2031, the fastest among all segments. In the Asia-Pacific region, protein-enriched beverages populate convenience stores as consumers seek on-the-go nutrition that aligns with rising fitness participation. Bakery and cereal makers employ concentrates for cost-efficient enrichment, while condiment manufacturers adopt isolates to add protein without altering viscosity. Animal feed and personal care use remain niche, together representing a low but significant part of the milk protein market, constrained by cost sensitivity and lower functional requirements.
Geography Analysis
North America commanded 40.02% of 2025 due to mature supplement channels, integrated cooperative supply chains, and the FDA’s transparent regulatory framework for infant formula. Raw-milk tightness, U.S. dairy herds slipped to 9.265 million head in January 2025, has pushed whey costs upward, prompting processors to secure multi-year farm contracts or invest in productivity programs. Canada’s proposed compositional rules on protein-fortified products add compliance costs but also discourage new entrants lacking robust quality systems, favoring incumbents that already dominate regional shelves.
Asia-Pacific is forecast to deliver a 6.87% CAGR through 2031, supported by urbanization, disposable-income gains, and the world’s fastest-growing gym membership base. Chinese per-capita dairy consumption recorded double-digit gains in 2024–2025, while Indian consumers exhibited rising demand for muscle-health solutions, underpinning a vibrant outlook for the milk protein market across the region. Regulatory harmonization inside ASEAN (Association of Southeast Asian Nations) further compresses launch timelines for new formulations, enabling global brands to scale more quickly.
Europe advances at a modest pace as sustainability directives influence production tactics. Methane-reduction mandates pressure dairy herds, yet EFSA’s 2025 hydrolysate approvals open new opportunities in specialized infant formula. Germany, France, and the United Kingdom maintain strong clinical-nutrition demand, while southern markets adopt fortified dairy beverages to meet wellness aspirations. South America, the Middle East, and Africa remain smaller contributors but show accelerating adoption, led by Brazil’s sports-nutrition boom and South Africa’s fortified-beverage launches.

Competitive Landscape
The milk protein market exhibits moderate fragmentation, with key players leveraging strategic advantages to maintain their positions. Vertically integrated dairy cooperatives such as Fonterra, Dairy Farmers of America, and Agropur secure raw-milk throughput, enabling them to mitigate the impact of commodity price fluctuations. These firms also utilize economies of scale to strengthen their market presence. Fonterra’s March 2025 investment in its Studholme fractionation facility underscores the industry's focus on controlling whey economics and transitioning toward higher-value isolates, reflecting a broader trend of value addition within the market.
Specialty processors, including Glanbia, Hilmar Cheese, and Idaho Milk Products, pursue differentiation through technology and clinical validation; Glanbia’s hydrolyzed whey isolates registered strong half-year volume gains in 2025 as sports-nutrition demand flourished. White-space growth areas cluster in elderly nutrition, emerging-market infant formulas, and hybrid dairy-plant offerings that balance sustainability with functionality. Kerry Group’s June 2025 divestiture of its Irish dairy arm freed capital for enzyme platforms and bioactive hydrolysates focusing on senior health.
Smaller innovators such as Actus Nutrition are capitalizing on organic-certified niches, carving out specialized segments within the market. Meanwhile, patent activity surrounding hypoallergenic hydrolysates and thermostable isolates is intensifying, creating intellectual-property barriers that challenge new entrants. This dynamic highlights the growing importance of innovation and exclusivity in driving competitive advantage. The interplay between cost leadership and technical proprietary claims will ultimately determine which firms capture significant portions of the milk protein market growth projected through 2031.
Milk Protein Industry Leaders
-
Agrial Enterprise
-
Fonterra Co-operative Group Limited
-
Glanbia PLC
-
Kerry Group PLC
-
Royal FrieslandCampina NV
- *Disclaimer: Major Players sorted in no particular order

Recent Industry Developments
- December 2025: FrieslandCampina Ingredients acquired Wisconsin Whey Protein, adding high-end whey protein isolate capacity and strengthening its global high-protein ingredient supply and technological base.
- April 2025: Arla Foods Ingredients unveiled Lacprodan MicelPure micellar casein isolate designed for medical nutrition applications with improved taste and texture, expanding its clinical nutrition ingredient portfolio.
- March 2025: Arla Foods partnered with South Dakota-based Valley Queen to manufacture its Nutrilac ProteinBoost whey protein concentrate for the U.S., expanding regional production of milk protein ingredients.


Global Milk Protein Market Report Scope
The milk protein market comprises the production, processing, and commercialization of proteins derived from milk, primarily casein, whey protein, and their derivatives, used as functional and nutritional ingredients across food and beverages, dietary supplements, infant nutrition, clinical nutrition, animal feed, and personal care applications. The milk protein market is segmented by type (milk protein concentrate, milk protein isolate, hydrolyzed milk protein, concentrates, hydrolyzed, isolates), application (animal feed, food and beverages, personal care and cosmetics, supplements), and geography (Asia-Pacific, Europe, Middle East and Africa, North America, South America). The market forecasts are provided in terms of value (USD) and volume (tons).
Type
| Milk Protein Concentrate |
| Milk Protein Isolate |
| Hydrolyzed Milk Protein |
Application
| Animal Feed | |
| Personal Care and Cosmetics | |
| Food and Beverages | Bakery |
| Beverages | |
| Breakfast Cereals | |
| Condiments/Sauces | |
| Dairy and Dairy Alternative Products | |
| Meat/Poultry/Seafood and Meat Alternative Products | |
| RTE/RTC Food Products | |
| Snacks | |
| Supplements | Baby Food and Infant Formula |
| Elderly Nutrition and Medical Nutrition | |
| Sport/Performance Nutrition |
By Geography
| North America | United States |
| Canada | |
| Rest of North America | |
| Europe | Germany |
| United Kingdom | |
| Italy | |
| France | |
| Spain | |
| Rest of Europe | |
| Asia-Pacific | China |
| India | |
| Japan | |
| Indonesia | |
| Australia | |
| Rest of Asia-Pacific | |
| South America | Brazil |
| Argentina | |
| Rest of South America | |
| Middle East and Africa | South Africa |
| Saudi Arabia | |
| United Arab Emirates | |
| Rest of Middle East and Africa |
| Type | Milk Protein Concentrate | |
| Milk Protein Isolate | ||
| Hydrolyzed Milk Protein | ||
| Application | Animal Feed | |
| Personal Care and Cosmetics | ||
| Food and Beverages | Bakery | |
| Beverages | ||
| Breakfast Cereals | ||
| Condiments/Sauces | ||
| Dairy and Dairy Alternative Products | ||
| Meat/Poultry/Seafood and Meat Alternative Products | ||
| RTE/RTC Food Products | ||
| Snacks | ||
| Supplements | Baby Food and Infant Formula | |
| Elderly Nutrition and Medical Nutrition | ||
| Sport/Performance Nutrition | ||
| By Geography | North America | United States |
| Canada | ||
| Rest of North America | ||
| Europe | Germany | |
| United Kingdom | ||
| Italy | ||
| France | ||
| Spain | ||
| Rest of Europe | ||
| Asia-Pacific | China | |
| India | ||
| Japan | ||
| Indonesia | ||
| Australia | ||
| Rest of Asia-Pacific | ||
| South America | Brazil | |
| Argentina | ||
| Rest of South America | ||
| Middle East and Africa | South Africa | |
| Saudi Arabia | ||
| United Arab Emirates | ||
| Rest of Middle East and Africa | ||


Market Definition
- End User - The Protein Ingredients Market operates on a B2B basis. Food, Beverages, Supplements, Animal Feed, and Personal Care & Cosmetic manufacturers are considered to be end-consumers in the market studied. The scope excludes manufacturers buying liquid/dry whey to be used for application as a binding agent or thickener or other non-protein applications.
- Penetration Rate - Penetration Rate is defined as the percentage of Protein-Fortified End User Market Volume in the Overall End User Market Volume.
- Average Protein Content - Average protein content is the average protein content present per 100 g of product manufactured by all end-user companies considered under the scope of this report.
- End User Market Volume - End-user market volume is the consolidated volume of all types and forms of end-user products in the country or region.
| Keyword | Definition |
|---|---|
| Alpha-lactalbumin (α-Lactalbumin) | It is a protein that regulates the production of lactose in the milk of almost all mammalian species. |
| Amino acid | It is an organic compound that contains both amino and carboxylic acid functional groups, which are required for the synthesis of body protein and other important nitrogen-containing compounds, such as creatine, peptide hormones, and some neurotransmitters. |
| Blanching | It is the process of briefly heating vegetables with steam or boiling water. |
| BRC | British Retail Consortium |
| Bread improver | It is a flour-based blend of several components with specific functional properties designed to modify dough characteristics and give quality attributes to bread. |
| BSF | Black Soldier Fly |
| Caseinate | It is a substance produced by adding an alkali to acid casein, a derivative of casein. |
| Celiac disease | Celiac disease is an immune reaction to eating gluten, a protein found in wheat, barley, and rye. |
| Colostrum | It is a milky fluid that’s released by mammals that have recently given birth before breast milk production begins. |
| Concentrate | It is the least processed form of protein and has a protein content ranging from 40-90% by weight. |
| Dry protein basis | It refers to the percentage of "pure protein" present in a supplement after the water in it is completely removed through heat. |
| Dry whey | It is the product resulting from drying fresh whey which has been pasteurized and to which nothing has been added as a preservative. |
| Egg protein | It is a mixture of individual proteins, including ovalbumin, ovomucoid, ovoglobulin, conalbumin, vitellin, and vitellenin. |
| Emulsifier | It is a food additive that facilitates the blending of foods that are immiscible with one another, such as oil and water. |
| Enrichment | It is the process of addition of micronutrients that are lost during the processing of the product. |
| ERS | Economic Research Service of the USDA |
| Extrusion | It is the process of forcing soft mixed ingredients through an opening in a perforated plate or die designed to produce the required shape. The extruded food is then cut to a specific size by blades. |
| Fava | Also known as Faba, it is another word for yellow split beans. |
| FDA | Food and Drug Administration |
| Flaking | It is a process in which typically a cereal grain (like corn, wheat, or rice) is broken down into grits, cooked with flavors and syrups, and then pressed into flakes between cooled rollers. |
| Foaming agent | It is a food ingredient that makes it possible to form or maintain a uniform dispersion of a gaseous phase in a liquid or solid food. |
| Foodservice | It refers to the part of the food industry which includes businesses, institutions, and companies which prepare meals outside the home. It includes restaurants, school and hospital cafeterias, catering operations, and many other formats. |
| Fortification | It is the deliberate addition of micronutrients that are not found in them naturally or which are lost during processing, to improve a food product's nutritional value. |
| FSANZ | Food Standards Australia New Zealand |
| FSIS | Food Safety and Inspection Service |
| FSSAI | Food Safety and Standards Authority of India |
| Gelling agent | It is an ingredient that functions as a stabilizer and thickener to provide thickening without stiffness through the formation of gel. |
| GHG | Greenhouse Gas |
| Gluten | It is a family of proteins found in grains, including wheat, rye, spelt, and barley. |
| Hemp | It is a botanical class of Cannabis sativa cultivars grown specifically for industrial or medicinal use. |
| Hydrolysate | It is a form of protein manufactured by exposing the protein to enzymes that can partially break the bonds between the protein's amino acids and break down large, complicated proteins into smaller pieces. Its processing makes it easier and quicker to digest. |
| Hypoallergenic | It refers to a substance that causes fewer allergic reactions. |
| Isolate | It is the purest and most processed form of protein which has undergone separation to obtain a pure protein fraction. It typically contains ≥ 90% of protein by weight. |
| Keratin | It is a protein that helps form hair, nails, and the outer layer of skin. |
| Lactalbumin | It is the albumin contained in milk and obtained from whey. |
| Lactoferrin | It is an iron‑binding glycoprotein that is present in the milk of most mammals. |
| Lupin | It is the yellow legume seeds of the genus Lupinus. |
| Millenial | Also known as Generation Y or Gen Y, it refers to the people born from 1981 to 1996. |
| Monogastric | It refers to an animal with a single-compartmented stomach. Examples of monogastric include humans, poultry, pigs, horses, rabbits, dogs, and cats. Most monogastric are generally unable to digest much cellulose food materials such as grasses. |
| MPC | Milk protein concentrate |
| MPI | Milk protein isolate |
| MSPI | Methylated soy protein isolate |
| Mycoprotein | Mycoprotein is a form of single-cell protein, also known as fungal protein, derived from fungi for human consumption. |
| Nutricosmetics | It is a category of products and ingredients that act as nutritional supplements to care for skin, nails, and hair natural beauty. |
| Osteoporosis | It is a medical condition in which the bones become brittle and fragile from loss of tissue, typically as a result of hormonal changes, or deficiency of calcium or vitamin D. |
| PDCAAS | Protein digestibility-corrected amino acid score (PDCAAS) is a method of evaluating the quality of a protein based on both the amino acid requirements of humans and their ability to digest it. |
| Per-capita consumption of animal protein | It is the average amount of animal protein (such as milk, whey, gelatin, collagen, and egg proteins) that is readily available for consumption by each person in an actual population. |
| Per-capita consumption of plant protein | It is the average amount of plant protein (such as soy, wheat, pea, oat, and hemp proteins) that is readily available for consumption by each person in an actual population. |
| Quorn | It is a microbial protein manufactured using mycoprotein as an ingredient, in which the fungus culture is dried and mixed with egg albumen or potato protein, which acts as a binder, and then is adjusted in texture and pressed into various forms. |
| Ready-to-Cook (RTC) | It refers to food products that include all of the ingredients, where some preparation or cooking is required through a process that is given on the package. |
| Ready-to-Eat (RTE) | It refers to a food product prepared or cooked in advance, with no further cooking or preparation required before being eaten. |
| RTD | Ready-to-Drink |
| RTS | Ready-to-Serve |
| Saturated fat | It is a type of fat in which the fatty acid chains have all single bonds. It is generally considered unhealthy. |
| Sausage | It is a meat product made of finely chopped and seasoned meat, which may be fresh, smoked, or pickled and which is then usually stuffed into a casing. |
| Seitan | It is a plant-based meat substitute made out of wheat gluten. |
| Softgel | It is a gelatin-based capsule with a liquid fill. |
| SPC | Soy protein concentrate |
| SPI | Soy protein isolate |
| Spirulina | It is a biomass of cyanobacteria that can be consumed by humans and animals. |
| Stabilizer | It is an ingredient added to food products to help maintain or enhance their original texture, and physical and chemical characteristics. |
| Supplementation | It is the consumption or provision of concentrated sources of nutrients or other substances that are intended to supplement nutrients in the diet and is intended to correct nutritional deficiencies. |
| Texturant | It is a specific type of food ingredient that is used to control and alter the mouthfeel and texture of food and beverage products. |
| Thickener | It is an ingredient that is used to increase the viscosity of a liquid or dough and make it thicker, without substantially changing its other properties. |
| Trans fat | Also called trans-unsaturated fatty acids or trans fatty acids, it is a type of unsaturated fat that naturally occurs in small amounts in meat. |
| TSP | Textured soy protein |
| TVP | Textured vegetable protein |
| WPC | Whey protein concentrate |
| WPI | Whey protein isolate |


Research Methodology
Mordor Intelligence follows a four-step methodology in all our reports.
- Step-1: Identify Key Variables: The quantifiable key variables (industry and extraneous) pertaining to the specific product segment and country are selected from a group of relevant variables & factors based on desk research & literature review; along with primary expert inputs. These variables are further confirmed through regression modeling (wherever required).
- Step-2: Build a Market Model: In order to build a robust forecasting methodology, the variables and factors identified in Step-1 are tested against available historical market numbers. Through an iterative process, the variables required for market forecast are set and the model is built on the basis of these variables.
- Step-3: Validate and Finalize: In this important step, all market numbers, variables and analyst calls are validated through an extensive network of primary research experts from the market studied. The respondents are selected across levels and functions to generate a holistic picture of the market studied.
- Step-4: Research Outputs: Syndicated Reports, Custom Consulting Assignments, Databases & Subscription Platforms


