Market Overview
| Study Period | 2018 - 2031 |
|---|---|
| Forecast Data Period | 2026 - 2031 |
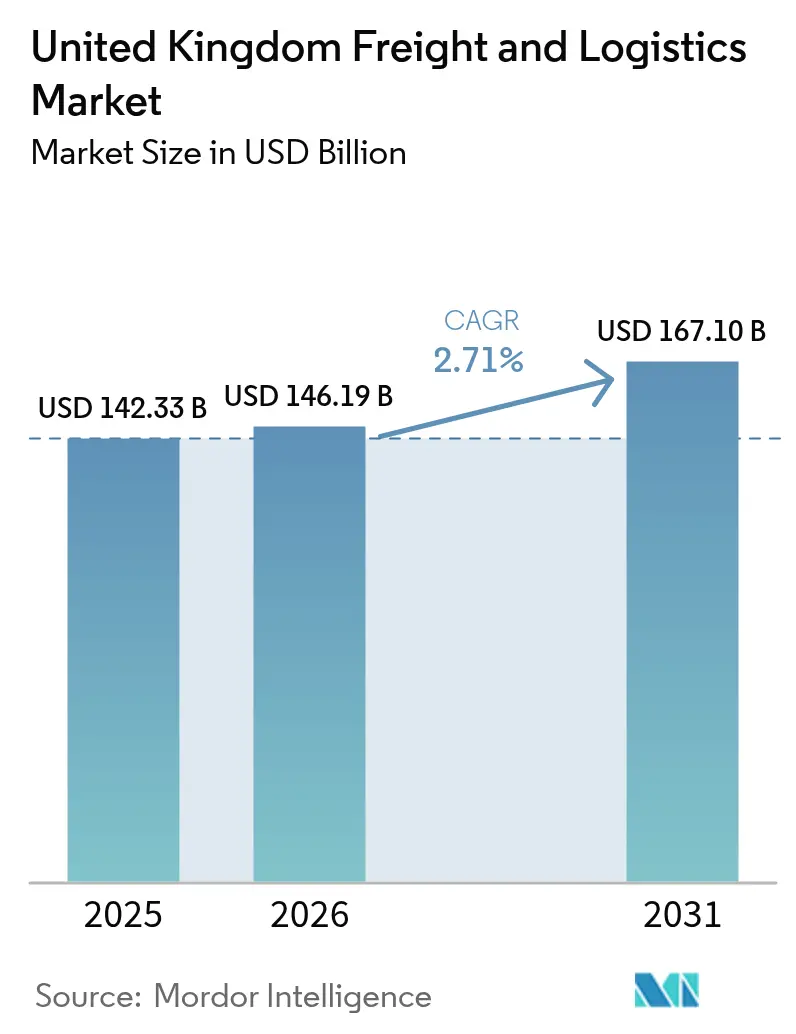
| Base Year Market Size (2025) | USD 142.33 Billion |
| Market Size (2026) | USD 146.19 Billion |
| Market Size (2031) | USD 167.1 Billion |
| Growth Rate (2026 - 2031) | 2.71% CAGR |
| Market Concentration | Low |
Major Players *Disclaimer: Major Players sorted in no particular order Image © Mordor Intelligence. Reuse requires attribution under CC BY 4.0. | |
United Kingdom Freight And Logistics Market Analysis by Mordor Intelligence
The United Kingdom freight and logistics market size is expected to grow from USD 142.33 billion in 2025 to USD 146.19 billion in 2026 and is forecast to reach USD 167.1 billion by 2031 at 2.71% CAGR over 2026-2031. This steady trajectory reflects a mature yet adaptive sector that is reshaping itself around e-commerce fulfillment, manufacturing near-shoring, and digital customs processing. Parcel density gains in urban areas, automation of broker workflows, and infrastructure commitments at deep-sea ports are reinforcing throughput momentum, while an aging driver pool and geopolitical shipping shocks temper the growth curve. Balance across road, rail, sea, and air modes keeps the United Kingdom freight and logistics market resilient, even as Red Sea re-routing inflates inbound costs and lithium-battery insurance requirements complicate premium air cargo flows. Competitive intensity remains moderate, with recent blockbuster acquisitions indicating a shift toward scale, technology depth, and environmental compliance advantages.
Key Report Takeaways
- By logistics function, freight transport commanded 63.02% of the United Kingdom freight and logistics market size in 2025, while courier, express, and parcel (CEP) services are projected to expand at a 3.12% CAGR between 2026-2031.
- By end user industry, manufacturing held 36.85% of the United Kingdom freight and logistics market share in 2025, while wholesale and retail trade is forecast to grow at a 2.97% CAGR between 2026-2031.
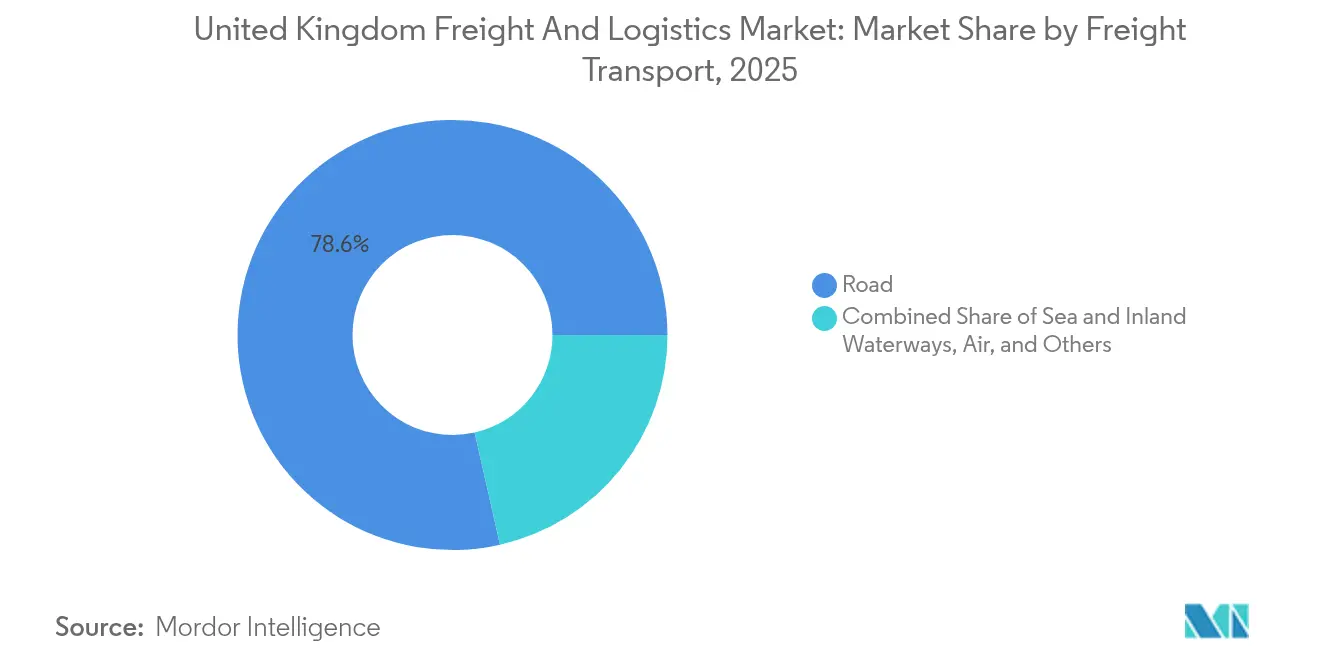
- By freight transport mode, road freight accounted for 78.55% of the revenue share in 2025, whereas air freight is expected to post the fastest 3.05% CAGR between 2026-2031.
- By courier, express, and parcel service type, domestic deliveries represented 64.60% of revenue share in 2025, while international services are set to achieve a 3.27% CAGR between 2026-2031.
- By warehousing and storage type, non-temperature controlled facilities comprised 92.10% of revenue share in 2025, whereas temperature controlled capacity is anticipated to grow at a 2.6% CAGR between 2026-2031.
- By freight forwarding mode, sea and inland waterway freight forwarding captured 55.15% revenue share in 2025, while air freight forwarding is projected to record the fastest 2.74% CAGR between 2026-2031.
Note: Market size and forecast figures in this report are generated using Mordor Intelligence’s proprietary estimation framework, updated with the latest available data and insights as of 2026.
United Kingdom Freight And Logistics Market Trends and Insights
Drivers Impact Analysis*
| Driver | ( ~ ) % Impact on CAGR Forecast | Geographic Relevance | Impact Timeline |
|---|---|---|---|
| E-commerce rebound boosts parcel density | +1.1% | Greater London, Manchester, Birmingham | Short term (≤ 2 years) |
| Manufacturing near-shoring lifts mid-haul volumes | +0.9% | North West, West Midlands, South East | Medium term (2-4 years) |
| Customs-broker automation accelerates digital forwarding | +0.6% | Felixstowe, Southampton, Liverpool, London Gateway | Medium term (2-4 years) |
| Growth in online grocery and same-day delivery scales urban micro-fulfillment | +0.4% | London, Manchester, Birmingham, Glasgow, Edinburgh | Short term (≤ 2 years) |
| Renewable-energy project-cargo surge | +0.3% | Scotland, Wales, North Sea | Long term (≥ 4 years) |
| AI-optimised cold-chain capacity gains | +0.1% | National hubs | Medium term (2-4 years) |
| Source: Mordor Intelligence | |||


E-Commerce Rebound Boosts Parcel Density
Robust U.K. online retail spending in 2025 is lifting parcel stops per route, which lowers per-delivery cost and improves same-day service economics. Amazon’s exit from brick-and-mortar grocery and renewed focus on home delivery underline a digital-first mindset. Quick-commerce operators such as Co-op now reach 83% of households, while Gopuff’s partnership with Morrisons repurposes daytime store capacity to dark-store operations. Dense origin-destination clusters in Greater London and Manchester have seen micro-fulfillment throughput rise 40-50% per square foot, encouraging further investment in urban sortation robotics. These density gains sustain the United Kingdom freight and logistics market by offsetting labor and fuel inflation and by anchoring scale for alternative-fuel fleets[1]“Tesco turns up fridge temperatures as trial cuts energy costs,” The Grocer, thegrocer.co.uk.
Manufacturing Near-Shoring Lifts Mid-Haul Volumes
Defense procurement, pharmaceuticals, and precision engineering are fueling a gradual relocation of supplier footprints from continental Europe back to the United Kingdom. Output from regional clusters in the North West and West Midlands is projected to rise 12% by 2033, adding mid-haul freight demand between industrial parks and export gateways. BAE Systems’ new 96,000-square-foot facility in Sheffield exemplifies the shift, while 69% of manufacturers plan to deepen domestic sourcing. Consistent order flows smooth utilization on trunk routes, underpinning capacity investments by hauliers and rail-freight operators across the United Kingdom freight and logistics market[2]“Transport workforce statistics,” UK Government, gov.uk.
Customs-Broker Automation Accelerates Digital Forwarding
Complex post-Brexit documentation and the staggered Border Target Operating Model have spurred venture funding for artificial-intelligence brokerage software. HappyRobot’s USD 15.6 million Series A round illustrates investor faith in automated data capture, tariff classification, and predictive clearance. Ports such as Felixstowe and Southampton report 25-30% shorter dwell times for digitally processed consignments, giving tech-enabled forwarders a competitive edge. Faster border passage increases asset turns and reinforces the multimodal agility that distinguishes the United Kingdom freight and logistics market from continental peers.
Growth in Online Grocery and Same-Day Delivery Scales Urban Micro-Fulfillment
Ocado’s On-Grid Robotic Pick system handled more than 30 million items in 2024, blending machine vision, reinforcement learning, and diffusion models to pack mixed-temperature baskets efficiently. Tesco’s artificial-intelligence refrigeration program cut 4 GWh of energy by raising chilled-storage temperatures by 1°C while preserving food safety. Automation uptake is slated to double by 2027, enabling sustainable same-day propositions in secondary cities and broadening the revenue base of the United Kingdom freight and logistics market[3]“£1 billion north-east Wales investment zone makes significant progress,” GOV.Wales, gov.wales.
Restraints Impact Analysis*
| Restraint | ( ~ ) % Impact on CAGR Forecast | Geographic Relevance | Impact Timeline |
|---|---|---|---|
| Driver workforce ageing and low apprentice intake | -0.7% | National, acute in Scotland and Northern England | Long term (≥ 4 years) |
| West-coast port dredge delays strain road corridors | -0.4% | Liverpool, Manchester Ship Canal | Medium term (2-4 years) |
| Red Sea re-routing inflates U.K. import freight rates | -0.3% | National import flows | Short term (≤ 2 years) |
| Lithium-battery insurance hikes curb air-freight demand | -0.1% | Heathrow, East Midlands, Manchester | Medium term (2-4 years) |
| Source: Mordor Intelligence | |||
Driver Workforce Ageing and Low Apprentice Intake
The median age of heavy-goods-vehicle operators has climbed past 55, while apprenticeship enrollments lag replacements by roughly 40%. Rising wage bills of 15-20% and tight certification windows push carriers toward autonomous-vehicle pilots and flexible shift scheduling. Scarcity is most pronounced in temperature-controlled and hazardous-materials niches, elevating operating risk across the United Kingdom freight and logistics market.
West-Coast Port Dredge Delays Strain Road Corridors
Maintenance setbacks at Liverpool and the Manchester Ship Canal prevent larger draft vessels from calling, shifting cargo to congested road arteries. The proposed Liverpool–Manchester Railway could remove 321,000 annual HGV trips, yet construction is unlikely before the early 2030s. Until then, elevated truck mileage raises costs and emissions for shippers in the United Kingdom freight and logistics market[4]“Liverpool-Manchester Railway board seeks early 2030s build start,” Rail Magazine, railmagazine.com.
*Our forecasts treat driver/restraint impacts as directional, not additive. The impact forecasts reflect baseline growth, mix effects, and variable interactions.
Segment Analysis
By End User Industry: Manufacturing Resilience Drives Diversification
Manufacturing generated 36.85% of turnover in 2025, benefitting from pharmaceutical and aerospace clusters in the North West and South West. Domestic sourcing trends, with 69% of producers planning to add U.K. suppliers, anchor steady mid-haul volumes. Wholesale and Retail Trade, expanding at a 2.97% CAGR (2026-2031), reflects grocery e-commerce diffusion and omnichannel fulfillment.
The United Kingdom freight and logistics market share for Wholesale and Retail Trade is set to climb by 2 percentage points by 2031 as quick-commerce networks extend beyond London. Construction logistics ride public-sector infrastructure programs, while Oil, Gas, Mining, and Quarrying pivot to offshore wind and hydrogen pipelines. The “Others” bucket covers nascent verticals such as renewable-equipment logistics, reinforcing demand diversification across the United Kingdom freight and logistics market.


By Logistics Function: Digital Integration Reshapes Service Boundaries
Freight Transport owned 63.02% of 2025 revenue in the United Kingdom freight and logistics market, leveraging seamless connectivity between ports, airports, and Midlands distribution hubs. Courier, Express, and Parcel services enjoy a 3.12% CAGR (2026-2031) on the back of higher parcel density and autonomous sortation rollouts. Active consolidation blurs traditional silos, with multi-service providers bundling transport, warehousing, and brokerage to win end-to-end contracts.
The United Kingdom freight and logistics market size for the Courier, Express, and Parcel segment is projected to reach USD 24.18 billion by 2031, supported by 24-hour delivery expectations. Warehousing and Storage gains from inventory-buffer strategies, while Freight Forwarding pivots on customs-automation economies. Specialized “Other Services”, such as project cargo and reverse logistics, monetise the renewable-energy cycle and circular supply chains, showing resilience against macro-volatility.
By Courier, Express, and Parcel: International Growth Outpaces Domestic
Domestic CEP services covered 64.60% of revenue share in 2025, propelled by grocery subscriptions and same-day delivery. International deliveries are on track for a 3.27% CAGR (2026-2031) as SMEs leverage digital customs portals to reach European and transatlantic buyers.
Cross-border e-commerce platforms integrate duty-paid options at checkout, lifting conversion and parcel volumes through Heathrow and East Midlands. Domestic operators sharpen profitability via hub-and-spoke densification and electric van rollouts, sustaining scale benefits within the United Kingdom freight and logistics market.
By Warehousing and Storage: Temperature control drives premium growth
Non-temperature controlled facilities captured 92.10% of revenue share in 2025, serving discretionary goods and replenishment stock. Temperature controlled assets, showing a 2.6% CAGR (2026-2031), answer stricter GDP and HACCP protocols. AI-powered HVAC optimization has cut cold-store energy by 30%, enhancing margin headroom.
DP World’s June 2024 megawarehouse exemplifies the push for integrated port-centric logistics, while Americold’s Port Saint John venture brings North Atlantic cold-chain synergies to U.K. trade partners. Inventory-buffer behavior post-Brexit keeps overall warehouse absorption healthy in the United Kingdom freight and logistics market.
By Freight Transport: Modal optimization balances cost and speed
Road freight retained 78.55% of 2025 revenue share, aided by 246,000 kilometers of paved network and a dense warehouse footprint. Air freight, forecast at a 3.05% CAGR, answers high-value pharmaceutical exports, even as lithium-battery limits bite. Network bottlenecks cap rail freight growth, yet carbon-reduction goals and potential rail-freight grants could unlock latent capacity.
Sea and inland waterway freight flows manage bulk commodities and containerized imports, processing 434.9 million tonnes in 2023. Pipeline transport remains niche but essential for energy and chemical corridors. Multimodal routing technology and schedule reliability improvements enable shippers to trade off cost and speed, preserving competitiveness for the United Kingdom freight and logistics market.
By Freight Forwarding: Air Services Capitalize on Premium Demand
Sea and inland waterway freight forwarding managed 55.15% of 2025 revenue share, yet faces cost headwinds from Red Sea diversions. Air freight forwarding, rising at a 2.74% CAGR (2026-2031), exploits pharmaceutical urgency and high-value export niches. Digitally native forwarders tout single-view dashboards and predictive ETAs, winning contracts from traditional brokers.
Multimodal solutions dominate the “Others” category, offering combined air-sea or sea-rail routings that hedge delay risks. Investment in blockchain-backed bills of lading and automated tariff classification cements the United Kingdom freight and logistics market as a pioneer in digital forwarding efficiency.
Geography Analysis
London and the South East absorbed the largest slice of United Kingdom freight and logistics market activity in 2024, leveraging proximity to continental Europe and a dense consumption base. Scotland follows a fast-growth trajectory through 2030 on the back of offshore-wind component flows and food-and-beverage exports, adding new corridors to mainland hubs. The North West benefits from pharmaceutical clusters and the expanding transatlantic gateway at Liverpool, while the West Midlands aligns with automotive and aerospace production demand.
Wales advances through the GBP 1 billion (USD 1.27 billion) Wrexham and Flintshire Investment Zone, unlocking 5.5 million square feet of logistics capacity and 6,000 jobs. Northern Ireland leverages Belfast Harbour’s temperature-controlled expansion and RoRo connectivity to sustain dual-market access. England’s eastern seaboard, led by Felixstowe and London Gateway, maintains container primacy, whereas the west coast chases hinterland share via new Asia-Liverpool direct loops.
Regional specialization deepens: pharmaceuticals in the North West, aerospace in the South West, defense in the West Midlands, and e-commerce fulfillment around London. Renewable-energy corridors in Scotland and Wales catalyze heavy-lift demand, closing infrastructural gaps that have historically favored road over rail. The geographic mosaic ensures balanced growth momentum across the United Kingdom freight and logistics market.
Competitive Landscape
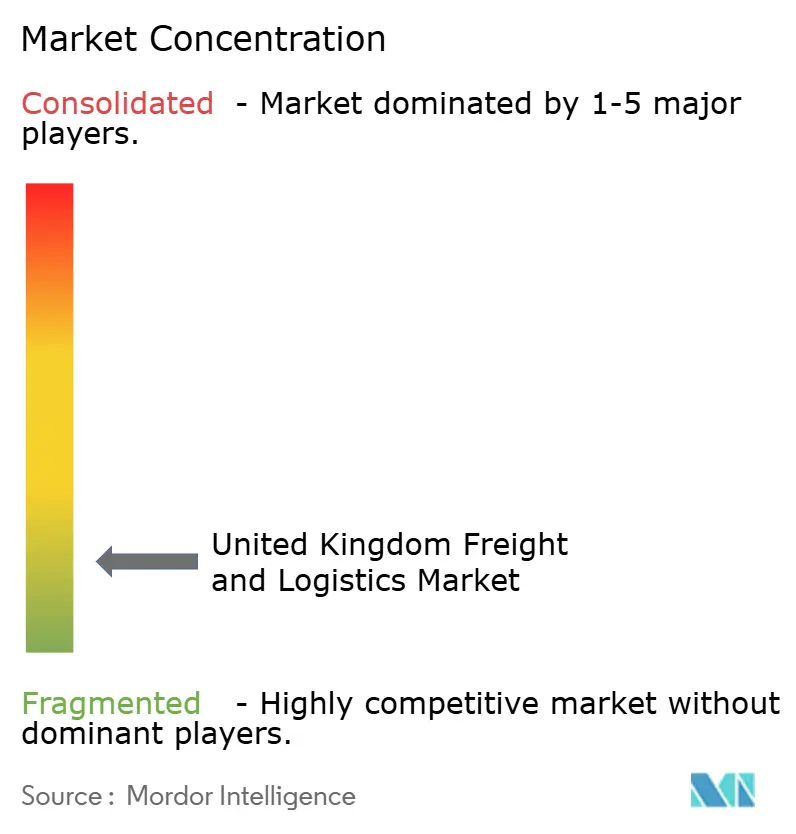
The United Kingdom freight and logistics market displays fragmentation: legacy incumbents such as Royal Mail, DHL, and Wincanton coexist with regional specialists and venture-backed digital entrants. DSV’s EUR 14.3 billion (USD 15.78 billion) acquisition of DB Schenker in 2024 created a global giant with scale synergies, while DHL’s partnership with Evri illustrates collaborative distribution strategies.
Technology adoption differentiates leaders. AI-enabled customs engines, robotic sorters, and predictive maintenance platforms compress cost per unit and raise on-time performance. White-space opportunities emerge in project-cargo for offshore wind, pharma cold-chain, and cross-border e-commerce where specialized know-how commands premium pricing.
Asset investors, including Pontegadea’s 49% stake in PD Ports, continue to channel capital into port estates and rail terminals, betting on long-term throughput growth. Compliance with the Border Target Operating Model raises barriers to entry, favoring operators with mature digital documentation capabilities and established trade-lane expertise.
United Kingdom Freight And Logistics Industry Leaders
DHL Group
GXO Logistics, Inc. (Including Wincanton PLC)
DSV A/S (Including DB Schenker)
Kuehne+Nagel
La Poste Group (Including DPD Group, and CitySprint (UK) Ltd.)
- *Disclaimer: Major Players sorted in no particular order

Recent Industry Developments
- May 2025: Americold committed USD 75–80 million to a cold-storage facility at Port Saint John in partnership with DP World and CPKC, promising up to 100 jobs.
- February 2025: PD Ports acquired the 190-acre Groveport complex on the River Trent, expanding bulk-cargo handling footprint.
- June 2024: DP World opened its largest-ever U.K. warehouse, bolstering contract logistics and inland distribution capabilities.
- June 2024: Peel Ports launched MSC’s Britannia Asia-Liverpool standalone loop, adding direct Far East connectivity to the Mersey.


United Kingdom Freight And Logistics Market Report Scope
Agriculture, Fishing, and Forestry, Construction, Manufacturing, Oil and Gas, Mining and Quarrying, Wholesale and Retail Trade, Others are covered as segments by End User Industry. Courier, Express, and Parcel (CEP), Freight Forwarding, Freight Transport, Warehousing and Storage are covered as segments by Logistics Function.End User Industry
| Agriculture, Fishing, and Forestry |
| Construction |
| Manufacturing |
| Oil and Gas, Mining and Quarrying |
| Wholesale and Retail Trade |
| Others |
Logistics Function
| Courier, Express, and Parcel (CEP) | By Destination Type | Domestic |
| International | ||
| Freight Forwarding | By Mode of Transport | Air |
| Sea and Inland Waterways | ||
| Others | ||
| Freight Transport | By Mode of Transport | Air |
| Pipelines | ||
| Rail | ||
| Road | ||
| Sea and Inland Waterways | ||
| Warehousing and Storage | By Temperature Control | Non-Temperature Controlled |
| Temperature Controlled | ||
| Other Services | ||
| End User Industry | Agriculture, Fishing, and Forestry | ||
| Construction | |||
| Manufacturing | |||
| Oil and Gas, Mining and Quarrying | |||
| Wholesale and Retail Trade | |||
| Others | |||
| Logistics Function | Courier, Express, and Parcel (CEP) | By Destination Type | Domestic |
| International | |||
| Freight Forwarding | By Mode of Transport | Air | |
| Sea and Inland Waterways | |||
| Others | |||
| Freight Transport | By Mode of Transport | Air | |
| Pipelines | |||
| Rail | |||
| Road | |||
| Sea and Inland Waterways | |||
| Warehousing and Storage | By Temperature Control | Non-Temperature Controlled | |
| Temperature Controlled | |||
| Other Services | |||


Market Definition
- Agriculture, Fishing, and Forestry (AFF) - This end user industry segment captures the external (outsourced) logistics expenditure incurred by the AFF industry players. The end user players considered are the establishments primarily engaged in growing crops, raising animals, harvesting timber, harvesting fish & other animals from their natural habitats and providing related support activities. Herein, Logistics Service Providers (LSPs) play a crucial role in acquisition, storage, handling, transportation, and distribution activities for the optimal & continuous flow of inputs (seeds, pesticides, fertilizers, equipment, and water) from manufacturers or suppliers to the producers and smooth flow of output (produce, agro-goods) to distributors/ consumers. This includes both termperature controlled and non-temperature controlled logistics, as and when required according to the shelf life of goods being transported or stored.
- Construction - This end user industry segment captures the external (outsourced) logistics expenditure incurred by the construction industry players. The end user players considered are the establishments primarily engaged in constructing, repairing and renovating residential & commercial buildings, infrastructure, engineering works, subdividing and developing land. Logistics Service Providers (LSPs) play a crucial role in increasing profitability of construction projects by maintaing the inventory of raw materials & equipment, time-critical supplies and by providing other value added services for effective project management.
- Courier, Express, and Parcel - The Courier, Express, and Parcel services, often called as CEP Market, refers to the logistics and postal service providers which specialize in moving small goods (parcels/packages). It captures the overall market size (USD) and market volume (number of parcels) of (1) the shipments/parcels/packages which are under 70kgs/ 154lbs weight, (2) Business Customer packages viz. Business-to-Business (B2B) & Business-to-Consumer (B2C) as well as private customer packages (C2C), (3) non-express parcel delivery services (Standard and Deferred) as well as express parcel delivery services (Day-Definite-Express and Time-Definite-Express), (4) domestic as well as international parcels.
- Demographics - To analyse total addressable market demand, population growth & forecasts have been studied and presented in this industry trend. It represents population distribution across categories like gender (male/female), development area (urban/rural), major cities among other key parameters like population density and final consumption expenditure (growth and share % of GDP). This data has been used for assessing the fluctations in demand & consumption expenditure, and the major hotspots (cities) of potential demand.
- Export Trends and Import Trends - Overall logistics performance of an economy is positively and significantly (statistically) correlated to its trade performance (exports and imports). Hence, in this industry trend, total value of trade, major commodities/ commodity groups and the major trade partners, for the studied geography (country or region as per the scope of report) have been analysed alongside the impact of major trade/logistics infrastructure investments & regulatory environment.
- Freight Forwarding - Freight forwarding which herein refers to the freight transportation arrangement (FTA) industry includes establishments primarily engaged in arranging & tracking transportation of freight between shippers and carriers. Logistics Service Providers (LSPs) considered are freight forwarders, NVOCCs, custom brokers and marine shipping agents. Others segment under Freight Forwarding captures the revenue earned through value added services of FTA like custom brokerage/clearance activities, preparation of freight related documentation, consolidation-deconsolidation of goods, cargo insurance & compliance, arrangement of warehousing & storage, liasing with shippers, and freight forwarding through other modes of transport viz. road and rail.
- Freight Pricing Trends - Freight pricing by mode of transport (USD/tonkm), over the review period, has been presented in this industry trend. The data has been used in assessing the inflationary environment, impact on trade, freight turnover (tonkm), freight and logistics market demand by mode of transport segments and hence the overall freight and logistics market size.
- Freight Tonnage Trends - Freight tonnage (weight of goods in tons) handled by mode of transport, over the review period, has been presented in this industry trend. The data has been used as one of the parameters apart from average distance per shipment (km), freight volume (tonkm), and freight pricing (USD/tonkm) to assess the freight transport market size.
- Freight Transport - Freight Transport refers to the hiring of a logistics service provider (outsourced logistics) for the transport of commodities (raw materials/final/intermediate/finished goods including both solids and fluids) from the origin to a destination within the country (domestic) or cross-border (international).
- Freight and Logistics - External expenditure on (or outsourced) facilitation of freight transport (freight transportation), arrangement of freight transport through an agent (freight forwarding), warehousing and storage (temperature controlled or non-temperature controlled), CEP (domestic or international courier, express and parcel) and other value-added logistics services involved in the transportation of commodities (raw materials or finished goods including both solids and fluids) from the origin to a destination within the country (domestic) or cross-border (international), through one or more modes of transportation viz. road, rail, sea, air and pipelines constitute freight and logistics market.
- Fuel Price - Fuel price spikes can cause delays and diruption for logistics service providers (LSPs), while drops in the same can result in higher short-term profitability and increased market rivalry to offer consumers with the best deals. Hence, the fuel price variations have been studied over the review period and presented along with the causes as well as market impacts.
- GDP Distribution by Economic Activity - Nominal Gross Domestic Product and distribution of the same, across major economic sectors in the geography studied (country or region as per scope of the report) have been studied and presented in this industry trend. As GDP is positively related to the profitability and growth of logistics industry, this data has been used in adjunction to the input-output tables/ supply-use tables for analyzing the potential major contributing sectors towards the logistics demand.
- GDP Growth by Economic Activity - Growth of Nominal Gross Domestic Product across major economic sectors, for the geography studied (country or region as per scope of the report) have been presented in this industry trend. This data has been utilized for assessing the growth of logistics demand from all the market end users (economic sectors considered here).
- Inflation - Variations in both Wholesale Price Inflation (YoY change in producer price index) and Consumer Price Inflation have been presented in this industry trend. This data has been used to assess the inflationary environment as it plays a vital role in smooth functioning of the supply chain, directly impacting the logistics operational cost components e.g., pricing of tyres, driver wages & benefits, energy/fuel prices, maintenace costs, toll charges, warehousing rents, custom brokerage, forwarding rates, courier rates etc. hence impacting the overall freight and logistics market.
- Infrastructure - As infrastructure plays a vital role in an economy's logistics performance, variables like length of roads, distribution of road length by surface category (paved v/s unpaved), distribution of road length by road classification (expressways v/s highways v/s other roads), rail length, volume of containers handled by major ports and tonnage handled by major airports have been analysed and presented in this industry trend.
- Key Industry Trends - The report section named "Key Industry Trends" include all the key variables/parameters studied to better analyze the market size estimates and forecasts. All the trends have been presented in the form of data points (time series or latest available data points) along with analysis of the paramter in the form of concise market relevant commentary, for the geography studied (country or region as per the scope of report).
- Key Strategic Moves - The action taken by a company to differentiate from its competitor or used as a general strategy is referred to as a key strategic move (KSM). This includes (1) Agreements (2) Expansions (3) Financial Restructuring (4) Mergers and Acquisitions (5) Partnerships, and (6) Product Innovations. Key players (Logistics Service Providers, LSPs) in the market have been shortlisted, their KSM have been studied and presented in this section.
- Liner Shipping Bilateral Connectivity Index - It indicates a country pair's integration level into global liner shipping networks and plays a crucial role in determining bilateral trade, which in turn potentially contributes toward the prosperity of a country and its surrounding region. Hence the major economies connected to the country/ region as per scope of the report, have been analyzed and presented in "Liner Shipping Connectivity" industry trend.
- Liner Shipping Connectivity - This industry trend analyses the state of connectivity to the global shipping networks based on the status of maritime transport sector. It includes the analysis of liner shipping connectivity, bilateral shipping connectivity, and port liner shipping connectivity indices for the geography (country/ region as per scope of the report) over the review period.
- Liner Shipping Connectivity Index - It indicates how well countries are connected to global shipping networks based on the status of their maritime transport sector. It is based on five components of the maritime transport sector: (1) The number of shipping lines servicing a country, (2) The size of the largest vessel used on these services (in TEUs), (3) The number of services connecting a country to the other countries, (4) The total number of vessels deployed in a country, (5) The total capacity of those vessels (in TEUs).
- Logistics Performance - Logistics Performance and Logistics Costs are the backbone of trade, and influences trade costs, making countries compete globally. Logistics performance is influenced by market wide adopted supply chain management strategies, government services, investments & policies, fuel/ energy costs, inflationary environment etc. Hence, in this industry trend, the logistics performance of the geography studied (country/ region as per the scope of report) has been analysed and presented over the review period.
- Major Truck Suppliers - Market share of truck brands is influenced by factors like geographical preferences, portfolio of truck types, truck prices, local production, truck repair & maintenance service peneteration, customer support, technological innovations (like electric vehicles, digitalization, autonomous trucks), fuel efficiency, financing options, annual maintenance costs, availability of substitutes, marketing startegies etc. Hence, the distribution (share % for base year of the study) of truck sales volume for leading truck brands and commentary on current market scenario & market anticipation over the forecast period have been presented in this industry trend.
- Manufacturing - This end user industry segment captures the external (outsourced) logistics expenditure incurred by the Manufacturing industry players. The end user players considered are the establishments primarily engaged in the chemical, mechanical or physical transformation of materials or substances into new products. Logistics Service Providers (LSPs) play a crucial role in maintaining a smooth flow of raw materials across the supply chain, enabling timely delivery of finished goods to distributors or end customers and storing & supplying the raw materials to clients for just-in-time manufacturing.
- Maritime Fleet Load Carrying Capacity - Maritime fleet load carrying capacity depicts the development state of an economy's maritime infrastructure & trade. It is influenced by factors like volume of production, international trade, major end user industries, maritime connectivity, environmental regulations, investments in port infrastructure development, port container cargo handling capacity etc. This industry trend represents the maritime fleet load carrying capacity by type of ship viz. container ships, oil tankers, bulk carriers, general cargo, among other types alongwith the influencing factors for the geography studied (country/ region as per scope of the report), over the review period.
- Modal Share - Freight Modal Share is influenced by factors like modal productivity, government regulations, containerization, distance of shipment, temperature control requirements, type of goods, international trade, terrain, speed of delivery, shipment weight, bulk shipments, etc. Also, modal share by tonnage (tons) and modal share by freight turnover (ton-km) differ as per average distance of shipments, weight of major commodity groups transported in the economy and number of trips. This industry trend represents the distribution of freight transported by mode of transport (tons as well as ton-km), for the study base year.
- Oil and Gas, Mining and Quarrying - This end user industry segment captures the external (outsourced) logistics expenditure incurred by the extraction industry players. The end user players considered are the establishments that extract naturally occurring mineral solids, such as coal and ores; liquid minerals, such as crude petroleum; and gases, such as natural gas. Logistics Service Providers (LSPs) covers entire phases from upstream to downstream and plays a crucial role in the transportation of machinery, drilling equipments, extracted minerals, crude oil & natural gas and refined/ processed products from one place to another.
- Other End Users - Other end user segment captures the external (outsourced) logistics expenditure incurred by the financial services (BFSI), real estate, educational services, healthcare, and professional services (administrative, waste management, legal, architectural, engineering, design, consulting, scientific R&D). Logistics Service Providers (LSPs) plays a crucial role in the reliable movement of supplies and documents to/from these industries such as transporting any equipment or resources required, shipping confidential documents and files, movement of medical goods & supplies (surgical supplies and instruments, including gloves, masks, syringes, equipment) to name a few.
- Other Services - Other Services segment captures revenue earned through (1) Value added services (VAS) for freight transportation by road, rail, air and sea & inland waterways, (2) VAS for marine cargo transportation (operation of terminal facilities such as harbours and piers, operation of waterway locks, navigation, pilotage and berthing activities, lighterage, salvage activities, lighthouse activities, among other miscellaneous support activities), (3) VAS for land freight transportation (operation of terminal facilities such as railway stations, stations for the handling of goods, operation of railroad infrastructure, switching and shunting, towing and road side assistance, liquefaction of gas for transportation purposes, among other miscellaneous support activities), (4) VAS for air cargo transportation (operation of terminal facilities such as airway terminals, airport and air-traffic-control activities, ground service activities on airfields, runway maintenance, inspection/ ferrying/ maintenance/ testing of aircrafts, aircraft fuelling services, among other miscellaneous support activities), (5) VAS for warehousing and storage service (operation of grain silos, general merchandise warehouses, refrigerated warehouses, storage tanks etc., storage of goods in foreign trade zones, blast freezing, crating goods for shipping, packing and preparing goods for shipping, labelling and/or imprinting the package, kit assembling and packaging services, among other miscellaneous support activities), and (6) VAS for courier, express and parcel service (pickup, sorting).
- Port Calls and Performance - The performance of ports is key to an economy's freight movement, trade, global connectivity, successful growth strategies, investment attractiveness for production & distribution systems, and thus affects GDP, employment, per capita income and industrial growth. Hence, the port perfomance parameters like median time spent by vessels in the ports; average age, size, cargo carrying capacity, container carrying capacity, of vessels entering the ports, port calls, and container port throughput have been analysed and presented in this industry trend.
- Port Liner Shipping Connectivity Index - It reflects a port's position in the global liner shipping network, wherein a higher value of index is associated with better connectivity. Efficient and well-connected ports (1) contribute towards minimizing transport costs, linking supply chains and supporting international trade, (2) pave the way for economies of scale and development of expertise by permitting producers to better exploit possibilities in domestic as well as foreign markets. Hence the major ports of strategic importance, in the country/ region as per scope of the report, have been analyzed and presented in "Liner Shipping Connectivity" industry trend.
- Port Throughput - It reflects the amount of cargo or number of vessels a port handles annually. It can be related to (1) cargo tonnage, (2) container TEU, and (3) vessel calls. Port throughput in terms of total containers handled (TEU's), has been presented in the "Port Calls and Performance" industry trend.
- Producer Price Inflation - It indicates inflation from viewpoint of the producers viz. the average selling price received for their output over a period of time. Annual change (YoY) of producer price index is reported as wholesale price inflation in the "Inflation" industry trend. As WPI captures dynamic price movements in most comprehensive way, it is widely used by governments, banks, industry, business circles and is deemed important in formulation of trade, fiscal and other economic policies. The data has been used in adjunction to consumer price inflation for better understanding the inflationary environment.
- Segmental Revenue - Segmental Revenue has been triangulated or computed and presented for all the major players in the market. It refers to the freight and logistics market specific revenue earned by the company, over the base year of study, in the geography studied (country or region as per the scope of report). It is computed through the study and analysis of major parameters like financials, service portfolio, employee strength, fleet size, investments, number of countries present in, major economies of concern, etc. that have been reported by the company in its annual reports, webpage. For companies having scarce financial disclosures, paid databases like D&B Hoovers, Dow Jones Factiva have been resorted to and verified through industry/expert interactions.
- Transport and Storage Sector GDP - Value and growth of Transport and Storage Sector GDP has a direct relation to the freight and logistics market size. Hence, this variable has been studied and presented over the review period, in value terms (USD) and as share % of total GDP, in this industry trend. The data has been supported by concise and relevant commentary around the investments, developments, and current market scenario.
- Trends in E-Commerce Industry - Enhanced internet connectivity and boom in smartphone penetration, coupled with increasing disposable incomes, has led to a phenomenal growth in the e-commerce market globally. Online shoppers require fast and efficient delivery of their orders leading to an increase in the demand for logistics services especially e-commerce fulfilment services. Hence, the Gross Merchandise Value (GMV), historial and projected growth, breakup of major commodity groups in e-commerce industry for the studied geography (country or region as per scope of the report) have been analysed and presented in this industry trend.
- Trends in Manufacturing Industry - Manufacturing industry involves the transformation of raw materials into finished products, while logistics industry ensures the efficient flow of raw materials to the factory, and the transport of manufactured products to the distributors & consumers. Demand-Supply of both industries are highly cross-linked and critical for a seamless supply chain. Hence, the Gross Value Added (GVA), breakup of GVA into major manufacturing sectors, and growth of manufacturing industry over the review period have been analysed and presented, in this industry trend.
- Trucking Fleet Size By Type - Market share of truck types is influenced by factors like geographical preferences, major end user industries, truck prices, local production, truck repair & maintenance service peneteration, customer support, technological disruptions (like electric vehicles, digitalization, autonomous trucks) etc. Hence, the distribution (share % for base year of study) of truck parc volume by type of truck, market disruptors, truck manufacturing investments, truck specifications, truck use & import regulations, and market anticipation over the forecast period have been presented in this industry trend.
- Trucking Operational Costs - The prime reasons for measuring/ benchmarking logistics performance of any trucking company are to reduce operational costs and increase profitability. On the other hand, measuring operational costs helps to identify whether and where to make operational changes to control expenses and identify areas for improved performance. Hence, in this industry trend, trucking operational costs and the variables involved viz. driver wages & benefits, fuel prices, repairs & maintenance costs, tyre costs etc. have been studied over the base year of study, and presented for the geography studied (country or region as per the scope of report).
- Warehousing and Storage - Warehousing and storage segment captures revenue earned through the operation of general merchandise, refrigerated and other types of warehousing & storage facilities. These establishments take responsibility for storing the goods and keeping them secure in lieu of charges. Value added services (VAS) they may provide are considered to be a part of the "other services" segment. Here VAS refer to a range of services, related to the distribution of a customer's goods and can include labelling, breaking bulk, inventory control & management, light assembly, order entry & fulfillment, packaging, pick & pack, price marking & ticketing and transportation arrangement.
- Wholesale and Retail Trade - This end user industry segment captures the external (outsourced) logistics expenditure incurred by the wholesalers and retailers. The end user players considered are the establishments primarily engaged in wholesaling or retailing merchandise, generally without transformation, and rendering services incidental to the sale of merchandise. Logistics Service Providers (LSPs) plays a crucial role in the reliable movement of supplies to and finished products from production houses to the distributors and finally to the end customer covering activites like material sourcing, transportation, order fulfillment, warehousing & storage, demand forecasting, inventory management etc.
| Keyword | Definition |
|---|---|
| Axle Load | The axle load of a wheeled vehicle is the total weight bearing on the roadway for all wheels connected to a given axle. |
| Back Haul | Backhaul is the return movement of a transport vehicle from its original destination to its original point of departure. |
| Bill of Lading | A bill of lading is a legal document issued by a carrier to a shipper that details the type, quantity, and destination of the goods being carried. |
| Bunkering | Bunkering is the process of supplying fuel and/or gasoil to be used to power the propulsion system of a ship (such fuel is referred to as bunker). It includes the logistics of loading and distributing the fuel among available shipboard tanks. A person dealing in trade of bunker (fuel) is called a bunker trader. |
| Bunkering Service | Bunkering service is the supply of a requested quality and quantity of bunkers to a ship. |
| C-commerce | C-commerce (Collaborative commerce) describes electronically enabled business interactions among an enterprise’s internal personnel, business partners and customers throughout a trading community. The trading community could be an industry, industry segment, supply chain or supply chain segment. |
| Cabotage | Transport by a vehicle registered in a country performed on the national territory of another country. |
| Cartage Agent | A ground transportation service that provides pickup and delivery of freight in locations not served directly by an air or ocean carrier. |
| Contract logistics | Contract logistics refers to the outsourcing of resource management tasks by one company to a third-party company specializing in logistical matters, such as transportation, warehousing, and order fulfillment. |
| Courier | A business that is used to send messages, packages, etc. Courier service refers to the fast or quick, door to door pickup and delivery service for goods or documents. It can be local or international. A company that provides such delivery services is called a courier company. A courier company hires people to provide their services. Such a person hired by the courier service company is called a courier. |
| Cross docking | Cross docking is a practice in logistics management that includes unloading incoming delivery vehicles and loading the materials directly into outbound delivery vehicles, omitting traditional warehouse logistical practices and saving time and money. |
| Cross Trade | International transport between two different countries performed by a vehicle registered in a third country. A third country is a country other than the country of loading/embarkation and than the country of unloading/disembarkation. |
| Customs Clearance | The procedures involved in getting cargo released by Customs through designated formalities such as presenting import license/permit, payment of import duties and other required documentations by the nature of the cargo such as FCC or FDA approval. |
| Customs seal | Customs seal means a seal, stamp or any other preventive means affixed by customs officials to ensure the inviolability of goods, commercial means of transport or warehouses. |
| Dangerous Goods | Dangerous goods (or hazardous materials or HAZMAT) include flammable liquids/solids, gases, compressed, liquified, dissolved under pressure, corrosives, oxidising substances, explosive substances and articles, substances, which on contact with water, emit flammable gasses, organic peroxides, toxic substances, infectious substances, radioactive materials, miscellaneous dangerous goods and articles. |
| Direct Shipment | Direct shipment is a method of delivering goods from the supplier or the product owner to the customer directly. In most cases, the customer orders the goods from the product owner. This delivery scheme reduces transportation and storage costs, but requires additional planning and administration. |
| Drayage | A drayage is a form of trucking service that connects the different modes of shipping (intermodal), such as ocean freight or air freight. It’s a short-haul trip that transports goods from one place to another, usually before or after its long-haul shipping process. Drayage trucks move cargo to and from various destinations, such as container ships, storage lots, order fulfillment warehouses, and rail yards. Typically, drayage only transports goods in short distances and operates only in one metropolitan area. It also requires only one trucker in a single shift. |
| Dry Docking | Dry docking is a term used for repairs or when a ship is taken to the service yard. During dry docking, the whole ship is brought to a dry land so that the submerged portions of the hull can be cleaned or inspected. |
| Dry van | A dry van is a type of semi-trailer that's fully enclosed to protect shipments from outside elements. Designed to carry palletized, boxed or loose freight, dry vans aren't temperature-controlled (unlike refrigerated “reefer” units) and can't carry oversized shipments (unlike flatbed trailers). |
| Feedering | Transport service whereby loaded or empty containers in a regional are transferred to a “mother ship” for a long-haul ocean voyage. |
| Final Demand | Final demand includes all types of commodities (goods as well as services) consumed as final use and might include personal consumption, or consumption by government, by businesses as capital investment, and as exports. includes all types of commodities (goods as well as services) consumed as final use and might include personal consumption, or consumption by government, by businesses as capital investment, and as exports. |
| First mile Delivery | First mile delivery refers to the first stage of the transportation. This is when the parcel leaves the seller’s warehouse and is taken by the courier pick up agent to process it or take it to the warehouse. Once the package reaches the post office or the courier’s hub, it is then sorted and transported further until it reaches the customer’s doorstep. |
| Fiscal storage services | It means a facility, clearly separated from other premises, where the excise goods are produced, processed, held, received or dispatched under a duty suspension arrangement by an authorized depositor, in the course of his business, under conditions laid down by the customs authorities. |
| Flat Bed | It has a back body that is flatly shaped for easy loading and unloading of goods. The flatbed truck is mostly used to transport heavy, oversized, wide and indelicate goods. |
| Flatbed Truck | A flatbed truck is a type of truck with rigid design. It has a back body that is flatly shaped for easy loading and unloading of goods. The flatbed truck is mostly used to transport heavy, oversized, wide and indelicate goods such as machinery, building supplies or equipment. Due to the truck open body, the goods transported with it must not be vulnerable to rain. By functionality, the flatbed truck is comparable to a flatbed trailer. |
| Freight Transit Time | Transit time is how long it takes for a shipment to be delivered to its final destination after being picked up from a designated pick up point. |
| Halal Logistics | It refers to the process of managing the logistics operations such as fleet management, storage/warehousing, and materials handling according to the principles of Shariah law in ensuring the integrity of the halal products at the point of consumption. |
| Haulage | The commercial transport of goods. |
| Inbound Logistics | Inbound logistics is the way materials and other goods are brought into a company. This process includes the steps to order, receive, store, transport and manage incoming supplies. Inbound logistics focuses on the supply part of the supply-demand equation. |
| Intermediate Demand | Intermediate demand includes goods, services, and maintenance and repair construction sold to businesses, excluding capital investment. |
| International Loaded | Place of loading of goods in reporting country (i.e., country in which the vehicle performing the transport is registered) and place of unloading in a different country. |
| International Unloaded | Place of unloading of goods in reporting country (i.e., country in which the vehicle performing the transport is registered) and place of loading in a different country. |
| Last Mile Delivery | Last mile delivery refers to the very last step of the delivery process when a parcel is moved from a transportation hub to its final destination—which, usually, is a personal residence or retail store. |
| Less than-Truck-Load (LTL) | Less-than-truckload, also known as less-than-load (LTL), is a shipping service for relatively small loads or quantities of freight. An LTL provider combines the loads and shipping requirements of several different companies on their trucks, using a hub-and-spoke system to get goods to their destinations. |
| Locomotives Haluage | The transport of coal, ore, workers, and materials underground by means of locomotive-hauled mine cars. The locomotive may be powered by battery, diesel, compressed air, trolley, or some combination such as battery-trolley or trolley-cable reel. |
| Milkrun | A Milk Run is a delivery method used to transport mixed loads from various suppliers to one customer. Instead of each supplier sending a truck every week to meet the needs of one customer, one truck (or vehicle) visits the suppliers to pick up the loads for that customer. This method of transport got its name from the dairy industry practice, where one tanker used to collect milk from several dairy farms for delivery to a milk processing company. |
| Multi country consolidation | Multi-Country Consolidation (MCC) is a cost-effective solution that consolidates ones cargo from different countries of origin to build Full Container Loads (FCL). MCC is most suitable for companies that import light volumes of goods from multiple countries but want to take advantage of the more economic FCL freight rates. |
| Multi-Modal Logistics | Multimodal transportation or multimodal shipping refers to logistics and freight processes that require multiple modes of transportation. |
| Omni Channel Logistics | Omnichannel distribution is a multichannel approach taken by companies to give customers a way to purchase and receive orders from several sales channels with one-touch seamless integration. Some of the ways include- 1. Buy online, then pick-up at the brick and mortar store; 2. Buy online, then have it delivered to the home or another location; 3.In store purchase, with the delivery either to the home or another location; 4. Drop ship from a warehouse or manufacturing center to store, home or other location; 5.Buy online, then return at store or online; 6. Buy online, then return online. |
| OOG cargo | Out of Gauge (OOG) cargo is any cargo that can not be loaded into six-sided shipping containers simply because it is too large. The term is a very loose classification of all cargo with dimensions beyond the maximum 40HC container dimensions. That is a length beyond 12.05 meters – a width beyond 2.33 meters – or a height beyond 2.59 meters. |
| Other ships | Other ships include: Liquefied petroleum gas carriers, liquefied natural gas carriers, parcel (chemical) tankers, specialized tankers, reefers, offshore supply vessels, tugboats, dredgers, cruise, ferries, other non-cargo ships |
| Other Specialised Cargo | Other specialised goods include pre-slung goods (Goods, one or more items, supplied with a sling or slings), mobile units (Mobile Self Propelled Units, Non Self Propelled Units, unrolled vehicles), oversized equipment load (light and heavy machinery that is often too big or too heavy), high value freight that needs extra protection like electronics, financial services road freight. |
| Outsourced Freight Transport | Transport for hire or reward; The carriage for remuneration of goods. |
| Pallets | Raised platform, intended to facilitate the lifting and stacking of goods. |
| Part load | A part load describes goods which only fills a truck partially. In essence, the quantity of the shipment is bigger than the Less Than Truckload (LTL) shipment. Also, the shipment cannot fully occupy a truck i.e. its capacity is much lower than a Full Truckload (FTL) shipment. |
| Paved Road | Road surfaced with crushed stone (macadam) with hydrocarbon binder or bituminized agents, with concrete or with cobblestone. |
| Q-commerce | Q-commerce, also referred to as quick commerce, is a type of e-commerce where emphasis is on quick deliveries, typically in less than an hour. |
| Quay | A stone or metal platform lying alongside or projecting into water for loading and unloading ships. |
| Recommerce | Recommerce is the selling of previously owned items through online marketplaces to buyers who reuse, recycle or resell them. |
| ReverseLogistics | Reverse logistics is a type of supply chain management that moves goods from customers back to the sellers or manufacturers. |
| Road Freight Transport Service | Hiring a trucking agency for transport of commodities (raw materials or manufactured goods including both solids and liquids) form the origin to a destination within the country (domestic) or cross-border (international) constitutes road freight transport market. The service might be Full-Truck-Load or Less than-Truck-Load, containerized or non-containerized, temperature controlled or non temperature controlled, short haul or long haul. |
| Roll-on/roll-off cargo | Roll-on/roll-off (RORO or ro-ro) ships are cargo ships designed to carry wheeled cargo, such as cars, motorcycles, trucks, semi-trailer trucks, buses, trailers, and railroad cars, that are driven on and off the ship on their own wheels or using a platform vehicle, such as a self-propelled modular transporter. |
| Swap bodies | A swap body, swop body, exchangeable container or interchangeable unit, is one of the types of standard freight containers for road and rail transport. |
| Tank Barge | A non-self-propelled vessel constructed or adapted primarily to carry liquid, solid or gaseous commodities or cargos in bulk in cargo spaces (or tanks) through rivers and inland waterways, and may occasionally carry commodities or cargos through oceans and seas when in transit from one inland waterway to another. The commodities or cargos transported are in direct contact with the tank interior. |
| Tautliner vehicle | Tautliner and curtainsider are used as generic names for curtain sided trucks/trailers. The curtains are permanently fixed to a runner at the top and detachable rails/poles at front and rear, allowing the curtains to be drawn open and forklifts used all along the sides for easy and efficient loading and unloading. When closed for travel, vertical load restraint straps are attached to a rope rail beneath the truck bed, connecting the truck bed and curtain along both sides. Winches at either end of the curtain tension it, hence the 'Tautliner' name. This stops the curtain from flapping or drumming in the wind and can also help retain light loads from slipping sideways. |
| Transloading | Transloading is a shipping term that refers to the transfer of goods from one mode of transportation to another en route to their ultimate destination. |
| Tsubo | A Japanese unit of area equal to 35.58 square feet. |
| Unpaved Road | Road with a stabilized base not surfaced with crushed stone, hydrocarbon binder or bituminized agents, concrete or cobblestone. |
| Vessel Husbandry Services | It includes ship maintenance, repairs, cleaning, upkeep of the hull and rigging and equipment. |


Research Methodology
Mordor Intelligence follows a four-step methodology in all our reports.
- Step-1: Identify Key Variables: In order to build a robust forecasting methodology, the variables and factors identified in Step-1 are tested against available historical market numbers. Through an iterative process, the variables required for market forecast are set and the model is built on the basis of these variables.
- Step-2: Build a Market Model: Market-size estimations for the forecast years are in nominal terms. Inflation is not a part of the pricing, and the average selling price (ASP) is kept constant throughout the forecast period for each country.
- Step-3: Validate and Finalize: In this important step, all market numbers, variables and analyst calls are validated through an extensive network of primary research experts from the market studied. The respondents are selected across levels and functions to generate a holistic picture of the market studied.
- Step-4: Research Outputs: Syndicated Reports, Custom Consulting Assignments, Databases & Subscription Platforms


