Market Overview
| Study Period | 2021 - 2031 |
|---|---|
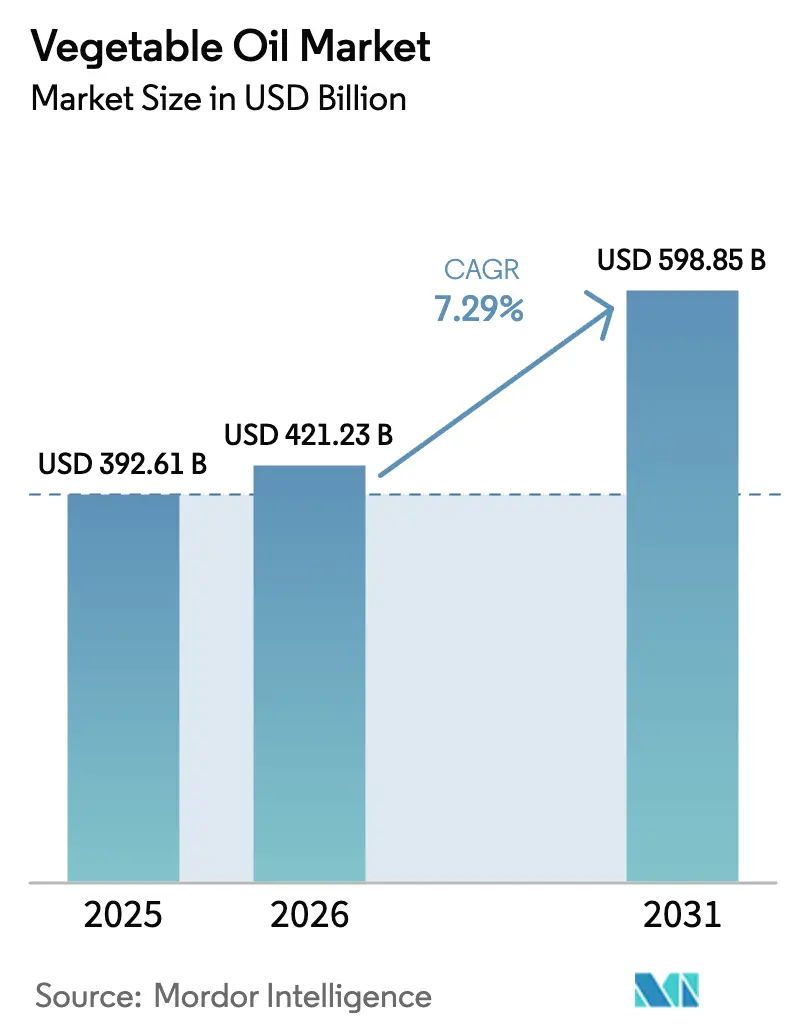
| Market Size (2026) | USD 421.23 Billion |
| Market Size (2031) | USD 598.85 Billion |
| Growth Rate (2026 - 2031) | 7.29% CAGR |
| Fastest Growing Market | Asia Pacific |
| Largest Market | Asia Pacific |
| Market Concentration | Medium |
Major Players
*Disclaimer: Major Players sorted in no particular order Image © Mordor Intelligence. Reuse requires attribution under CC BY 4.0. |
|
Vegetable Oil Market Analysis by Mordor Intelligence
The Vegetable Oil Market was valued at USD 392.61 billion in 2025, is expected to reach USD 421.23 billion in 2026, and USD 598.85 billion by 2031, registering a CAGR of 7.29% during the period from 2026 to 2031. This growth is primarily driven by the increasing adoption of plant-based diets, where vegetable oils play a crucial role as essential fat sources for home cooking and processed foods. Additionally, urbanization and changing lifestyles are boosting the demand for convenience foods. Simultaneously, growing awareness of sustainability, traceability, and responsible sourcing is transforming production and procurement practices, leading to investments in certified, traceable, and deforestation-free supply chains. Furthermore, advancements in processing technologies are enhancing oil quality, stability, and functional performance, enabling manufacturers to meet stricter health and environmental standards without compromising operational efficiency.
Key Report Takeaways
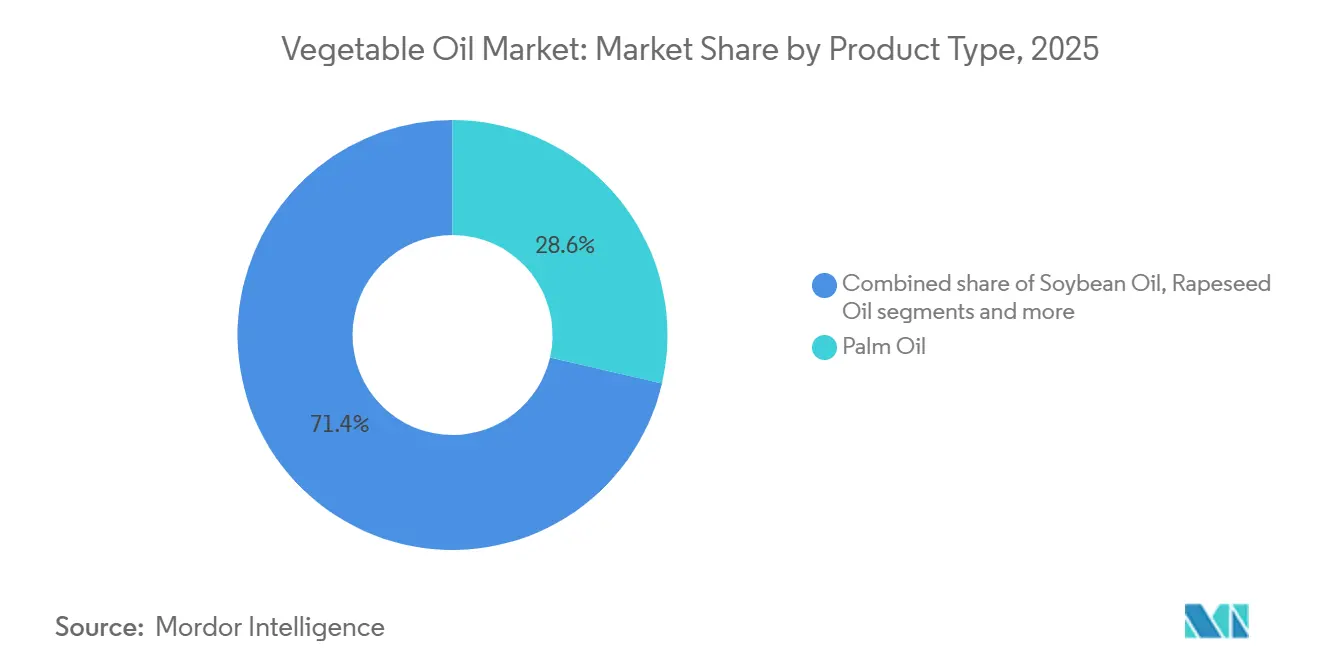
- By type, palm oil led with 28.63% of the vegetable oil market share in 2025, while sunflower oil is projected to expand at a 7.31% CAGR to 2031.
- By nature, conventional products captured 93.56% of 2025 sales; the organic segment is forecast to advance at a 9.12% CAGR through 2031.
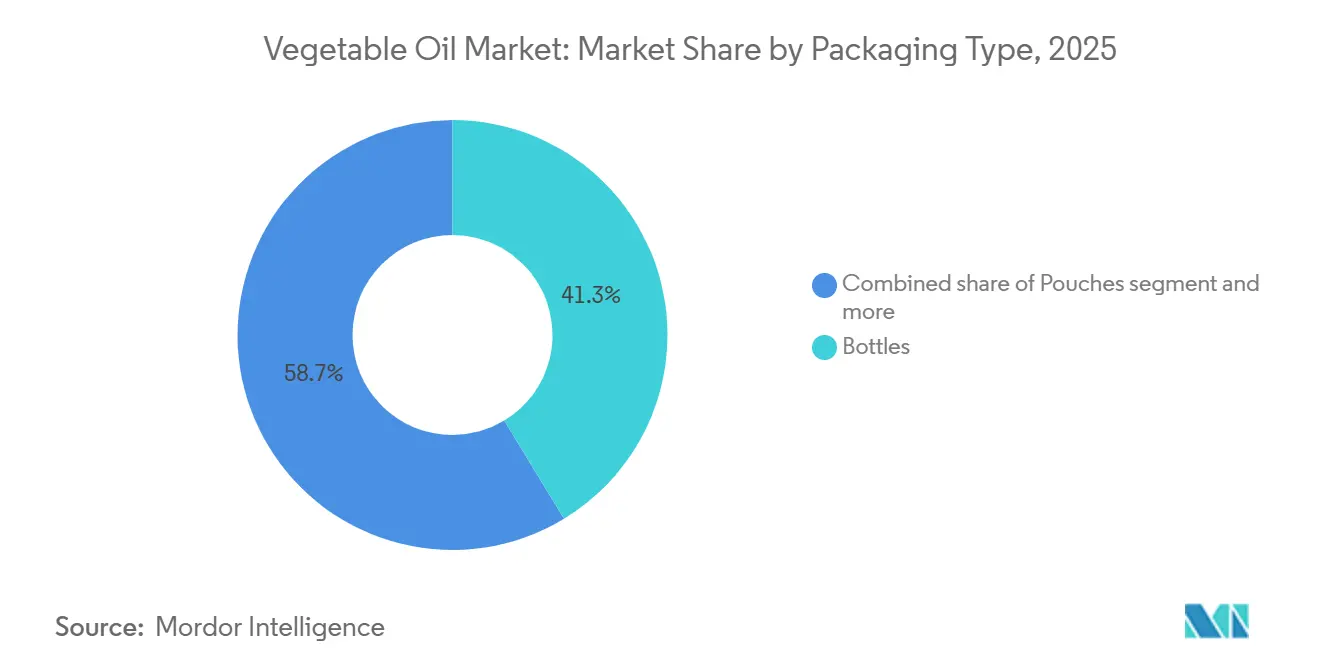
- By packaging type, bottles accounted for 41.32% of revenue in 2025, while pouches are expected to grow at a CAGR of 7.34%, driven by e-commerce and single-serve demand.
- By distribution channel, retail accounted for 61.67% of 2025 turnover, but HoReCa is expected to post an 8.36% CAGR as restaurant activity normalizes.
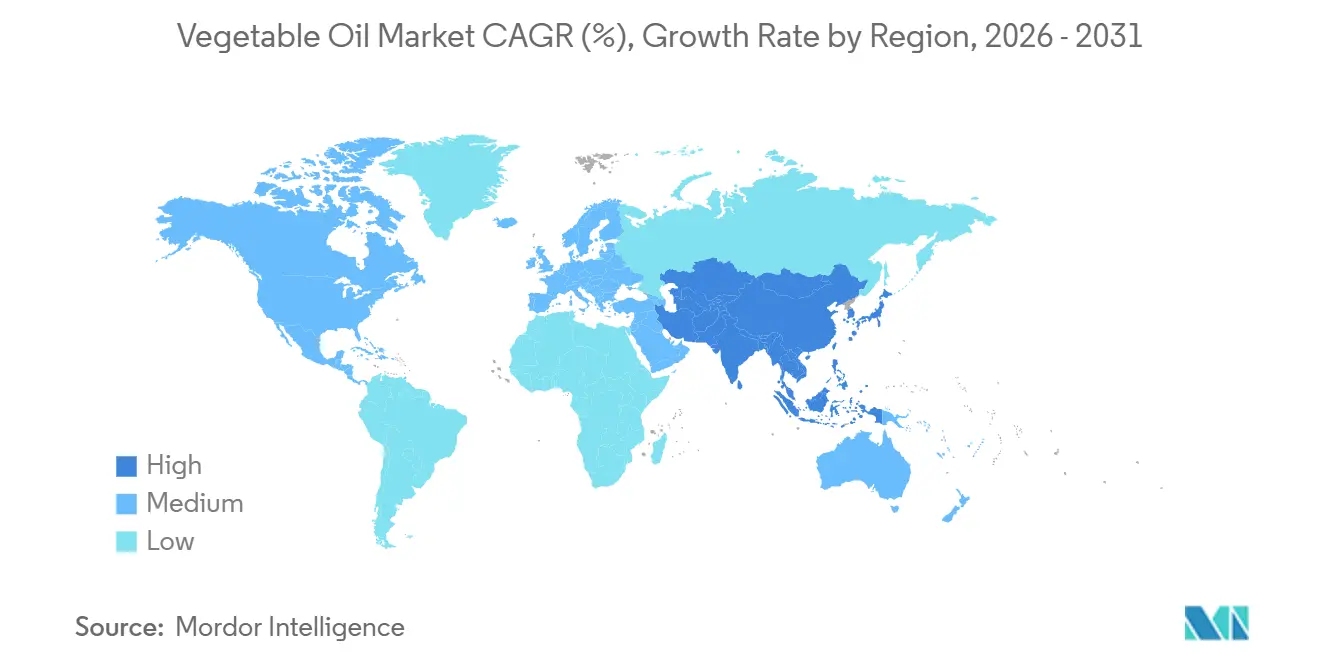
- By geography, Asia-Pacific commanded 48.76% of the 2025 value and will keep its lead with an 8.98% CAGR through 2031.
Note: Market size and forecast figures in this report are generated using Mordor Intelligence’s proprietary estimation framework, updated with the latest available data and insights as of January 2026.
Global Vegetable Oil Market Trends and Insights
Drivers Impact Analysis*
| Driver | (~) % Impact on CAGR Forecast | Geographic Relevance | Impact Timeline |
|---|---|---|---|
| Health awareness drives preference for olive and sunflower oils. | +1.2% | Global, with strongest adoption in North America, Europe, and urban Asia-Pacific | Medium term (2-4 years) |
| Rising shift toward plant-based diets | +1.0% | Global, led by urban centers in Asia-Pacific, North America, and Western Europe | Medium term (2-4 years) |
| Urbanization drives higher edible oil demand | +1.5% | Asia-Pacific core (India, China, Indonesia, Vietnam), spill-over to Sub-Saharan Africa and Latin America | Long term (≥ 4 years) |
| Rising awareness of sustainability and traceability | +0.7% | Europe and North America lead; Asia-Pacific following via export-market compliance | Medium term (2-4 years) |
| Innovation in oil processing and refining technologies | +0.8% | Global, with early adoption in North America, Europe, and advanced Asia-Pacific facilities | Short term (≤ 2 years) |
| Growth in food processing and fast-food industries drives oil consumption | +1.3% | Global, with rapid expansion in Asia-Pacific and Middle East | Medium term (2-4 years) |
| Source: Mordor Intelligence | |||


Health-driven replacement of animal fats
Rising health awareness remains a key factor driving the global vegetable oil market, significantly influencing consumer preferences for olive and sunflower oils over traditional fats and highly saturated oils. Increasing awareness of the connection between dietary fats, cardiovascular health, cholesterol management, and overall wellness has accelerated the shift toward oils recognized for their heart-health benefits and superior nutritional profiles. Olive oil, particularly extra virgin varieties, is highly regarded for its strong association with the Mediterranean diet, its abundant monounsaturated fat content, and natural antioxidants that support overall health and longevity. Similarly, sunflower oil is extensively favored for its low saturated fat levels, high vitamin E content, and mild flavor, making it a versatile and practical choice for everyday cooking. This health-driven transformation is not only reshaping household consumption patterns but also compelling food manufacturers to reformulate products, aligning with increasing consumer demands for healthier alternatives, clean-label transparency, and reduced saturated fat content.
Rising shift toward plant-based diets
The growing shift toward plant-based diets is a significant driver of the global vegetable oil market, as consumers increasingly replace animal-derived fats with plant-based alternatives in cooking and processed foods. The rising adoption of vegetarian, vegan, and flexitarian eating habits has positioned vegetable oils as key dietary fat sources, essential for preparing plant-based meals, meat substitutes, dairy alternatives, and ready-to-eat products. Plant-based diets emphasize cholesterol-free, sustainable, and ethically sourced ingredients, aligning vegetable oils with consumer preferences for health, environmental sustainability, and clean-label formulations. This dietary trend is becoming mainstream, supporting sustained demand growth. For example, according to the Good Food Institute, 59% of United States households purchased plant-based foods in 2024, illustrating the rapid normalization of plant-based consumption. This expanding consumer base is driving increased use of vegetable oils in plant-based meat alternatives, dairy-free spreads, vegan bakery products, and ready meals, where oils serve as essential functional components.
Urbanization drives higher edible oil demand
Urbanization is a key factor driving the increased demand for edible oils in the global vegetable oil market. The migration of populations to urban areas significantly influences dietary habits, cooking practices, and food consumption patterns. Urban lifestyles are often associated with a higher reliance on processed foods, ready-to-cook meals, quick-service restaurants, and food delivery platforms, all of which extensively use vegetable oils for frying, baking, and large-scale food preparation. With urban households facing time constraints and limited living spaces, there is a shift from traditional low-oil cooking methods to convenience-oriented and commercially prepared foods, leading to higher per-capita vegetable oil consumption. For example, according to the World Bank, 57.7% of the global population resided in urban areas in 2024, compared to 57.34% in 2023, reflecting the steady trend of urban migration.[1]Source: World Bank, "Share of the world's population living in urban or rural areas", worldbank.org This expanding urban population drives consistent demand for vegetable oils not only in households but also in institutional catering, workplace cafeterias, street food markets, and cloud kitchens, which are prevalent in densely populated cities. Furthermore, urban consumers often embrace diverse cuisines and international food formats, many of which require significant amounts of oil, further boosting consumption levels.
Rising awareness of sustainability and traceability
Rising awareness of sustainability and traceability is a significant driving factor for the global vegetable oil market. Consumers, regulators, and multinational buyers are increasingly demanding transparency regarding origin, environmental impact, deforestation risks, and ethical farming practices. This demand is encouraging vegetable oil producers to implement traceable and certified supply chains. The shift is particularly impactful for oils under high sustainability scrutiny, such as palm oil, where traceability and certification have become essential for maintaining market access in developed regions and among global brands. The growing adoption of sustainability standards is evident in industry participation levels. For example, in 2024, members of the Roundtable on Sustainable Palm Oil (RSPO) accounted for 39% of global palm oil production, with 20.1% certified as Certified Sustainable Palm Oil (CSPO) [2]Source: Roundtable on Sustainable Palm Oil (RSPO), "ACOP 2024: RSPO Market Trends Resilient Despite Global Challenges", rspo.org. This expanding certified supply is enhancing buyer confidence, facilitating compliance with stricter regulations such as deforestation-free sourcing mandates, and supporting long-term offtake agreements with multinational food and consumer goods companies.
Restraints Impact Analysis*
| Restraint | (~) % Impact on CAGR Forecast | Geographic Relevance | Impact Timeline |
|---|---|---|---|
| Volatility in raw material supply | -0.9% | Global, with acute exposure in South America (weather), Black Sea (geopolitics), Southeast Asia (policy shifts) | Short term (≤ 2 years) |
| Competition from alternative fats and oils | -0.5% | North America and Europe (biofuel feedstock substitution); Asia-Pacific (animal fat in traditional cooking) | Medium term (2-4 years) |
| Allergen and sensitivity issues | -0.3% | North America and Europe (labeling and liability); emerging in Asia-Pacific urban markets | Medium term (2-4 years) |
| Regulatory restrictions on certain oil types | -0.40% | Europe (palm oil import limits); North America (saturated-fat caps); China (Genetically Modified Organism (GMO) labeling) | Long term (≥ 4 years) |
| Source: Mordor Intelligence | |||
Volatility in raw material supply
Volatility in raw material supply serves as a significant restraint on the global vegetable oil market. Production is highly reliant on agricultural outputs, which are subject to climatic variability, extreme weather events, pest infestations, crop diseases, and seasonal yield fluctuations. Oilseed crops, in particular, are highly sensitive to factors such as rainfall patterns, temperature stress, and soil conditions, resulting in unpredictable supply levels across different growing regions. This unpredictability disrupts production planning for processors and refiners, causing inconsistent input availability, fluctuating utilization rates, and difficulties in maintaining stable supply contracts with food manufacturers and foodservice operators. Additionally, the uncertainty in raw material supply impacts pricing stability, leading to increased costs for manufacturers and consumers. For markets heavily dependent on imports, supply uncertainty is further exacerbated by crop failures, production shortfalls, export restrictions, and geopolitical tensions in major producing countries, further complicating the global supply chain.
Competition from alternative fats and oils
Competition from alternative fats and oils poses a significant challenge to the global vegetable oil market. Evolving dietary preferences and advancements in technology have significantly expanded the availability and diversity of substitute fat sources for both consumers and manufacturers. Animal-based fats, such as butter, ghee, and tallow, continue to hold strong appeal in traditional cuisines and premium food segments due to their unique flavors, textures, and cultural significance. Simultaneously, emerging alternatives, including algae oils, microbial oils, fermented fats, and structured lipids, are rapidly gaining prominence for their customized nutritional profiles, sustainability benefits, and functional properties, making them attractive options for health-conscious and environmentally aware consumers. Additionally, the increasing adoption of plant-based and hybrid formulations has driven substantial innovation in fat systems, incorporating emulsions, oleogels, or novel ingredients. These advancements are enabling manufacturers to reduce reliance on conventional vegetable oils while addressing evolving consumer demands, regulatory pressures, and application-specific requirements across diverse industries.
*Our forecasts treat driver/restraint impacts as directional, not additive. The impact forecasts reflect baseline growth, mix effects, and variable interactions.
Segment Analysis
By Type: Tropical Oils Dominate, Temperate Oils Gain Share
In 2025, palm oil accounted for 28.63% of the vegetable oil market, maintaining its leading position due to its functional versatility, supply efficiency, and wide range of applications. Its high yield per hectare establishes it as the most efficient oilseed crop, ensuring consistent large-scale availability. Palm oil's semi-solid nature at room temperature, natural oxidative stability, and high smoke point make it particularly suitable for frying, bakery shortenings, confectionery coatings, and margarine formulations. These properties reduce the need for hydrogenation, aligning with the requirements for reducing trans fats. In the food industry, palm oil's neutral taste, extended shelf life, and cost-effective functionality enable manufacturers to maintain product consistency across various geographies and climates, further driving its adoption in packaged and processed foods.
Sunflower oil is projected to grow at the fastest CAGR of 7.31% through 2031, emerging as a significant growth driver in the global vegetable oil market. This growth is primarily attributed to its strong health positioning, versatility across applications, and increasing global acceptance. Sunflower oil is widely regarded as heart-friendly due to its low saturated fat content and high levels of vitamin E and polyunsaturated fats, making it a preferred choice for everyday cooking, food manufacturing, and health-focused formulations. Its nutritional profile aligns with the rising consumer demand for lighter, cleaner-label, and cholesterol-conscious edible oils, supporting its growing adoption in both household and commercial foodservice sectors. The segment's robust growth is further reinforced by increasing global consumption volumes. According to the US Department of Agriculture, global sunflower seed oil consumption reached 20.27 million metric tons in the 2024/25 crop year, underscoring its growing significance in the global vegetable oil market.


By Nature: Organic Segment Accelerates from Low Base
Conventional oils accounted for 93.56% of the vegetable oil market in 2025 and continue to dominate the market due to their widespread availability, scalability, and integration across food and non-food industries. These oils benefit from established large-scale farming systems, mature processing infrastructure, and efficient refining technologies, ensuring a consistent supply and uniform quality at the volumes required by mass-market food manufacturers and foodservice operators. Their extensive use in processed foods, frying applications, and institutional cooking reinforces their dominance, as these applications prioritize performance characteristics such as heat stability, shelf-life extension, and formulation consistency, areas where conventional oils are highly optimized. Additionally, the cost-effectiveness of conventional oils compared to alternatives further strengthens their position, making them a preferred choice for large-scale operations and budget-conscious manufacturers.
Organic vegetable oils, projected to grow at a robust CAGR of 9.12% through 2031, are emerging as the fastest-growing segment in the global vegetable oil market. This growth is driven by increasing consumer preference for clean-label, chemical-free, and sustainably produced edible oils. Organic oils are gaining popularity due to concerns about pesticide residues, synthetic fertilizers, and intensive refining practices associated with conventional oils. This trend is particularly pronounced among health-conscious consumers, premium food manufacturers, and specialty foodservice operators seeking traceable, minimally processed, and non-GMO oil solutions. For example, according to the Agricultural and Processed Food Products Export Development Authority, India produced approximately 3.6 million metric tons of certified organic products in 2024, spanning various food categories, including oilseeds used for organic vegetable oil production [3]Source: Agricultural and Processed Food Products Export Development Authority, "Organic Products", apeda.gov.in. The growing availability of certified organic raw materials is enhancing supply consistency and encouraging greater participation from oil processors and exporters.
By Packaging: Pouches Gain Ground in E-Commerce and Foodservice
Bottles accounted for a 41.32% share of the vegetable oil market in 2025, remaining the primary packaging type. They continue to dominate the market due to their practicality, consumer familiarity, and suitability for retail and foodservice applications. Their transparent or semi-transparent nature allows consumers to visually assess the oil's quality and color, fostering trust at the point of purchase. Furthermore, bottles offer durability and ease of handling, making them convenient for both consumers and retailers. Additionally, bottles are well-suited for branding, labeling, and displaying regulatory information, enabling manufacturers to effectively communicate nutritional claims, origin, and certifications. This supports product differentiation in an increasingly competitive retail landscape.
Pouches, anticipated to grow at a CAGR of 7.34% through 2031, are becoming a prominent packaging format in the global vegetable oil market due to their cost efficiency, convenience, and compatibility with changing consumption and distribution patterns. Compared to rigid packaging formats, pouches require less material and have a lower packaging weight, allowing manufacturers to streamline logistics, reduce storage requirements, and enhance transportation efficiency. These advantages make pouches particularly suitable for high-volume edible oils such as palm, soybean, and sunflower oil, especially in price-sensitive and mass-consumption markets. For consumers, pouches offer ease of handling, space-saving benefits, and affordability, encouraging repeat purchases and broader adoption in both urban and semi-urban households.
By Distribution Channel: HoReCa Outpaces Retail as Foodservice Formalizes
Retail outlets accounted for a 61.67% revenue share in the vegetable oil market in 2025 and continue to dominate market volumes due to their extensive reach, purchasing convenience, and alignment with household consumption patterns. Supermarkets, hypermarkets, convenience stores, and neighborhood grocery outlets remain the primary access points for edible oils, facilitating frequent small-to-medium volume purchases suited to everyday cooking needs. Strong in-store visibility, promotional activities, and private-label offerings further strengthen the retail segment's leadership by influencing brand preferences and encouraging repeat purchases. Moreover, the expansion of modern trade formats and the integration of online-to-offline retail models have improved accessibility, convenience, and last-mile delivery efficiency.
The HoReCa and foodservice sectors are anticipated to grow at a robust CAGR of 8.36% through 2031, emerging as one of the fastest-growing demand channels in the global vegetable oil market. This growth is driven by evolving eating habits, menu diversification, and the rapid expansion of out-of-home dining formats. Restaurants, hotels, cloud kitchens, catering services, and institutional food providers heavily depend on vegetable oils for applications such as deep frying, sautéing, baking, and bulk meal preparation, making these oils a high-consumption, repeat-purchase commodity. The increasing prevalence of quick-service restaurants (QSRs), casual dining chains, delivery-only kitchens, and the commercialization of street food is significantly boosting the demand for stable, high-smoke-point oils. Furthermore, standardized cooking processes and centralized procurement systems in foodservice operations prioritize oils that offer consistent performance, extended frying life, and cost efficiency, thereby supporting sustained consumption growth.
Geography Analysis
Asia-Pacific accounted for 48.76% of the vegetable oil market share in 2025 and is projected to grow at a CAGR of 8.98% through 2031, making it the largest and fastest-growing regional market. This growth is driven by strong household consumption, extensive food processing activities, and increasing foodservice demand in emerging economies. India’s efforts toward oilseed self-sufficiency, focusing on boosting domestic production, improving yields, and reducing import dependence, are contributing to this trend. Indonesia plays a dual role as the largest global producer of palm oil and a significant domestic consumer. According to Statistics Indonesia, the country’s oil palm production was estimated at 47.47 million metric tons in 2024, highlighting its importance in global supply dynamics. In contrast, mature markets such as Japan, South Korea, and Australia exhibit stable per-capita consumption, with demand influenced by product quality, health-focused positioning, and specialty oils rather than volume growth.
Europe remains a key consumption hub, with Germany, France, Spain, and Italy as the largest markets, supported by strong culinary traditions and a robust packaged food industry. However, the region’s vegetable oil market is increasingly influenced by sustainability and regulatory factors, particularly the European Union’s Deforestation Regulation. This regulation is shaping sourcing strategies, traceability requirements, and supplier selection, driving a shift toward certified, deforestation-free, and sustainably sourced oils. These changes are impacting palm oil imports while boosting demand for alternative oils such as sunflower, rapeseed, and olive oil.
North America, led by the United States, Canada, and Mexico, demonstrates steady demand for vegetable oils, driven by processed foods, foodservice recovery, and industrial applications. There is also a growing focus on high-oleic and functionally stable oils. South America, particularly Brazil and Argentina, serves as both a major producer and consumer, with soybean oil anchoring regional supply and export flows. Meanwhile, the Middle East and Africa are experiencing rising vegetable oil consumption due to urbanization, expanding foodservice infrastructure, and increased reliance on imported edible oils to meet growing demand.

Regulatory Landscape
Global vegetable oil trade and product specifications remain anchored to Codex Alimentarius standards for named vegetable oils (CXS 210-1999), which are actively maintained through the Codex Committee on Fats and Oils (CCFO). In February 2026, CCFO held its 29th session in Kuala Lumpur, advancing work on updates to compositional and identity provisions (including discussions covering high-oleic sunflower oil specifications and the scope of named oils), reinforcing Codex as a reference point for cross-border procurement, labeling, and conformity assessments.
National authorities are tightening controls on logistics hygiene, contaminants, and traceability. China implemented a mandatory national standard (GB 44917-2024) in February 2025 covering sanitary requirements for bulk transportation of edible vegetable oils, adding compliance obligations for importers, terminals, and bulk carriers beyond refinery gate controls, alongside established food safety requirements for vegetable oils (e.g., GB 2716-2018). In India, the government announced the Vegetable Oil Products, Production and Availability (VOPPA) Regulation Order 2025 to replace the 2011 order, signaling stronger digital monitoring of production, sales, and stocks as part of domestic availability and price-management measures for edible oils.
Value Chain Analysis
The vegetable oil value chain runs from upstream cultivation of oilseeds and oil-bearing crops (palm, soybean, sunflower, rapeseed, and others), through aggregation, crushing and solvent extraction, and refining (including degumming, bleaching, deodorization, and fractionation for specific functionality). It then moves into bulk logistics and downstream packaging into consumer and foodservice formats, including bottles, pouches, jars, and cans.
International trading and execution commonly reference standardized contracting and dispute-resolution frameworks such as FOSFA contracts, while large-scale crushing networks (for example, the National Oilseed Processors Association member base in the United States) underpin supply for both food and industrial demand. Midstream and downstream performance is increasingly tied to compliance-driven traceability and shifting logistics economics. The European Union Deforestation Regulation (Regulation (EU) 2023/1115) requires origin verification and due diligence for commodities including oil palm and soya, which encourages digital traceability systems and supplier requalification across traders, refiners, and brand owners. At the same time, supply chain bottlenecks have been amplified by disruptions to key corridors, including constrained Black Sea export flows for sunflower oil and shipping reroutes that extend transit times and raise freight and insurance costs, while domestic biofuel programs (e.g., Indonesia B40) draw volumes into local industrial demand and reduce exportable supply in global channels.
Competitive Landscape
The vegetable oil market is moderately fragmented, with a mix of large multinational processors and numerous regional and local players. Key companies such as The Savola Group, Marico Limited, Louis Dreyfus Company B.V., Wilmar International Limited, and IFFCO Group maintain strong market positions through advantages in scale, integrated supply chains, diversified sourcing, and extensive refining and distribution capabilities. These companies compete on factors such as supply reliability, a broad product portfolio spanning palm, soybean, sunflower, and blended oils, and their ability to serve various end-use sectors, including food, foodservice, industrial, and oleochemical applications. Investments in sustainability certifications, traceability systems, and long-term grower relationships further strengthen their competitive positioning, particularly in markets with stringent regulatory and sourcing requirements.
In addition to established firms, smaller and emerging players are creating defensible niches by targeting specific consumer segments. Companies like Patanjali Ayurveda in India and organic-focused brands in Europe are capitalizing on the growing demand for natural, organic, and traditionally processed oils. These companies appeal to price-insensitive and values-driven consumers by aligning with health and sustainability trends. They often leverage regulatory ambiguities or evolving standards in labeling and certification to enhance market entry and brand visibility. Although their overall volumes are smaller compared to multinational leaders, their agility, strong domestic branding, and focus on premium and specialty categories enable them to gain incremental market share, particularly in retail channels.
The competitive landscape is evolving due to emerging opportunities and enabling technologies. Growth areas include specialty oils designed for plant-based meat alternatives, blockchain-enabled traceability platforms that reduce audit and compliance costs for sustainability certifications, and contract crushing services for smallholder cooperatives lacking capital for dedicated processing facilities. Additionally, the adoption of technologies such as enzymatic degumming, membrane-based fractionation, and real-time quality monitoring systems is lowering the minimum efficient scale of operations. These advancements enable regional processors and new entrants to compete on quality, consistency, and customization rather than volume, intensifying competition and gradually decentralizing market power within the global vegetable oil industry.
Vegetable Oil Industry Leaders
-
The Savola Group
-
Marico Limited
-
Louis Dreyfus Company B.V.
-
Wilmar International Limited
-
IFFCO Group
- *Disclaimer: Major Players sorted in no particular order

Market Opportunities and Future Outlook
Investments to expand crushing, refining, and packaging capacity are creating whitespace across both origin markets and importing regions that want more control over quality, cost, and compliance. In June 2026, Louis Dreyfus Company announced a USD 400 million investment in a new oilseeds processing plant in Bahia Blanca, Argentina (construction starting in late 2026, designed for 4,000 tonnes/day), and Cargill disclosed a EUR 56 million expansion in Belgium that includes a EUR 21 million upgrade to its Izegem vegetable oil bottling line. Together, these moves point to continued vertical integration and local value-add, improving the ability to serve differentiated requirements such as high-oleic profiles, retail and foodservice packaging formats, and auditable sourcing.
Policy-driven feedstock rules and sustainability compliance are also creating distinct opportunity lanes by application and geography. In April 2026, the European Commission adopted a delegated regulation that phases out soy-based biofuels in the EU by 2030 due to high ILUC risk, which raises the importance of alternative compliant oils and traceable supply chains for industrial demand. In parallel, the US released an updated 45ZCF-GREET model in June 2026, changing how feedstock emissions are treated in clean fuel credit calculations and sharpening the incentive to document lower-emission pathways for oils such as soybean and canola. For food uses, tighter logistics hygiene and contaminant-reduction requirements (including China bulk edible oil transport controls and refined-oil contaminant mitigation codes of practice under development) reinforce opportunities for processors that can show consistent refining performance, validated quality systems, and end-to-end traceability, particularly for palm oil where RSPO-linked certified supply has become a procurement qualifier for many multinational buyers.
Recent Industry Developments
- March 2026: Savola Group published its FY 2025 investor presentation, outlining 2026 priorities that include scaling its B2B foodservice platform, Savola professional, alongside continued focus on its edible oil and commodity platform. The push toward foodservice-oriented distribution broadens channel reach for edible oils and increases the importance of pack formats and service-led differentiation.
- June 2025: Louis Dreyfus Company inaugurated a new glycerin refining plant and an edible oil packaging line in Lampung, Indonesia. The added downstream capability strengthens regional supply of packaged oils and supports tighter quality control and responsiveness for food and foodservice buyers in Asia-Pacific.
- June 2025: Marico Limited launched the Saffola Cold Pressed Oils range (Single Seed and Dual Seed variants) during Q1 FY26, with an initial focus on e-commerce and quick-commerce channels. This expands premium and health-positioned edible oil options and signals how digital-first distribution is becoming a primary route for new oil formats and claims-led propositions.


Research Methodology Framework and Report Scope
Market Definition and Coverage
This market tracks the sales value of vegetable oils made from plant sources, from extraction through refining and trade, as they are supplied for food use, feed use, and approved industrial use in bulk or consumer packs.
Scope exclusions: Coconut oil and olive oil are excluded from this market sizing scope.
Segmentation Overview
-
By Type
- Palm Oil
- Soybean Oil
- Rapeseed Oil
- Sunflower Oil
- Peanut Oil
- Coconut Oil
- Olive Oil
- Other Types
-
By Nature
- Conventional
- Organic
-
By Packaging
- Bottle
- Pouches
- Jar
- Can
- Others
-
By Distribution Channel
- HoReCa/Foodservice
-
Retail
- Supermarkets/Hypermarkets
- Convenience Stores/Grocery Stores
- Online Retail Stores
- Other Distribution Channels
-
By Geography
-
North America
- United States
- Canada
- Mexico
- Rest of North America
-
Europe
- Germany
- United Kingdom
- Italy
- France
- Spain
- Netherlands
- Poland
- Belgium
- Sweden
- Rest of Europe
-
Asia-Pacific
- China
- India
- Japan
- Australia
- Indonesia
- South Korea
- Thailand
- Singapore
- Rest of Asia-Pacific
-
South America
- Brazil
- Argentina
- Colombia
- Chile
- Peru
- Rest of South America
-
Middle East and Africa
- South Africa
- Saudi Arabia
- United Arab Emirates
- Nigeria
- Egypt
- Morocco
- Turkey
- Rest of Middle East and Africa
-
North America
Data Sources, Market Sizing, and Validation
Desk Research
Desk research was used to set the demand and supply anchors that keep the model realistic, before we built the forecast logic. We relied on public agriculture and trade statistics such as FAOSTAT, USDA oilseeds and oils balances, UN Comtrade trade data, and selected national statistics portals that publish crush and consumption indicators.
On top of that, we used items such as company annual reports and investor presentations, customs and port updates reported in reputed press, and industry association pages that track oils, oilseeds, and downstream uses. Where gaps existed for financial context or long term corporate activity, we also referred to paid subscriptions focused on company financials and news intelligence, plus shipment-level trade databases when they were relevant for checking major flows. These desk research sources are illustrative, and many other public and paid references were also reviewed to collect data, validate assumptions, and clarify open points.
Primary Interviews and Surveys
Primary interviews and surveys were used to pressure-test the desk findings and then tighten assumptions that directly move the market size. We covered participants across the value chain, including oil processors, traders, food manufacturers, and channel-side stakeholders, and inputs were balanced across APAC, EMEA, and the Americas so the model reflects regional mix differences and pricing realities.
Distribution of primary research fieldwork respondents
| Company type | Respondent position | Region |
|---|---|---|
| Top tier: 26% | CXOs: 18% | APAC: 49% |
| Mid tier: 54% | Functional/Unit leaders: 25% | EMEA: 30% |
| Smaller Players: 20% | Managers: 57% | Americas: 21% |
Market-Sizing & Forecasting
Sizing starts with a top-down build where production, crush, and trade signals are used to reconstruct an oils availability pool, which is then aligned to consumption use across food, feed, and approved industrial demand. After that, selective bottom-up checks are run using sampled country price points, observed bulk and retail pack price spreads, and channel-level volume cues shared in interviews, and then totals are adjusted when the checks repeatedly point to the same direction.
Key inputs used in the model include oilseed crush volumes, refined versus crude mix, import dependency by region, average export and import unit values (as a pricing proxy), and the demand pull from biodiesel blending mandates and packaged food growth. When local data was incomplete, gaps were handled by using proxy countries with similar diet mix and trade patterns, and then the proxy was corrected using expert feedback on substitution between palm, soy, sunflower, and rapeseed oils.
For forecasting, we leaned on scenario analysis supported by a light multivariate regression layer, where consumption growth, trade intensity, and price cycles were tested together so the CAGR does not come only from one assumption. The final forecast path was agreed only after primary inputs confirmed the direction of substitution, likely policy steadiness, and the expected pace of refining capacity additions.
Data Validation & Update Cycle
Validation is done through triangulation across supply-side balances, trade-based signals, and demand indicators, and then the outcome is checked for variances that are too large to be explained by price or mix changes. If a country or region moves sharply year over year, the drivers are re-read, assumptions are reopened, and experts are re-contacted when the change cannot be explained with available evidence.
Before sign-off, the model goes through multi-step analyst reviews, including unit consistency checks, currency conversion timing checks, and sanity checks against related agricultural and food inflation series. Reports are refreshed annually, and interim updates are made when there are material events such as policy shifts, crop shocks, or major trade restrictions. Right before delivery, a fresh review pass is completed so clients get the most current view.
Mordor Intelligence's Vegetable Oil Market Size Compared With Other Published Estimates
Different published market sizes for vegetable oil do not always match because the market boundary is not picked the same way by every publisher, and because price and mix assumptions can shift the value quickly. The year used as the anchor, the treatment of trade, and how industrial uses are counted are also common reasons for the spread.
Key gap drivers in this market are whether coconut and olive oils are included, whether the estimate is limited to edible use only or also counts certified industrial use, and how pricing is built when crude versus refined shares move across regions. Some estimates also smooth prices too heavily across years or apply a single global average price, which can miss the impact of export unit values and local taxes on consumer packs.
Benchmark comparison
| Source | Market Size | Gaps in Research Methodology |
|---|---|---|
| Mordor Intelligence | USD 392.61 B (2025) | |
| Global Consultancy A | USD 248.60 B (2025) | Uses a narrower revenue pool that appears closer to packaged retail and selected end-use applications, and it also applies a flatter pricing curve that can understate bulk trade value in high-volume corridors. |
| Industry Publisher B | USD 192.71 B (2025) | Builds from a different base-year and scope mix, and it likely excludes large parts of bulk B2B trade and non-food uses, which reduces the counted value even if volumes are similar. |
Trade unit values, oilseed crush balances, and region-level consumption signals are the checks that keep Mordor Intelligence tied to a defined global demand pool that excludes coconut and olive oils but still captures bulk and consumer-pack flows. When the same signals are paired with a consistent crude-to-refined mix and currency timing, the final number stays traceable, and the steps can be repeated as new crop and trade data arrives.


Key Questions Answered in the Report
How large is the vegetable oil market in 2026?
The vegetable oil market size is valued at USD 421.23 billion in 2026, with a 7.29% CAGR forecast to 2031.
Which oil type holds the biggest share?
Palm oil leads with 28.63% of the vegetable oil market share in 2025, owing to its low cost and frying performance.
What is the fastest-growing oil type?
Sunflower oil is set for the quickest growth, advancing at 7.31% CAGR through 2031 as brands seek high-oleic, low-saturate options.
Which region dominates demand?
Asia-Pacific accounts for 48.76% of 2025 value and shows the fastest regional CAGR at 8.98% to 2031.
Page last updated on:


