United Kingdom Dairy Alternatives Market Size and Share
Market Overview
| Study Period | 2021 - 2031 |
|---|---|
| Forecast Data Period | 2026 - 2031 |
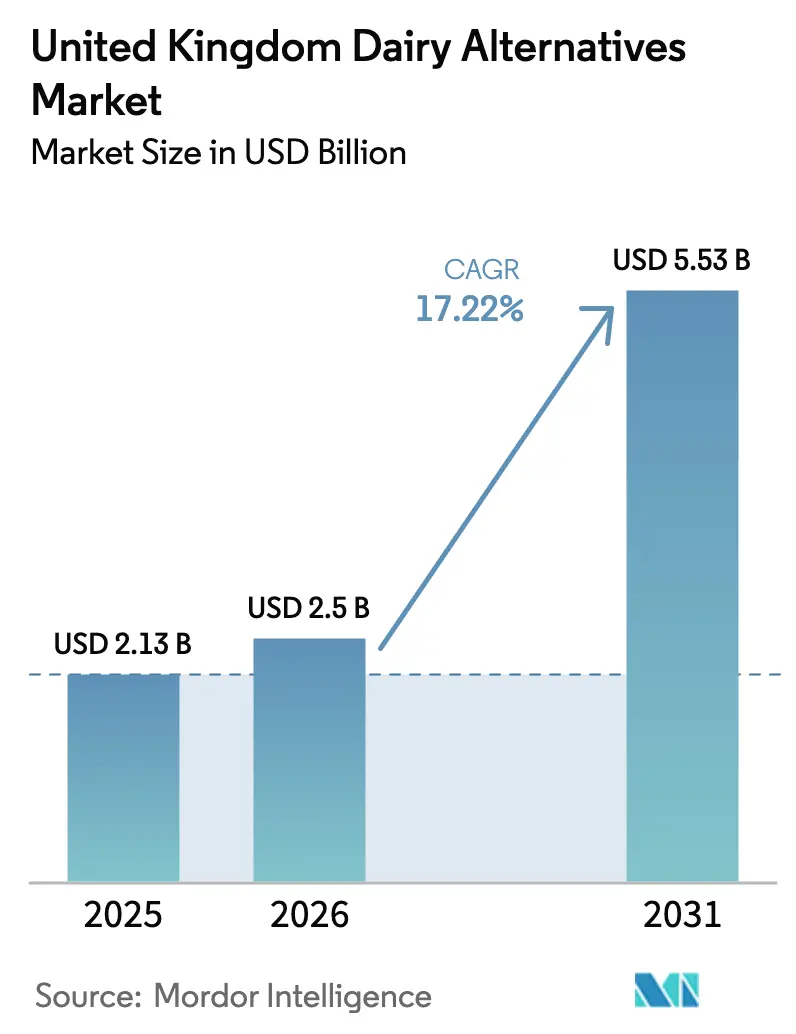
| Base Year Market Size (2025) | USD 2.13 Billion |
| Market Size (2026) | USD 2.5 Billion |
| Market Size (2031) | USD 5.53 Billion |
| Growth Rate (2026 - 2031) | 17.22% CAGR |
| Market Concentration | Medium |
Major Players *Disclaimer: Major Players sorted in no particular order Image © Mordor Intelligence. Reuse requires attribution under CC BY 4.0. | |
United Kingdom Dairy Alternatives Market Analysis by Mordor Intelligence
The United Kingdom dairy alternatives market size was valued at USD 2.13 billion in 2025 and estimated to grow from USD 2.5 billion in 2026 to reach USD 5.53 billion by 2031, at a CAGR of 17.22% during the forecast period (2026-2031). This growth is driven by increasing health consciousness, heightened awareness of lactose intolerance, and the rising popularity of vegan and flexitarian diets. These factors are gradually reducing per-capita consumption of conventional dairy and integrating dairy alternatives into daily diets. Environmental and ethical concerns, including climate impact and animal welfare, further support this transition, as consumers increasingly view dairy alternatives as a sustainable choice aligned with personal values. The market is also becoming more innovation-driven and sophisticated, with brands competing on attributes such as barista performance, taste, texture, nutritional fortification, and sustainability credentials, rather than solely focusing on being dairy-free.
Key Report Takeaways
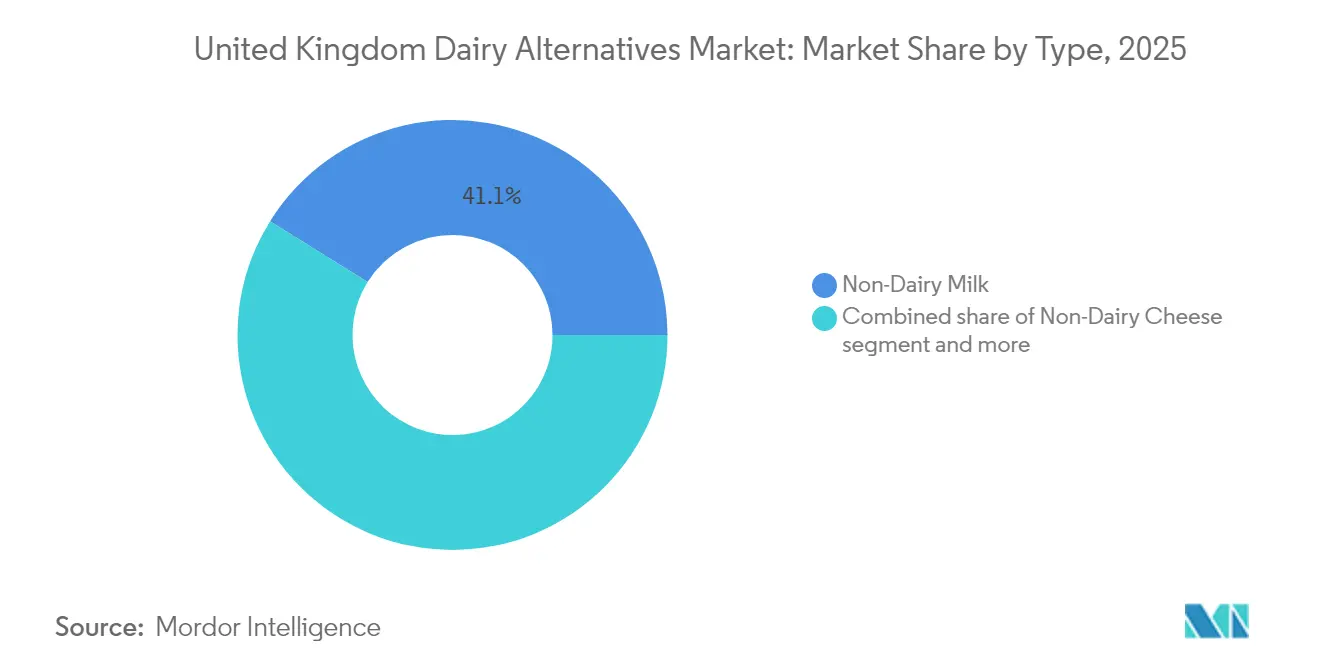
- By type, non-dairy milk held 41.12% of the United Kingdom dairy alternatives market share in 2025; non-dairy cheese is advancing at a 21.95% CAGR to 2031.
- By flavor, unflavored products captured 63.45% of 2025 sales, while flavored variants are set to grow at a 19.12% CAGR through 2031.
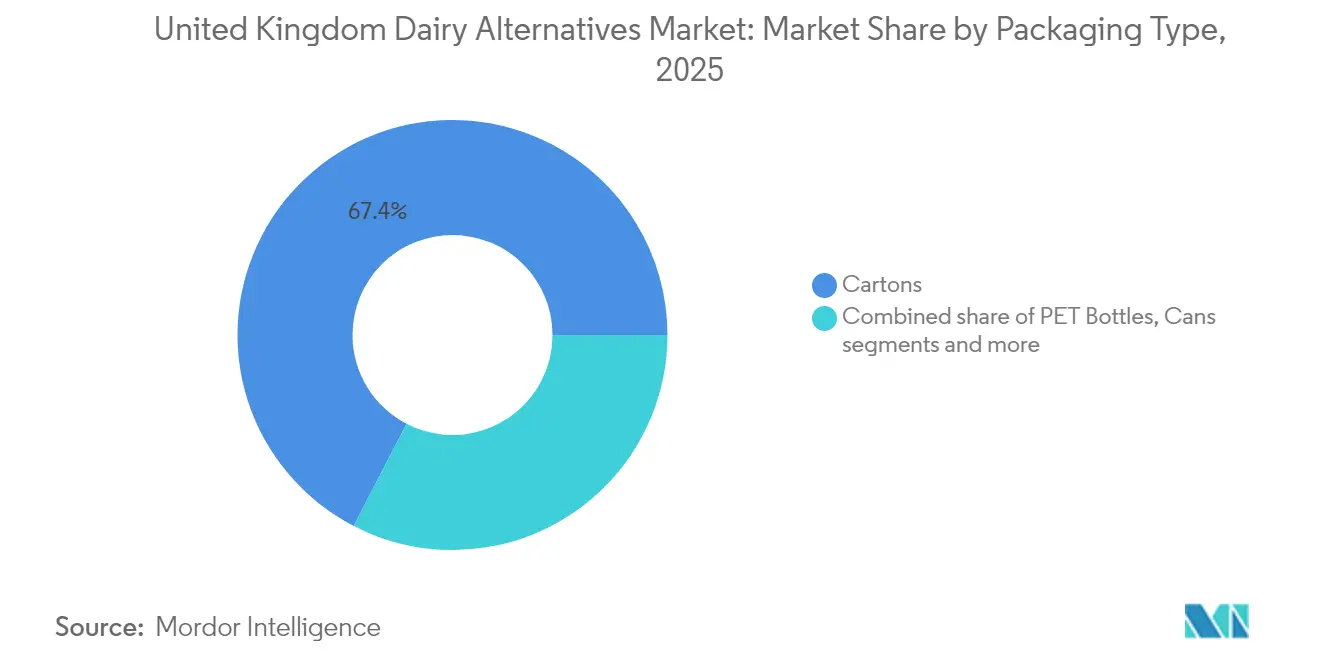
- By packaging, cartons dominated with 67.40% share in 2025; PET bottles are expanding at an 18.35% CAGR to on-the-go demand.
- By channel, off-trade accounted for 96.85% of distribution in 2025; on-trade is ramping up at an 18.10% CAGR as barista-grade oat milk gains traction in coffee shops.
Note: Market size and forecast figures in this report are generated using Mordor Intelligence’s proprietary estimation framework, updated with the latest available data and insights as of 2026.
United Kingdom Dairy Alternatives Market Trends and Insights
Drivers Impact Analysis*
| Driver | (~) % Impact on CAGR Forecast | Geographic Relevance | Impact Timeline |
|---|---|---|---|
| Increasing lactose intolerance awareness | +2.8% | National, with higher incidence in urban centers (London, Manchester, Birmingham) | Medium term (2-4 years) |
| Environmental and ethical concerns | +3.2% | National, strongest among under-45 demographics and higher-income households | Long term (≥ 4 years) |
| Product innovation and diversification | +4.1% | National, concentrated in retail and foodservice channels | Short term (≤ 2 years) |
| Social media marketing and celebrity endorsements | +1.9% | National, with amplified impact in London and urban centers with younger demographics | Short term (≤ 2 years) |
| Rising veganism and flexitarian diets | +3.6% | National, with urban concentration and higher adoption in Scotland and Wales | Medium term (2-4 years) |
| Fortification of products with vitamins and minerals | +2.3% | National, particularly relevant for health-conscious and family-oriented segments | Medium term (2-4 years) |
| Source: Mordor Intelligence | |||


Increasing lactose intolerance awareness
Increasing awareness of lactose intolerance is a significant driver of the United Kingdom Dairy Alternatives Market, as it expands the number of consumers actively seeking non-dairy options for daily consumption. As more individuals in the United Kingdom identify symptoms such as bloating, abdominal pain, and digestive discomfort associated with conventional dairy, they are increasingly opting for dairy alternatives as both a preventive measure and a lifestyle choice. This shift reflects a long-term structural change rather than a temporary trend. Health professionals, public health campaigns, and social media have played a crucial role in raising awareness of lactose intolerance and sensitivity, prompting even mildly affected or self-diagnosed individuals to choose lactose-free or dairy-alternative products to avoid gastrointestinal discomfort and promote digestive health. Supporting this trend, in February 2024, Müller introduced a coconut milk-based yogurt in the United Kingdom, specifically targeting consumers seeking dairy-free and lactose-free options while desiring indulgent, spoonable products with familiar branding. This launch highlights how traditionally dairy-focused companies are adapting to plant-based formulations in response to the growing awareness of lactose intolerance.
Environmental and ethical concerns
Environmental and ethical concerns are key factors driving the United Kingdom Dairy Alternatives Market, as consumers increasingly assess the carbon footprint, water usage, land impact, and animal welfare issues linked to traditional dairy production. These factors are shaping purchasing decisions at both the product and packaging levels, with United Kingdom consumers favoring brands that provide plant-based products supported by credible sustainability initiatives and transparent commitments. In response, companies are focusing on deforestation-free sourcing, reduced emissions, and animal-free labels, while retailers are establishing dedicated plant-based and eco-friendly sections to improve product visibility and accessibility. For example, in April 2024, Upfield introduced the world’s first plastic-free, recyclable tub for its plant-based butters and spreads. This initiative aligns with the company’s objective to reduce plastic usage across its portfolio by 80% by 2030. By combining plant-based products with innovative, plastic-reducing packaging, Upfield addresses United Kingdom consumers’ concerns about plastic pollution and climate change. This strategy highlights the dual environmental benefits of choosing dairy alternatives: lowering dairy-related emissions and reducing plastic waste.
Product innovation and diversification
Product innovation and diversification are key drivers of the United Kingdom Dairy Alternatives Market, as they enhance taste, texture, functionality, and nutritional value while appealing to new usage occasions and consumer segments. By expanding beyond traditional soy or almond milk to include specialized barista lines, high-protein variants, fortified products, and cuisine-specific formats, brands reduce barriers for flexitarians and mainstream consumers to replace dairy in coffee, cooking, baking, and snacking. This approach supports premium pricing and encourages repeat purchases. Highlighting this trend, in October 2025, plant-based milk brand Minor Figures introduced Barista Oat (Regenerative) in the United Kingdom. This gluten-free oat drink, specifically designed for coffee applications, is fortified with vitamins and minerals. By combining barista-grade performance with added nutritional benefits and regenerative agriculture credentials, this product demonstrates how innovation in functionality, health, and sustainability can differentiate offerings, attract discerning coffee consumers, and drive the growth of dairy alternatives in the United Kingdom market.
Rising veganism and flexitarian diets
Rising veganism and the adoption of flexitarian diets are significant drivers of the United Kingdom Dairy Alternatives Market. These trends have broadened demand beyond a niche vegan demographic to a wider mainstream audience, consciously reducing, rather than eliminating, animal products. A growing number of consumers identify as vegan, vegetarian, or flexitarian, with many others intending to reduce their consumption of meat and dairy for health, environmental, and ethical reasons. This shift has steadily increased the number of shoppers who view dairy alternatives as regular or default choices rather than occasional substitutes. Supporting this trend, the UK Food Council’s 2025 Restaurants Report highlights that 1 in 5 UK diners identify as at least flexitarian. This indicates that a significant portion of restaurant patrons are actively seeking to reduce their consumption of animal products, even if they are not fully vegan. This flexitarian presence in the foodservice sector drives operators to expand plant-based menu options, include non-dairy milk in standard coffee offerings, and feature vegan desserts and main courses.
Restraints Impact Analysis*
| Restraint | (~) % Impact on CAGR Forecast | Geographic Relevance | Impact Timeline |
|---|---|---|---|
| Taste and texture limitations | -2.4% | National, most acute in cheese and yogurt segments | Medium term (2-4 years) |
| Supply chain and raw material challenges | -1.8% | National, with heightened exposure in post-Brexit import-dependent brands | Short term (≤ 2 years) |
| Higher price point compared to dairy | -3.1% | National, disproportionately affecting lower-income households and value-focused retailers | Short term (≤ 2 years) |
| Shorter shelf life compared to dairy products | -1.6% | National, concentrated in fresh and refrigerated formats | Medium term (2-4 years) |
| Source: Mordor Intelligence | |||
Taste and texture limitations
Taste and texture limitations remain a significant restraint in the United Kingdom Dairy Alternatives Market, particularly among non-vegan and flexitarian consumers who compare these products directly to conventional dairy. Despite ongoing advancements, many plant-based milks, cheeses, and yogurts are still widely perceived as thinner, less creamy, or having off-notes such as beany, grassy, or nutty flavors that deviate from the familiar profiles of cow’s milk and traditional cheese. These sensory shortcomings significantly impact repeat purchase intent, especially in indulgent applications like specialty coffees, pizza cheese, or spoonable yogurts, where attributes such as mouthfeel, meltability, and flavor neutrality are critical to consumer satisfaction. As a result, concerns over taste and texture remain one of the most prominent barriers preventing occasional users and mainstream dairy consumers from fully adopting or regularly incorporating dairy alternatives into their daily routines.
Higher price point compared to airy
The higher price point compared to dairy products is a significant restraint for the United Kingdom Dairy Alternatives Market. Many dairy alternatives remain considerably more expensive than conventional cow’s milk and dairy products on a per-litre or per-kilogram basis. On average, plant-based milks, such as oat and almond milk, are priced higher than dairy milk, although the price gap has narrowed slightly in recent years. These higher prices are attributed to increased processing costs, smaller production scales, and ongoing research and development (R&D) efforts to replicate the taste and functionality of dairy products. However, these factors limit adoption among price-sensitive households, who may opt to use dairy alternatives occasionally rather than as part of their daily consumption. As a result, despite growing interest in the health and sustainability benefits of dairy alternatives, their elevated shelf prices continue to restrict accessibility and slow the rate at which mainstream consumers replace traditional dairy products in their regular purchases.
*Our forecasts treat driver/restraint impacts as directional, not additive. The impact forecasts reflect baseline growth, mix effects, and variable interactions.
Segment Analysis
By Type: Oat Milk Dominance Masks Cheese Acceleration
Non-dairy milk accounted for 41.12% of the category value in the United Kingdom Dairy Alternatives Market in 2025, establishing itself as the leading segment. This dominance is primarily attributed to the increasing consumer shift towards plant-based diets, driven by heightened health awareness and growing recognition of lactose intolerance and dairy allergies. Among non-dairy milk options, oat milk has gained significant popularity due to its creamy texture, mild flavor, and perceived health benefits, including high fiber and vitamin content. Its versatility for use in beverages, cooking, and baking further enhances its appeal. Additionally, the segment's nutritional and functional benefits, such as being cholesterol-free, lower in saturated fats, and often fortified with vitamins and minerals, resonate strongly with health-conscious consumers.
The non-dairy cheese segment in the United Kingdom Dairy Alternatives Market is projected to grow at a compound annual growth rate (CAGR) of 21.95% through 2031. This growth is driven by significant advancements in flavor, texture, and nutritional profiles, making non-dairy cheese more appealing to a wider audience seeking dairy-like experiences without animal-derived ingredients. Additionally, increasing awareness of environmental sustainability and animal welfare is encouraging consumers to transition from conventional cheese to plant-based alternatives. For instance, in November 2024, Bel Group introduced a plant-based version of its popular Boursin soft cheese in Garlic & Herbs flavor. This product aims to closely replicate the taste and texture of traditional dairy-based Boursin cheese.


By Flavor: Premiumization Drives Flavored Surge
Unflavored dairy alternatives accounted for 63.45% of sales in the United Kingdom Dairy Alternatives Market in 2025, maintaining a dominant position due to their versatility, perceived natural attributes, and alignment with health-conscious consumer preferences. These products are widely favored as a straightforward substitute for traditional dairy in everyday applications, particularly by consumers seeking a neutral base without added sugars, artificial flavors, or unnecessary ingredients that could affect recipes or calorie targets. Additionally, unflavored options benefit from better shelf stability, cost-effective production, and easier fortification with essential nutrients such as calcium, vitamin D, and B12, enhancing their nutritional equivalence to traditional dairy.
Flavored dairy alternatives in the United Kingdom Dairy Alternatives Market are projected to grow at a strong CAGR of 19.12% through 2031, driven by consumer interest in experimentation, premiumization trends, and the demand for indulgent, plant-based options that go beyond basic dairy replacements. This segment's growth is further supported by seasonal and limited-edition product launches, which encourage trial, generate social media engagement, and enable premium pricing. For instance, in July 2025, Califia Farms introduced two new nut-flavored blends, pistachio and hazelnut, to its oat barista drink line in the United Kingdom. These launches highlight how brands are leveraging the flavored segment's growth by offering sophisticated, barista-quality options designed for coffee enthusiasts and home users.
By Packaging Type: Sustainability Mandates Accelerate Paper Transition
Cartons accounted for 67.40% of the packaging share in the United Kingdom Dairy Alternatives Market in 2025, maintaining their leadership through strong sustainability credentials and functional advantages. This dominance is supported by cartons' aseptic processing capabilities, which extend shelf life without refrigeration, essential for non-dairy milks, yogurts, and creams. Additionally, their lightweight design facilitates efficient storage, transport, and recyclability, offering a lower carbon footprint compared to plastic or glass alternatives. High-quality printability enables effective branding and nutritional labeling, fostering consumer trust and supporting the premium positioning of products. Features such as stackability, pourability, and resealability enhance user convenience for daily household and foodservice use, driving repeat purchases and providing resilience against supply chain disruptions impacting rigid packaging.
PET bottles are growing at a CAGR of 18.35% in the United Kingdom Dairy Alternatives Market, driven by increasing demand for on-the-go formats and single-serve convenience. These attributes align with fast-paced urban lifestyles, remote work trends, and active consumer routines that require portable, spill-proof options for commutes, gyms, offices, and travel. PET bottles' recyclability, shatterproof durability, and cost-effective scalability support rapid market penetration, particularly amid the growth of e-commerce and subscription models. However, sustainability concerns remain a challenge. To address this, the Government of the United Kingdom introduced a Plastic Packaging Tax on plastic packaging components containing less than 30% recycled content . This regulation incentivizes PET bottle producers to incorporate higher recycled material content and develop sustainable formulations, reducing regulatory costs while improving eco-credentials for dairy alternatives.
By Distribution Channel: On-Trade Recovery Outpaces Retail
Off-trade channels accounted for 96.85% of distribution in the United Kingdom Dairy Alternatives Market in 2025, reflecting their strong dominance driven by convenience, extensive product variety, and integration into routine consumer shopping habits. These channels serve as the primary purchasing points for dairy alternatives in the country. Supermarkets and hypermarkets play a significant role in this dominance by offering large shelf space, promotional activities, loyalty programs, and the convenience of one-stop shopping. These factors encourage impulse purchases, trials of new flavors such as oat or almond variants, and bulk buying, which often aligns with weekly grocery shopping. Additionally, the rapid growth of online retail has further strengthened off-trade channels by providing subscription models, home delivery services, and personalized recommendations, catering to the needs of busy urban professionals and flexitarian families.
On-trade channels in the United Kingdom Dairy Alternatives Market are projected to grow at a robust CAGR of 18.10% through 2031. Cafés, coffee chains, restaurants, and other foodservice operators are increasingly incorporating dairy alternatives into their menus to meet the rising demand for vegan, flexitarian, and lactose-free options in out-of-home consumption. This growth is supported by the premiumization of beverages, enhanced menu visibility for plant-based options, and growing consumer expectations for dairy-free choices in hospitality venues. According to the Office for National Statistics, consumer spending on restaurants and cafés in the United Kingdom increased in 2024 compared to the previous year, reaching approximately GBP 138.39 billion . This rise in out-of-home dining and beverage consumption creates a favorable environment for the adoption of dairy alternatives in on-trade outlets.
Geography Analysis
The United Kingdom represents a mature yet dynamic market for dairy alternatives, supported by strong consumer awareness, well-developed retail infrastructure, and regulatory frameworks that encourage plant-based innovation. Urban centers such as London exhibit higher adoption rates, driven by multicultural demographics, higher income levels, and a concentration of specialty retailers and coffee shops. This has led to increased demand for products like oat and almond milk in high-traffic areas, including Manchester and other metropolitan regions.
Scotland and Wales demonstrate slightly higher per-capita adoption of plant-based products compared to England, possibly due to greater environmental awareness and localized food movements. These regions benefit from strong local supply chains, government initiatives promoting sustainability, and a growing cultural focus on eco-friendly practices. Urban areas like Edinburgh are at the forefront of non-dairy cheese and yogurt consumption, influenced by wellness trends and the increasing availability of innovative plant-based options. Additionally, community-driven efforts and collaborations with local producers have further supported the growth of plant-based alternatives in these regions.
The United Kingdom's role as a regulatory leader in Europe enhances the strategic significance of its market beyond its size. Initiatives by the Food Standards Agency, such as the 2024 vegan labeling campaign addressing allergen risks and the review of novel food approval processes, indicate a more stringent regulatory landscape . These developments could either drive innovation or create challenges, positioning the country as a key testing ground for plant-based standards across Europe.
Competitive Landscape
The United Kingdom dairy alternatives market is moderately fragmented, with increasing competitive intensity driven by the convergence of precision-fermentation startups, private-label offerings, and multinational companies targeting similar health, sustainability, and taste-focused positioning. Established brands utilize their scale, research and development (R&D), and strong retailer relationships, while retailers expand their own-label dairy alternatives, leading to margin compression and necessitating continuous innovation in functionality and clean-label attributes. Meanwhile, agile startups emphasize niche claims such as high protein content, sugar reduction, or carbon labeling, shifting competition toward more differentiated value propositions rather than basic dairy replacements.
Key players in the United Kingdom market include Blue Diamond Growers, Arla Foods amba, Coconut Collaborative Ltd, Danone SA, and Oatly Group AB, each leveraging unique strengths. These companies invest significantly in marketing, barista-focused product lines, and category management to maintain shelf space and brand equity amidst growing competition. Their strategies increasingly focus on localized sourcing, sustainability metrics, and nutrition-oriented messaging to appeal to health-conscious and environmentally aware consumers in the United Kingdom.
Precision-fermentation technologies are creating opportunities in cheese and yogurt formats, where challenges related to texture and meltability have historically limited plant-based adoption. This has led to collaborations between ingredient technology firms and established players. In March 2025, Danone-owned plant-based dairy brand Alpro announced a transition to 100% locally sourced oats for its oat milk range in the United Kingdom. This move highlights how incumbents are adopting localized sourcing to mitigate supply risks, reduce environmental impacts, and enhance their positioning as made-for-UK products against both imports and domestic private labels.
United Kingdom Dairy Alternatives Industry Leaders
Arla Foods amba
Blue Diamond Growers
Oatly Group AB
Danone S.A.
Coconut Collaborative Ltd
- *Disclaimer: Major Players sorted in no particular order

Recent Industry Developments
- September 2025: Kallø launched two new premium oat milk products: Organic Oat & Protein Milk and Organic Gluten-Free Oat Milk. These products are made with minimal ingredients and processing.
- June 2025: Violife has introduced Supreme Cheddarton, a new plant-based cheddar cheese alternative. This product is the first in its category to offer a high protein content and contains 30% less fat compared to traditional dairy cheddar.
- April 2025: Oppo Brothers has introduced a new range of low-calorie, vegan ice cream sticks under the brand name Oppo Refreshed. Offered in three flavors, each stick contains 49 calories and holds a Nutri-Score A rating.
- July 2024: The Coconut Collab has introduced a new plant-based protein yogurt, offering 10g of protein per serving. This coconut yogurt is fermented with live cultures to support gut health and includes added natural plant protein derived from soy and almonds.


United Kingdom Dairy Alternatives Market Report Scope
Non-Dairy Butter, Non-Dairy Cheese, Non-Dairy Ice Cream, Non-Dairy Milk, Non-Dairy Yogurt are covered as segments by Category. Off-Trade, On-Trade are covered as segments by Distribution Channel.| Non-Dairy Milk | Oat Milk |
| Hemp Milk | |
| Hazelnut Milk | |
| Soy Milk | |
| Almond Milk | |
| Coconut Milk | |
| Cashew Milk | |
| Non-Dairy Cheese | |
| Non-Dairy Desserts | |
| Non-Dairy Yogurt | |
| Others |
| Flavored |
| Unflavored |
| PET Bottles |
| Cans |
| Cartons |
| Others |
| On-trade | |
| Off-trade | Convenience Stores |
| Supermarkets and Hypermarkets | |
| On-line Retail | |
| Others (Warehouse clubs, gas stations, etc.) |
| By Type | Non-Dairy Milk | Oat Milk |
| Hemp Milk | ||
| Hazelnut Milk | ||
| Soy Milk | ||
| Almond Milk | ||
| Coconut Milk | ||
| Cashew Milk | ||
| Non-Dairy Cheese | ||
| Non-Dairy Desserts | ||
| Non-Dairy Yogurt | ||
| Others | ||
| By Flavor | Flavored | |
| Unflavored | ||
| By Packaging Type | PET Bottles | |
| Cans | ||
| Cartons | ||
| Others | ||
| By Distribution Channel | On-trade | |
| Off-trade | Convenience Stores | |
| Supermarkets and Hypermarkets | ||
| On-line Retail | ||
| Others (Warehouse clubs, gas stations, etc.) | ||


Market Definition
- Dairy Alternatives - Dairy alternatives are foods that are made from plant-based milk/oils instead of their usual animal products, such as cheese, butter, milk, ice cream, yogurt, etc. Plant-based or non-dairy milk alternative is the fast-growing segment in the newer food product development category of functional and specialty beverage across the globe.
- Non-Dairy Butter - Non dairy butter is a vegan butter alternative that is made from a mixture of plant oils. With an increase in alternative diets like vegetarianism, veganism, and gluten intolerance, plant butter is a healthy non-dairy substitute for normal butter.
- Non-Dairy Ice Cream - Plant based ice cream is a growing category. Non-dairy ice cream is a type of dessert made without any animal ingredients. This is typically considered a substitute for regular ice cream for those who cannot or do not eat animal or animal-derived products, including eggs, milk, cream, or honey.
- Plant-Based Milk - Plant based milks are milk substitutes that are made from nuts (e.g., hazelnuts, hemp seeds), seeds (e.g., sesame, walnuts, coconuts, cashews, almonds, rice, oats, etc.) or legumes (e.g., soy). Plant-based milk such as soy milk and almond milk have been popular in East Asia and the Middle East for centuries.
| Keyword | Definition |
|---|---|
| Cultured Butter | Cultured butter is prepared by having the raw butter go through chemical processing and has been added with certain emulsifiers and foreign ingredients. |
| Uncultured Butter | This type of butter is one which has not been processed in any way |
| Natural Cheese | The type of cheese in its most natural form. It is made from natural and simple products and ingredients, including fresh and natural salts, natural colors, enzymes, and high-quality milk. |
| Processed Cheese | Processed cheese undergoes the same processes as natural cheese; however, it requires more steps and many different forms of ingredients. Making processed cheese involves melting natural cheese, emulsifying it, and adding preservatives and other artificial ingredients or colorings. |
| Single Cream | Single cream contains around 18% fat. It’s a single layer of cream that appears over boiled milk. |
| Double Cream | Double cream contains 48% fat, more than double the amount of fat of single cream. It’s heavier and thicker than single cream |
| Whipping Cream | This has a much higher fat percentage than single cream (36%). Used to top cakes, pies, and puddings and as a thickener for sauces, soups, and fillings. |
| Frozen Desserts | Desserts that are meant to be eaten in frozen condition. E.g., sherbets, sorbets, frozen yogurts |
| UHT Milk (Ultra-high temperature milk) | Milk heated at a very high temperature. Ultra-high-temperature processing (UHT) of milk involves heating for 1–8 sec at 135–154°C. which kills the spore-forming pathogenic microorganism, resulting in a product with a shelf-life of several months. |
| Non-dairy butter/Plant-based butter | Butter made from plant-derived oil such as coconut, palm, etc. |
| Non-dairy Yogurt | Yogurt made from typically made from nuts, like almonds, cashews, coconuts, and even other foods like soybeans, plantains, oats, and peas |
| On-trade | It refers to restaurants, QSRs, and bars. |
| Off-trade | It refers to supermarkets, hypermarkets, on-line channels, etc. |
| Neufchatel cheese | One of the oldest kinds of cheese in France. It is a soft, slightly crumbly, mold-ripened, bloomy-rind cheese made in the Neufchâtel-en-Bray region of Normandy. |
| Flexitarian | It refers to a consumer preferring a semi-vegetarian diet, that is centered on plant foods with limited or occasional inclusion of meat. |
| Lactose Intolerance | Lactose intolerance is a reaction in digestive system to lactose, the sugar in milk. It causes uncomfortable symptoms in response to the consumption of dairy products. |
| Cream Cheese | Cream cheese is a soft and creamy fresh cheese with a tangy taste made from milk and cream. |
| Sorbets | Sorbet is a frozen dessert made using ice combined with fruit juice, fruit purée, or other ingredients, such as wine, liqueur, or honey. |
| Sherbet | Sherbet is a sweetened frozen dessert made with fruit and some sort of dairy product such as milk or cream. |
| Shelf stable | Foods that can be safely stored at room temperature, or "on the shelf," for at least one year and do not have to be cooked or refrigerated to eat safely. |
| DSD | Direct Store Delivery is the process in supply chain management wherein the product is delivered from manufacturing plant directly to the retailer. |
| OU Kosher | Orthodox Union Kosher is a kosher certification agency based in New York City. |
| Gelato | Gelato is a frozen creamy dessert made with milk, heavy cream and sugar. |
| Grass-fed Cows | Grass-fed cows are allowed to graze in pastures, where they eat a variety of grasses and clover. |


Research Methodology
Mordor Intelligence follows a four-step methodology in all our reports.
- Step-1: Identify Key Variables: In order to build a robust forecasting methodology, the variables and factors identified in Step 1 are tested against available historical market numbers. Through an iterative process, the variables required for market forecast are set, and the model is built on the basis of these variables.
- Step-2: Build a Market Model: Market-size estimations for the forecast years are in nominal terms. Inflation is not a part of the pricing, and the average selling price (ASP) is kept constant throughout the forecast period for each country.
- Step-3: Validate and Finalize: In this important step, all market numbers, variables, and analyst calls are validated through an extensive network of primary research experts from the market studied. The respondents are selected across levels and functions to generate a holistic picture of the market studied.
- Step-4: Research Outputs: Syndicated Reports, Custom Consulting Assignments, Databases & Subscription Platforms


