Market Overview
| Study Period | 2021 - 2031 |
|---|---|
| Forecast Data Period | 2026 - 2031 |
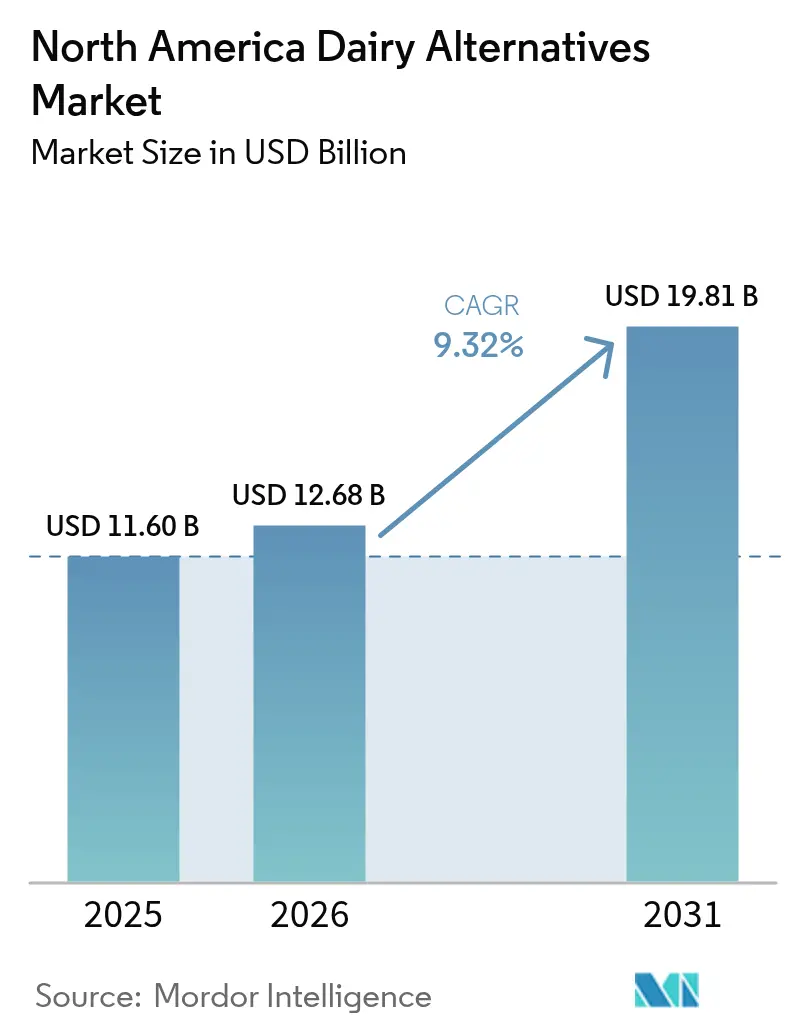
| Base Year Market Size (2025) | USD 11.60 Billion |
| Market Size (2026) | USD 12.68 Billion |
| Market Size (2031) | USD 19.81 Billion |
| Growth Rate (2026 - 2031) | 9.32% CAGR |
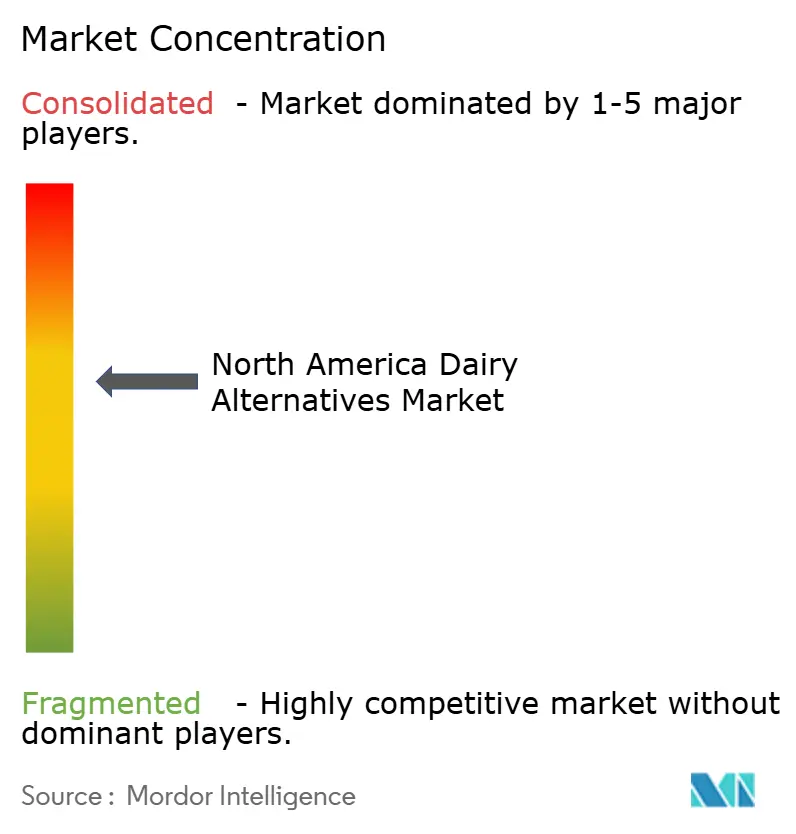
| Market Concentration | Medium |
Major Players
*Disclaimer: Major Players sorted in no particular order Image © Mordor Intelligence. Reuse requires attribution under CC BY 4.0. |
|
North America Dairy Alternatives Market Analysis by Mordor Intelligence
The dairy alternatives market size in North America was valued at USD 11.60 billion in 2025 and estimated to grow from USD 12.68 billion in 2026 to reach USD 19.81 billion by 2031, at a CAGR of 9.32% during the forecast period (2026-2031). This growth is driven by a confluence of factors: an uptick in lactose intolerance, the rise of flexitarian diets, and evolving policies that elevate plant-based proteins to parity with their animal counterparts. While off-trade retail remains a cornerstone of value, on-trade venues are rapidly embracing the trend. Heightened health consciousness favors low-calorie, nutrient-fortified, and protein-rich alternatives like soy and almond milk. Cafés and quick-service restaurants are not only waiving surcharges but also highlighting premium barista-grade offerings. In packaging, the industry is pivoting from traditional shelf-stable cartons to recyclable PET, aligning with retailer sustainability benchmarks. Competitive dynamics see multinationals snapping up niche brands, while disruptors capitalize on direct-to-consumer strategies. Notably, precision fermentation and high-protein fortification are carving out unique market differentiators.
Key Report Takeaways
- By product type, non-dairy milk led with 53.94% of the dairy alternatives market share in 2025, whereas non-dairy cheese is forecast to advance at a 9.44% CAGR through 2031.
- By packaging type, cartons commanded 51.88% of the dairy alternatives market size in 2025, while PET bottles present the fastest trajectory at a 9.62% CAGR to 2031.
- By distribution channel, off-trade retail contributed 87.12% of revenue in 2025; on-trade venues are growing at a 9.95% CAGR as menu differentiation becomes a margin driver.
- By geography, the United States held 80.95% of the value in 2025; Mexico represents the growth hotspot with a 10.05% CAGR outlook to 2031.
Note: Market size and forecast figures in this report are generated using Mordor Intelligence’s proprietary estimation framework, updated with the latest available data and insights as of 2026.
North America Dairy Alternatives Market Trends and Insights
Drivers Impact Analysis*
| Driver | (~) % Impact on CAGR Forecast | Geographic Relevance | Impact Timeline |
|---|---|---|---|
| Rising lactose intolerance and milk allergy incidence | +1.8% | United States and Mexico (urban centers) | Medium term (2-4 years) |
| Expanding vegan and flexitarian consumer base | +2.1% | North America, concentrated in United States coastal metros and Canadian urban centers | Long term (≥4 years) |
| Heightened health consciousness favoring low-calorie, nutrient-fortified, and protein-rich alternatives | +1.5% | United States, Canada, Mexico City metropolitan area | Medium term (2-4 years) |
| Product innovations in taste, texture, and fortification making alternatives comparable to dairy | +2.3% | United States, Canada, early adoption in Mexico premium retail | Short term (≤2 years) |
| Supportive regulations and plant-based dietary guidelines | +0.9% | United States (FDA), Canada (Health Canada), Mexico (Secretaría de Salud) | Long term (≥4 years) |
| Foodservice adoption by food chains | +1.4% | United States, Canada, Mexico (QSR expansion in Monterrey, Guadalajara) | Short term (≤2 years) |
| Source: Mordor Intelligence | |||


Rising lactose intolerance and milk allergy incidence
In the United States, a growing number of adults are experiencing lactose malabsorption, driving demand for alternatives that conventional dairy products cannot fulfill. Although lactose intolerance is widespread among adults, it is rarely life-threatening. About 30 million American adults have some degree of lactose intolerance by age 20 in 2024, according to Medline Plus [1]Source: Medline Plus, "Lactose intolerance", medlineplus.gov. This physiological issue is further highlighted by increasing awareness of IgE-mediated milk protein allergies, which affect 2-3% of children under three and often persist into adulthood. This has led to a rise in pediatric formulations enriched with calcium carbonate and vitamin D3, designed to mimic the nutritional profiles of breast milk and infant formulas. The combination of genetic predisposition and delayed diagnoses, where many adults misidentify the cause of their digestive discomfort, has created opportunities for brands like Ripple Foods. Their marketing, which emphasizes 8 grams of pea protein per 240-milliliter serving, is effectively converting latent demand into measurable sales growth. Regulatory bodies are also adapting to these changes. In 2024, Health Canada updated its fortification standards, requiring a minimum of 300 milligrams of calcium per 250-milliliter serving. This ensures that plant-based options can substantiate their claims of nutritional equivalence to traditional dairy on retail shelves.
Expanding vegan and flexitarian consumer base
Flexitarians, who reduce but do not completely eliminate animal products, often choose plant-based meals for ethical and environmental reasons rather than adhering to strict dietary guidelines. This group is economically attractive due to their lower price sensitivity compared to dedicated vegans. For example, flexitarians may pay a premium for oat milk at coffee shops but often use conventional dairy for cooking, where taste differences are less noticeable. In 2025, animal rights organization PETA ranked Chicago as the most vegan-friendly city in the U.S., citing its wide range of plant-based options [2Source: PETA, PETA’s Top 10 Vegan-Friendly Cities of 2025", peta.org]. Concurrently, urbanization in Guadalajara and Monterrey, Mexico, is driving increased supermarket availability of plant-based milk, with retailers like Soriana and Chedraui responding to millennial and Gen Z preferences for sustainable protein sources. Although the vegan population remains small, its influence on product development is substantial. Brands target this vocal minority to gain endorsements from advocacy groups that amplify their reach through social media platforms.
Heightened health consciousness favoring low-calorie, nutrient-fortified, and protein-rich alternatives
Consumers are increasingly scrutinizing macronutrient profiles, opting for unsweetened almond milk with just 30-40 calories per 240-milliliter serving over whole dairy milk, which contains 150 calories. This preference is particularly evident among individuals focused on weight management and diabetics monitoring their glycemic load. The market is driven by health-conscious consumers embracing plant-based diets. According to the Good Food Institute, 59% of U.S. households purchased plant-based foods in 2024 [3]Source: Good Food Institute, " U.S retail market insights for the plant-based industry", gfi.org. Protein fortification has become a key focus area; Califia Farms introduced its Protein Oat line in January 2025, offering 10 grams of pea and faba bean protein per serving to appeal to fitness enthusiasts who previously relied on whey-based shakes. While most brands now include 450 milligrams of calcium and 2.5 micrograms of vitamin D per serving to align with dairy standards, differentiation is shifting toward omega-3 fatty acids, vitamin B12, and prebiotic fibers to address gut health concerns. The growing use of continuous glucose monitors by non-diabetics is driving demand for low-sugar formulations. In response, Oatly launched its Unsweetened variant in January 2024, featuring zero added sugars and appealing to biohackers tracking postprandial glucose levels.
Product innovations in taste, texture, and fortification making alternatives comparable to dairy
Brands are increasingly adopting enzymatic hydrolysis and high-pressure homogenization to replicate dairy's mouthfeel and address off-notes like bitterness in almond milk and chalkiness in soy products. In January 2025, Califia Farms introduced Übermilk, which blends oat, almond, and coconut fats to deliver a creamy texture in hot coffee, resolving the separation issue seen in earlier oat milk versions. Miyoko's Creamery has leveraged precision fermentation on cashew and coconut bases to improve cultured butter and aged cheese analogs, achieving a flavor complexity comparable to traditional European cheeses. Barista-focused formulations, such as Oatly's Barista Edition and Pacific Foods' Barista Series, include added fats (like sunflower or canola oil) and stabilizers, such as gellan gum, to produce microfoam suitable for latte art. This advancement led Starbucks to eliminate the USD 0.70 surcharge for non-dairy milk in November 2024, significantly expanding their market reach.
Restraints Impact Analysis*
| Restraint | (~) % Impact on CAGR Forecast | Geographic Relevance | Impact Timeline |
|---|---|---|---|
| Price premium over conventional dairy | -1.2% | North America, most acute in United States rural markets and Mexico lower-income segments | Medium term (2-4 years) |
| Sensory and nutritional parity concerns | -0.8% | United States, Canada, Mexico (cheese and yogurt categories) | Short term (≤2 years) |
| Labeling standard uncertainty ("milk," "butter") | -0.5% | United States (state-level conflicts in Wisconsin, Idaho), limited impact in Canada and Mexico | Long term (≥4 years) |
| Limited shelf life and supply chain challenges | -0.9% | North America, particularly rural United States, northern Canada, and Mexico distribution networks | Medium term (2-4 years) |
| Source: Mordor Intelligence | |||
Price premium over conventional dairy
Plant-based milk is priced at USD 4-6 per liter, significantly higher than the USD 2-3 per liter for conventional dairy. This 50-100% premium stems from the higher costs of raw materials, as almonds, oats, and peas are 2-3 times more expensive per kilogram than fluid milk. Additionally, the smaller production scale of plant-based milk limits economies of density in processing and distribution. Almond prices, in particular, are highly volatile. For example, California's 2024 harvest experienced a price increase due to drought-reduced yields, forcing brands like Blue Diamond to either absorb margin compression or pass the costs onto retailers. Moreover, oat milk production involves a specialized enzymatic treatment to convert starches into soluble sugars, adding processing costs that conventional dairy does not incur. This significant price gap not only restricts penetration into price-sensitive segments but also reduces repeat purchase frequency. Consumers often switch between plant-based and conventional options, largely influenced by promotional activities.
Sensory and nutritional parity concerns
Non-dairy cheese and yogurt continue to face challenges with taste and texture. Achieving meltability, stretchiness, and tangy fermentation notes using plant substrates remains difficult. Coconut oil-based cheese analogs often have a waxy mouthfeel and perform poorly in browning under heat. This limits their application in pizzas and gratins, where functional performance is essential. Regarding protein content, many almond and coconut milks provide only 1 gram per 240-milliliter serving, compared to 8 grams in dairy milk. This disparity raises nutritional concerns among pediatricians and dietitians advising parents on child nutrition. Although fortification adds micronutrients such as calcium, vitamin D, and B12, it cannot fully replace the complete protein profiles and bioavailable amino acids found in whey and casein. Sensory innovations are advancing. For instance, Kite Hill's almond-based ricotta and cream cheese closely match dairy in blind taste tests. However, scaling these formulations to achieve mass-market price points remains a significant technical and economic hurdle.
*Our forecasts treat driver/restraint impacts as directional, not additive. The impact forecasts reflect baseline growth, mix effects, and variable interactions.
Segment Analysis
By Product Type: Cheese Outpaces Milk in Innovation Velocity
Non-dairy milk accounted for 53.94% of the market value in 2025, capitalizing on its first-mover advantage and widespread retail availability. At the same time, non-dairy cheese is projected to grow at a 9.44% CAGR through 2031 as brands address previous issues with melt, stretch, and flavor complexity. Oat milk, known for its superior frothing capabilities, dominates the beverage segment and is particularly popular among baristas. Almond milk remains a favorite among calorie-conscious consumers, while soy milk, once the market leader, has lost share to oat and almond milks due to ongoing concerns about phytoestrogens and GMOs. Despite this, soy milk continues to lead in protein content, providing 7-8 grams per 240-milliliter serving. Coconut milk is primarily used in niche applications such as Thai cuisine and tropical smoothies, but its high saturated fat content limits its mainstream appeal. Cashew, hemp, and hazelnut milks occupy the premium segment, priced at USD 6-8 per liter, and attract consumers seeking allergen-free options or unique flavor profiles.
Non-dairy cheese is experiencing growth driven by advancements in precision fermentation, which enable the production of casein analogs without animal inputs. Companies like Miyoko's Creamery and Kite Hill are leveraging this technology to produce aged cheddar and mozzarella formats that achieve functional parity for use in pizza and grilled cheese. Daiya has improved the meltability of its tapioca-based shreds and slices by incorporating modified starch blends. Meanwhile, Follow Your Heart offers soy-free formulations that address allergen concerns in foodservice environments where cross-contamination risks are significant. Non-dairy yogurt and desserts are steadily growing, supported by coconut and almond bases that replicate the creamy texture of Greek yogurt. However, protein content remains a distinguishing factor in this category. The "Others" category, which includes creamers, ice creams, and butter substitutes, focuses on indulgence and functional performance. While sensory gaps in these products are narrowing, they have not yet been fully resolved.


By Packaging Type: PET Gains on Sustainability and Convenience
In 2025, cartons accounted for 51.88% of the market share, supported by aseptic technology. This technology enables ambient storage and reduces cold-chain costs, providing brands with a strategic advantage, particularly those targeting pantry-stocking trends and export markets. Tetra Pak and SIG Combibloc dominate this space, offering multi-layer barriers that protect contents from light and oxygen. These innovations ensure a shelf life of 6-12 months without preservatives. Meanwhile, PET bottles are experiencing significant growth, expanding at a 9.62% CAGR through 2031. This growth is driven by recyclability mandates in California and Canada that promote mono-material packaging, along with increasing demand for single-serve options in on-the-go markets, where 300-500 milliliter bottles command premium prices.
Although cans represent a smaller segment, they are gaining traction, particularly in ready-to-drink coffee and protein shakes. Aluminum's infinite recyclability and rapid chilling capabilities appeal to environmentally conscious consumers. The "Others" category includes glass bottles, which are popular in premium markets, and flexible pouches, commonly used for bulk dispensing in food services. Packaging innovation remains crucial for improving profit margins. Brands that develop proprietary formats—such as Oatly's distinctive rectangular carton or Ripple's clear bottle that highlights product color—stand out on shelves and build brand recognition, enabling them to justify higher retail prices. However, regulatory pressures are intensifying. Canada's proposed Single-Use Plastics Prohibition Regulations (2024) may restrict certain PET formats, encouraging brands to adopt refillable systems and concentrated formats aimed at reducing packaging use per liter consumed.

By Distribution Channel: On-Trade Narrows the Gap
In 2025, off-trade channels accounted for 87.12% of sales, highlighting the dominance of supermarkets, hypermarkets, and online platforms where consumers engage in weekly shopping and compare brand prices. Convenience stores and warehouse clubs contributed modestly, though the latter is expanding as Costco and Sam's Club enhance their organic and plant-based assortments to attract affluent suburban households. Online platforms such as Amazon Fresh, Instacart, and Thrive Market are gaining popularity among millennials and Gen Z, who favor subscription services and direct-to-consumer brands like Elmhurst 1925 that avoid traditional retail markups. On the other hand, on-trade venues are expected to grow at a 9.95% CAGR through 2031, driven by foodservice operators who recognize that offering dairy alternatives generates additional revenue from lactose-intolerant and vegan customers without reducing conventional dairy sales.
Dunkin', McDonald's McCafé, and independent coffee shops are adapting to this trend, acknowledging that dairy alternatives have shifted from being a niche option to a standard expectation among younger consumers. Institutional foodservice providers—such as universities, hospitals, and corporate campuses- are increasingly requiring plant-based options to align with Gen Z preferences. Companies like Aramark and Compass Group now mandate at least one dairy alternative at every beverage station, leading to bulk procurement contracts that prioritize shelf-stable formats in aseptic cartons. The faster growth of the on-trade channel reflects a structural change as operators pursue higher margins, plant-based milk, while more expensive per serving, allows for higher menu prices, and strive for menu differentiation in competitive markets.
Geography Analysis
In 2025, the U.S. led the region, contributing 80.95% of revenue. This dominance stems from early-mover brands, a robust retail network, and high per-capita consumption of coffee and cereal, two key applications where dairy alternatives have nearly matched traditional milk. California drives state-level adoption, influenced by health-conscious coastal cities, strict environmental policies favoring plant-based diets, and proximity to almond and oat processing facilities, which lowers logistics costs. However, as the market matures, growth is slowing. Adoption among lactose-intolerant and vegan consumers is nearing saturation, and further expansion depends on converting flexitarians. These consumers switch between plant-based and traditional options based on taste, price, and occasion. Starbucks' decision to eliminate its surcharge in November 2024 reflects a strategic effort to reduce barriers and grow its market. Early results show increased trials, but repeat purchase rates remain inconsistent as consumers revert to dairy when promotional pricing narrows the cost difference.
Mexico is projected to grow at a 10.05% CAGR through 2031, the fastest rate in the region. This growth is driven by urbanization in cities like Guadalajara, Monterrey, and Mexico City, where rising disposable incomes and exposure to U.S. food trends align with government dietary guidelines that now promote plant-based proteins. Retailers such as Soriana, Chedraui, and Walmart de México have increased shelf space for plant-based milk, catering to millennial and Gen Z preferences for sustainable and health-focused products. However, price sensitivity remains a significant challenge, positioning plant-based options as aspirational purchases for the urban middle class. Domestic production is still limited, with only a few brands like Vita producing oat milk locally. This creates an opportunity for multinational companies to establish processing facilities in Mexico, enabling them to bypass import tariffs and currency risks while improving margins.
Canada and other North American regions contribute modestly but are experiencing regulatory support. In 2024, Health Canada updated its Food Guide, elevating plant-based proteins to the same level as animal sources and encouraging Canadians to "choose protein foods that come from plants more often". This policy shift supports the inclusion of dairy alternatives in institutional procurement for schools, hospitals, and government cafeterias, driving demand for bulk contracts, particularly for shelf-stable formats in aseptic cartons. Ontario and British Columbia lead adoption, supported by urban centers like Toronto and Vancouver. Independent coffee shops and natural-food retailers, including premium brands like Elmhurst 1925 and Oatly, provide distribution channels in these provinces. However, Northern Canada faces logistical challenges. Regions like Yukon and Nunavut lack sufficient refrigerated trucking capacity, limiting market penetration beyond major urban areas. This creates opportunities for ambient-stable products that can withstand extended distribution cycles.
Competitive Landscape
The North American dairy alternatives market is moderately fragmented. Leading players like Danone SA, Oatly Group AB, Califia Farms LLC, Blue Diamond Growers, and Agrifoods International Cooperative Ltd dominates, yet there's significant space for regional specialists and direct-to-consumer disruptors to carve out niche segments. Multinational conglomerates are increasingly turning to acquisitions, seeking to bolster their technical capabilities and brand equity. A case in point is Danone's May 2025 acquisition of Kate Farms, a move underscoring its strategic shift towards medical nutrition and high-protein formulations, which command a 30-40% premium over standard oat and almond bases. Meanwhile, brands like Oatly and Miyoko's Creamery are sidestepping traditional retail gatekeepers, leveraging partnerships with baristas and direct-to-consumer channels.
Key players in North America's dairy alternatives market are driving continuous product innovation and strategic expansions. These companies are not only developing new plant-based dairy formulations, focusing on milk alternatives like oat, almond, and soy, but are also branching into related categories such as yogurt, cheese, and frozen desserts. Demonstrating operational agility, many are investing in advanced manufacturing facilities and sustainable production processes, with several upgrading existing plants to cater to rising demand. Strategic market maneuvers include forging partnerships with foodservice chains, collaborating with retailers for exclusive product launches, and embracing digital transformation to bolster direct-to-consumer channels. Geographic expansion is paramount, with companies setting up new production facilities in diverse regions and acquiring local brands to fortify their market presence. The industry's heightened emphasis on research and development, sustainability initiatives, and clean-label products underscores its responsiveness to shifting consumer preferences.
Emerging white-space opportunities in hemp, hazelnut, and cashew milk are drawing attention. Here, flavor differentiation and allergen-free positioning are enticing niche cohorts willing to pay a premium over conventional dairy. Brands are rapidly adopting technology, with precision fermentation being deployed to craft casein analogs sans animal inputs. A notable example is Miyoko's Creamery, which is pioneering this in aged cheddar and mozzarella formats, achieving functional parity for pizza and grilled-cheese applications. However, smaller entrants are navigating regulatory gray areas. The FDA's voluntary labeling guidance allows the use of "milk" terminology without mandating fortification levels. This loophole lets brands market a low-protein almond milk alongside a nutrient-rich pea milk, without clear on-pack differentiation. Such gaps might soon face regulatory scrutiny, especially as consumer advocacy groups push the FDA to set minimum nutritional standards for products labeled with dairy terminology.
North America Dairy Alternatives Industry Leaders
-
Agrifoods International Cooperative Ltd
-
Blue Diamond Growers
-
Califia Farms LLC
-
Danone SA
-
Oatly Group AB
- *Disclaimer: Major Players sorted in no particular order

Recent Industry Developments
- July 2025: Danone has strategically acquired Kate Farms, a U.S.-based producer of plant-based medical nutrition products. This acquisition enhances Danone's presence in the high-protein, clinically-formulated dairy alternatives market. These products are primarily targeted at hospital and home-care settings, where reimbursement models support premium pricing and functional nutrition profiles designed to promote patient recovery and weight management.
- May 2025: Californian plant-based dairy brand Eclipse Foods has introduced a new whole milk product, describing it as “indistinguishable” from traditional, animal-derived milk. Eclipse states that its Non-Dairy Whole Milk “truly replicates milk” by isolating proteins from peas and chickpeas, successfully mimicking the molecular structure of dairy.
- January 2025: Danone has expanded its plant-based portfolio by launching a range of vegan probiotic almond yogurts. This new series features four flavors: Vanilla, Strawberry, Lemon Meringue, and Chocolate Coconut.


North America Dairy Alternatives Market Report Scope
By Product Type
| Non-Dairy Milk | Oat Milk |
| Hemp Milk | |
| Hazelnut Milk | |
| Soy Milk | |
| Almond Milk | |
| Coconut Milk | |
| Cashew Milk | |
| Non-Dairy Cheese | |
| Non-Dairy Desserts | |
| Non-Dairy Yogurt | |
| Others |
Packaging Type
| PET Bottles |
| Cans |
| Cartons |
| Others |
Distribution Channel
| On-trade | |
| Off-trade | Convenience Stores |
| Supermarkets and Hypermarkets | |
| On-line Retail | |
| Others |
Conutry
| United States |
| Canada |
| Mexico |
| Rest of North America |
| By Product Type | Non-Dairy Milk | Oat Milk |
| Hemp Milk | ||
| Hazelnut Milk | ||
| Soy Milk | ||
| Almond Milk | ||
| Coconut Milk | ||
| Cashew Milk | ||
| Non-Dairy Cheese | ||
| Non-Dairy Desserts | ||
| Non-Dairy Yogurt | ||
| Others | ||
| Packaging Type | PET Bottles | |
| Cans | ||
| Cartons | ||
| Others | ||
| Distribution Channel | On-trade | |
| Off-trade | Convenience Stores | |
| Supermarkets and Hypermarkets | ||
| On-line Retail | ||
| Others | ||
| Conutry | United States | |
| Canada | ||
| Mexico | ||
| Rest of North America | ||


Market Definition
- Dairy Alternatives - Dairy alternatives are foods that are made from plant-based milk/oils instead of their usual animal products, such as cheese, butter, milk, ice cream, yogurt, etc. Plant-based or non-dairy milk alternative is the fast-growing segment in the newer food product development category of functional and specialty beverage across the globe.
- Non-Dairy Butter - Non dairy butter is a vegan butter alternative that is made from a mixture of plant oils. With an increase in alternative diets like vegetarianism, veganism, and gluten intolerance, plant butter is a healthy non-dairy substitute for normal butter.
- Non-Dairy Ice Cream - Plant based ice cream is a growing category. Non-dairy ice cream is a type of dessert made without any animal ingredients. This is typically considered a substitute for regular ice cream for those who cannot or do not eat animal or animal-derived products, including eggs, milk, cream, or honey.
- Plant-Based Milk - Plant based milks are milk substitutes that are made from nuts (e.g., hazelnuts, hemp seeds), seeds (e.g., sesame, walnuts, coconuts, cashews, almonds, rice, oats, etc.) or legumes (e.g., soy). Plant-based milk such as soy milk and almond milk have been popular in East Asia and the Middle East for centuries.
| Keyword | Definition |
|---|---|
| Cultured Butter | Cultured butter is prepared by having the raw butter go through chemical processing and has been added with certain emulsifiers and foreign ingredients. |
| Uncultured Butter | This type of butter is one which has not been processed in any way |
| Natural Cheese | The type of cheese in its most natural form. It is made from natural and simple products and ingredients, including fresh and natural salts, natural colors, enzymes, and high-quality milk. |
| Processed Cheese | Processed cheese undergoes the same processes as natural cheese; however, it requires more steps and many different forms of ingredients. Making processed cheese involves melting natural cheese, emulsifying it, and adding preservatives and other artificial ingredients or colorings. |
| Single Cream | Single cream contains around 18% fat. It’s a single layer of cream that appears over boiled milk. |
| Double Cream | Double cream contains 48% fat, more than double the amount of fat of single cream. It’s heavier and thicker than single cream |
| Whipping Cream | This has a much higher fat percentage than single cream (36%). Used to top cakes, pies, and puddings and as a thickener for sauces, soups, and fillings. |
| Frozen Desserts | Desserts that are meant to be eaten in frozen condition. E.g., sherbets, sorbets, frozen yogurts |
| UHT Milk (Ultra-high temperature milk) | Milk heated at a very high temperature. Ultra-high-temperature processing (UHT) of milk involves heating for 1–8 sec at 135–154°C. which kills the spore-forming pathogenic microorganism, resulting in a product with a shelf-life of several months. |
| Non-dairy butter/Plant-based butter | Butter made from plant-derived oil such as coconut, palm, etc. |
| Non-dairy Yogurt | Yogurt made from typically made from nuts, like almonds, cashews, coconuts, and even other foods like soybeans, plantains, oats, and peas |
| On-trade | It refers to restaurants, QSRs, and bars. |
| Off-trade | It refers to supermarkets, hypermarkets, on-line channels, etc. |
| Neufchatel cheese | One of the oldest kinds of cheese in France. It is a soft, slightly crumbly, mold-ripened, bloomy-rind cheese made in the Neufchâtel-en-Bray region of Normandy. |
| Flexitarian | It refers to a consumer preferring a semi-vegetarian diet, that is centered on plant foods with limited or occasional inclusion of meat. |
| Lactose Intolerance | Lactose intolerance is a reaction in digestive system to lactose, the sugar in milk. It causes uncomfortable symptoms in response to the consumption of dairy products. |
| Cream Cheese | Cream cheese is a soft and creamy fresh cheese with a tangy taste made from milk and cream. |
| Sorbets | Sorbet is a frozen dessert made using ice combined with fruit juice, fruit purée, or other ingredients, such as wine, liqueur, or honey. |
| Sherbet | Sherbet is a sweetened frozen dessert made with fruit and some sort of dairy product such as milk or cream. |
| Shelf stable | Foods that can be safely stored at room temperature, or "on the shelf," for at least one year and do not have to be cooked or refrigerated to eat safely. |
| DSD | Direct Store Delivery is the process in supply chain management wherein the product is delivered from manufacturing plant directly to the retailer. |
| OU Kosher | Orthodox Union Kosher is a kosher certification agency based in New York City. |
| Gelato | Gelato is a frozen creamy dessert made with milk, heavy cream and sugar. |
| Grass-fed Cows | Grass-fed cows are allowed to graze in pastures, where they eat a variety of grasses and clover. |


Research Methodology
Mordor Intelligence follows a four-step methodology in all our reports.
- Step-1: Identify Key Variables: In order to build a robust forecasting methodology, the variables and factors identified in Step 1 are tested against available historical market numbers. Through an iterative process, the variables required for market forecast are set, and the model is built on the basis of these variables.
- Step-2: Build a Market Model: Market-size estimations for the forecast years are in nominal terms. Inflation is not a part of the pricing, and the average selling price (ASP) is kept constant throughout the forecast period for each country.
- Step-3: Validate and Finalize: In this important step, all market numbers, variables, and analyst calls are validated through an extensive network of primary research experts from the market studied. The respondents are selected across levels and functions to generate a holistic picture of the market studied.
- Step-4: Research Outputs: Syndicated Reports, Custom Consulting Assignments, Databases & Subscription Platforms


