Market Overview
| Study Period | 2021 - 2031 |
|---|---|
| Forecast Data Period | 2026 - 2031 |
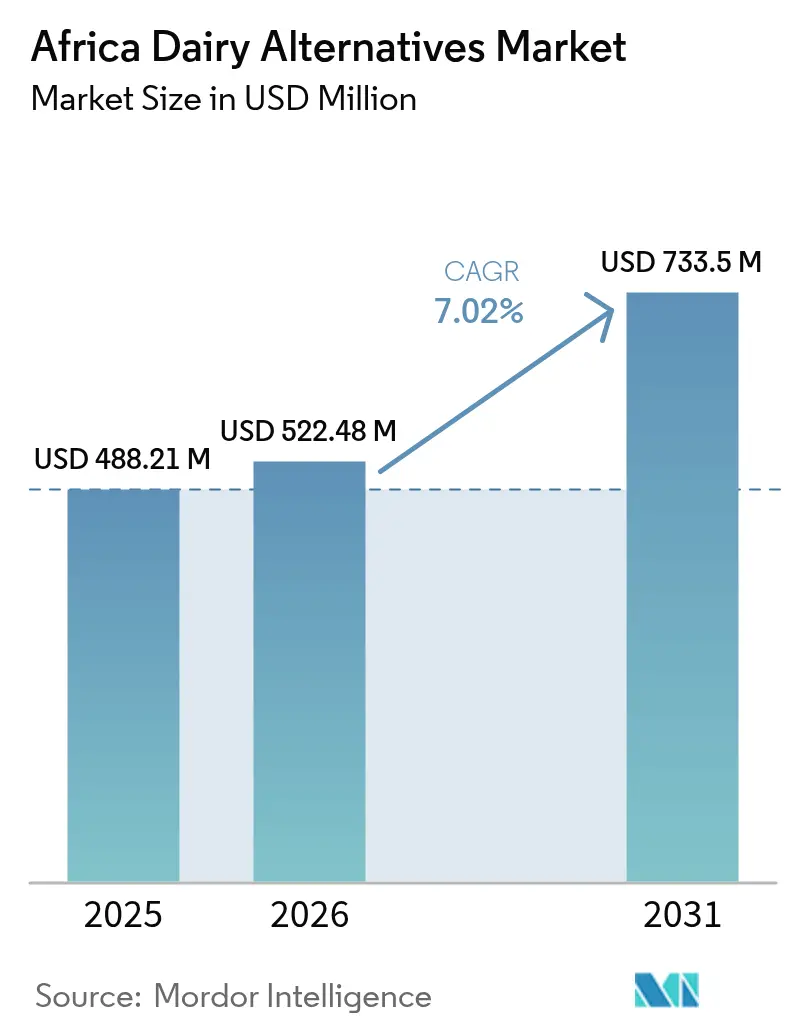
| Base Year Market Size (2025) | USD 488.21 Million |
| Market Size (2026) | USD 522.48 Million |
| Market Size (2031) | USD 733.5 Million |
| Growth Rate (2026 - 2031) | 7.02% CAGR |
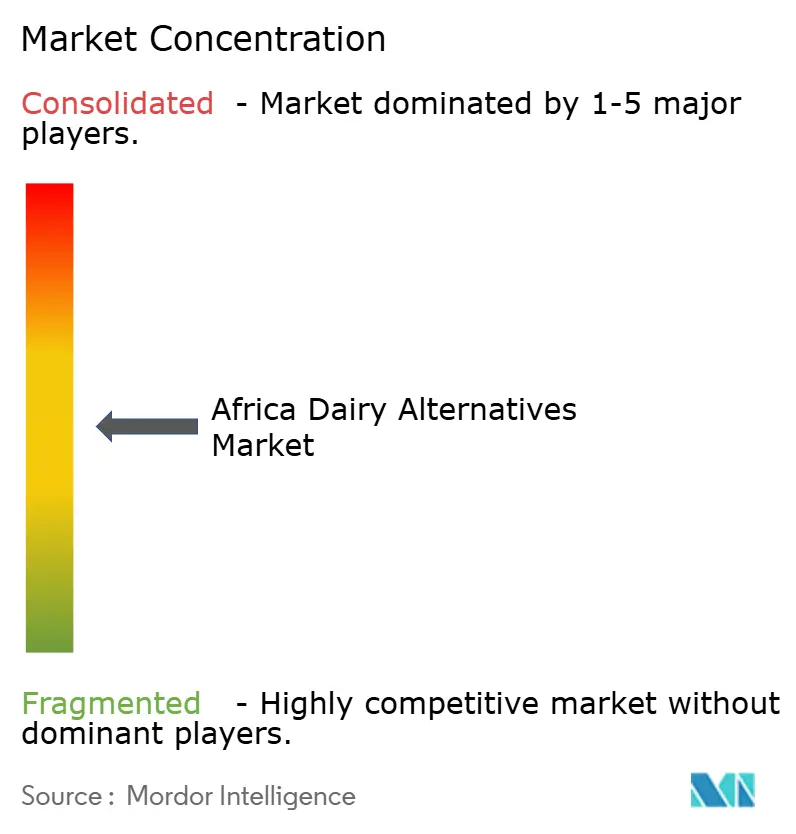
| Market Concentration | Medium |
Major Players
*Disclaimer: Major Players sorted in no particular order Image © Mordor Intelligence. Reuse requires attribution under CC BY 4.0. |
|
Africa Dairy Alternatives Market Analysis by Mordor Intelligence
The Africa dairy alternatives market size is expected to grow from USD 488.21 million in 2025 to USD 522.48 million in 2026 and is forecast to reach USD 733.5 million by 2031 at 7.02% CAGR over 2026-2031. This growth trajectory reflects a structural shift driven by the continent's exceptionally high lactose intolerance prevalence, 77.54% Africa-wide, peaking at 87% in Nigeria and 81% in South Africa, which creates a biological imperative for non-dairy consumption that distinguishes Africa from lower-prevalence regions [1]Source: National Library of Medicine, "Lactose Intolerance, Dairy Avoidance, and Treatment Options", pmc.ncbi.nlm.nih.gov. In contrast to Western markets, where plant-based adoption is largely driven by ethical or environmental considerations, the demand in Africa is primarily based on physiological needs. However, the market is still in its early stages, with minimal penetration compared to South Africa's substantial annual dairy consumption and the United States. Multinational and regional players are racing to unlock untapped demand by launching affordable soy, oat, and coconut recipes, while foodservice operators add barista-grade options that raise everyday exposure. Investments in PET recycling and aseptic carton upgrades signal how packaging innovation is addressing cold-chain constraints and circularity goals. The competitive field is also widening as precision-fermentation start-ups gain funding for dairy-identical proteins, a technology push that promises to close current gaps in taste and texture.
Key Report Takeaways
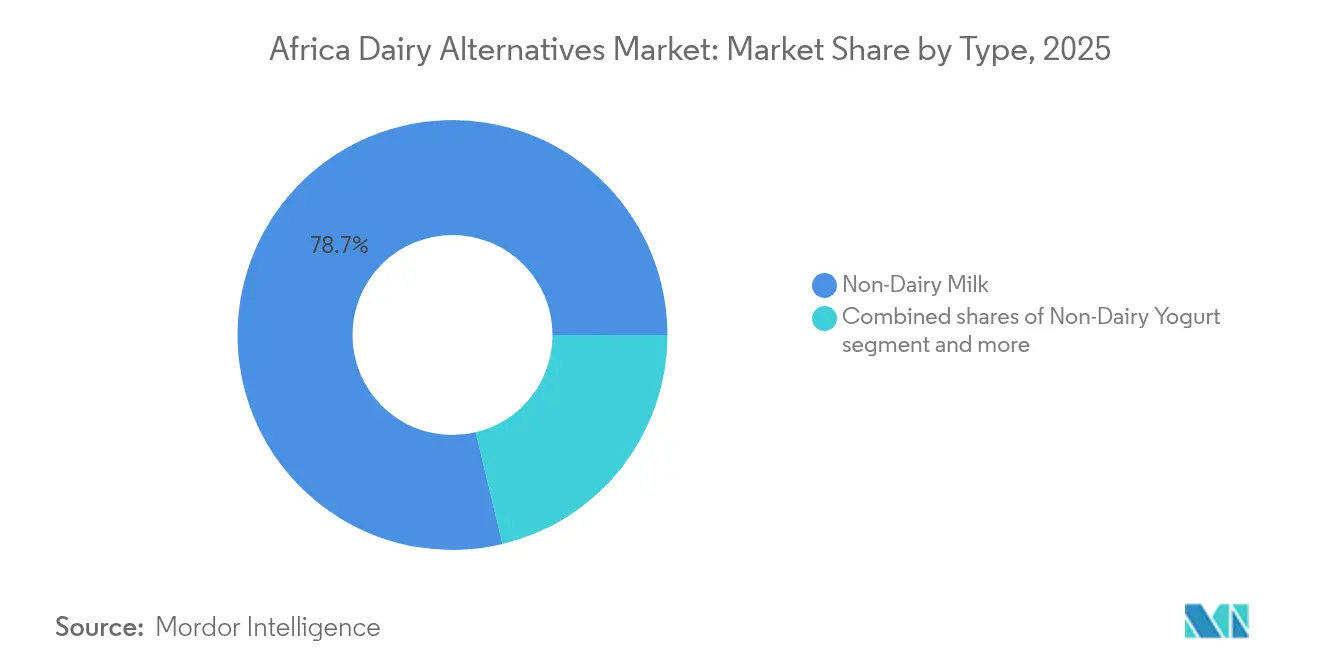
- By product type, non-dairy milk held 78.74% of the dairy alternatives market share in 2025, while non-dairy yogurt is projected to expand at an 8.07% CAGR to 2031.
- By packaging, cartons commanded 54.02% revenue in 2025; PET bottles are set to record the fastest 8.54% CAGR through 2031.
- By distribution, off-trade accounted for 50.21% of 2025 sales, whereas on-trade is expected to grow at a 9.08% CAGR over the forecast window.
- By geography, South Africa captured 48.62% of 2025 value, yet Nigeria is anticipated to log the highest 7.52% CAGR to 2031.
Note: Market size and forecast figures in this report are generated using Mordor Intelligence’s proprietary estimation framework, updated with the latest available data and insights as of 2026.
Africa Dairy Alternatives Market Trends and Insights
Drivers Impact Analysis*
| Driver | (~) % Impact on CAGR Forecast | Geographic Relevance | Impact Timeline |
|---|---|---|---|
| Presence of lactose intolerance population | +2.1% | Nigeria (87% prevalence), South Africa (81%), Kenya, Ethiopia | Long term (≥ 4 years) |
| Youth shifting toward vegan, flexitarian diets | +1.5% | South Africa urban centers, Nigeria Lagos/Abuja, Kenya Nairobi | Medium term (2-4 years) |
| Social media, influencers promote plant diets | +0.9% | Pan-African, concentrated in markets with >50% smartphone penetration | Short term (≤ 2 years) |
| Growing concern over dairy animal welfare | +0.6% | South Africa, Kenya, urban Nigeria | Medium term (2-4 years) |
| Modern retail, cafes expanding product range | +1.4% | South Africa, Nigeria, Kenya, Ghana, Egypt | Medium term (2-4 years) |
| Inclination towards managing heart health, diabetes | +1.2% | South Africa (high CVD burden), Nigeria, Egypt | Long term (≥ 4 years) |
| Source: Mordor Intelligence | |||
Presence of Lactose Intolerance Population
The high prevalence of lactose intolerance in Africa establishes a consistent demand base, shielding the market from fluctuations in discretionary consumption. Nigeria and South Africa serve as key entry points for dairy-alternative products, as highlighted by the National Center for Biotechnology Information. Unlike Western markets, where plant-based product adoption is often a lifestyle choice, the African market is driven by digestive necessity. This allows local brands to focus on functional benefits rather than premium positioning. The lactase non-persistence phenotype is particularly prevalent among Bantu-speaking populations, who form the majority in sub-Saharan Africa. Despite this, only 1-2% of South Africa's annual dairy consumption of 1.5 billion liters has transitioned to plant-based alternatives, indicating significant untapped potential. This gap is primarily limited by distribution and affordability challenges rather than a lack of demand. In Kenya, where lactose intolerance is at 39%, the lowest on the continent, historical dairy consumption among pastoralist communities highlights the need for market strategies that consider genetic and cultural diversity, rather than adopting a uniform approach across Africa.
Youth Shifting Toward Vegan, Flexitarian Diets
In South Africa, the youth demographic shows a notable adoption of plant-based diets, with many adhering to strict plant-based regimens. This trend reflects early-stage adoption patterns observed in Australia and the United Kingdom a decade ago. Urban millennials and Gen Z consumers in cities such as Johannesburg, Cape Town, and Durban are driving this shift, citing health benefits (68%) and environmental sustainability (52%) as key motivators. However, 31% of this group report a lack of knowledge about plant-based nutrition, suggesting that educational initiatives could help boost adoption rates. In Nigeria, where the median age is 18.6 years, the country stands as the youngest major economy on the continent. Urbanization in cities like Lagos, Abuja, and Port Harcourt is exposing young consumers to global dietary trends through social media and international quick-service restaurant chains[2]Source: World Population Review, "Population of Nigeria", worldpopulationreview.com. Additionally, the launch of Flora Food Group's BlueBand Choco in Kenya in April 2024 became the most successful FMCG product introduction of the year. This success highlights how youth-focused formulations with indulgent positioning can overcome the "health food" stigma that often limits growth in this category.
Social Media, Influencers Promote Plant Diets
Digital platforms are compressing the awareness-to-trial cycle in markets where traditional retail infrastructure lags consumer interest. Instagram and TikTok campaigns by local influencers have driven siginificant sales uplifts in South African stores that dedicate shelf space to plant-based destinations, with Pick n Pay reporting that its expanded assortment of over 300 SKUs correlates directly with social media engagement metrics. Tetra Pak's "better with carton" campaign launched in Lagos in November 2024 leveraged influencer partnerships to reframe carton packaging as a sustainability signal rather than a commodity format, illustrating how multinational suppliers are co-opting social proof to differentiate their technology platforms. However, the efficacy of influencer marketing remains geographically uneven, with smartphone penetration above 50% in South Africa and Kenya enabling virality, while Nigeria's fragmented connectivity limits reach outside tier-1 cities.
Inclination Towards Managing Heart Health, Diabetes
Cardiovascular disease and diabetes prevalence are rising across Africa as urbanization drives sedentary lifestyles and processed-food consumption, creating a health-crisis backdrop that positions plant-based dairy as a preventive intervention rather than a lifestyle choice. South Africa's high burden of non-communicable diseases has prompted government health agencies to promote dietary diversification, and plant-based dairy's cholesterol-free profile aligns with clinical guidelines for cardiovascular risk reduction [3]Source: World Health Organization, "Cardiovascular diseases (CVDs)", who.int. The University of the Free State's Food Innovation Laboratory launched an affordable soy-based dairy range in June 2024 explicitly targeting low-income households with diabetes and hypertension, a public-health-oriented approach that contrasts with premium positioning in Western markets. However, 42% of South African consumers cite high pricing as the primary barrier to adoption, meaning that health-driven demand will remain latent until brands achieve price parity with subsidized dairy through economies of scale or government intervention.
Restraints Impact Analysis*
| Restraint | (~) % Impact on CAGR Forecast | Geographic Relevance | Impact Timeline |
|---|---|---|---|
| Shorter shelf life compared to UHT dairy | -1.3% | Pan-African, acute in Nigeria, Ghana, Kenya outside metros | Medium term (2-4 years) |
| Taste, texture often inferior to cow's milk | -1.5% | South Africa, Nigeria, Kenya, Egypt | Long term (≥ 4 years) |
| Labeling laws restrict use of "milk" terms | -0.4% | South Africa (July 2025 meat analogue rules), EAC member states | Short term (≤ 2 years) |
| Poor cold chain outside metro cities | -1.8% | Nigeria, Kenya, Ghana, Tanzania, Uganda tier-2/3 cities | Long term (≥ 4 years) |
| Source: Mordor Intelligence | |||
Shorter Shelf Life Compared to UHT Dairy
Refrigerated plant-based dairy alternatives typically offer 7-14 day shelf life versus 6-12 months for ultra-high-temperature processed cow's milk, a disparity that forces African brands to prioritize UHT formats that degrade sensory attributes and narrow the addressable consumer base to those willing to accept taste trade-offs. Tetra Pak's aseptic carton technology, which enables ambient-stable storage without refrigeration, has become the de facto packaging standard in markets with unreliable cold chains, yet the high-temperature processing required (135-150°C for 2-4 seconds) denatures proteins and alters flavor profiles in ways that are particularly pronounced in plant-based formulations. The company's Tubular Heat Exchanger, which reduces energy consumption by 40% while maintaining ambient stability, represents an incremental improvement but does not resolve the fundamental sensory compromise. Flora Food Group's planned launch of BlueBand creams in several African markets in 2025 will test whether consumers accept UHT plant-based dairy in premium applications, or whether the category remains confined to cost-sensitive commodity segments.
Poor Cold Chain Outside Metro Cities
Africa's cold-chain infrastructure deficit, characterized by unreliable power grids, limited refrigerated transport, and sparse retail refrigeration, constrains fresh plant-based dairy distribution to tier-1 cities and forces brands to over-invest in UHT processing that degrades product quality. Tetra Pak's partnership with Wecyclers in Nigeria, announced at PROPAK West Africa 2024, aims to improve post-consumer carton recycling but does not address the upstream infrastructure gaps that prevent fresh product distribution beyond Lagos and Abuja. ALPLA's EUR 60 million investment in a South African PET recycling facility producing over 35,000 tonnes annually starting early 2025 signals growing confidence in refrigerated distribution within South Africa's relatively mature logistics network, yet the facility's location in Ballito (KwaZulu-Natal) reflects the geographic concentration of cold-chain capability rather than its expansion into underserved regions. The 1.8 percentage-point negative impact on CAGR from cold-chain deficits will persist until public-private partnerships deliver grid reliability and refrigerated transport networks that extend beyond coastal metros into inland population centers.
*Our forecasts treat driver/restraint impacts as directional, not additive. The impact forecasts reflect baseline growth, mix effects, and variable interactions.
Segment Analysis
By Type: Milk Dominance Masks Yogurt Velocity
Non-dairy milk's 78.74% market share in 2025 reflects its role as the entry category for lactose-intolerant consumers seeking direct dairy substitution, yet non-dairy yogurt's 8.07% CAGR through 2026-2031 signals that probiotic-fortified fermented products are capturing health-conscious consumers who prioritize gut health over simple lactose avoidance. Oat milk is gaining traction due to its creamy texture and lower water footprint compared to almond milk, with barista-grade formulations enabling adoption in South African cafe chains like Kauai and Seattle Coffee Company. Soy milk retains the largest share within the non-dairy milk segment due to its established supply chains and protein content that matches cow's milk, yet almond and coconut milks are growing faster as consumers prioritize taste over nutritional density. The University of the Free State's Food Innovation Laboratory launched an affordable soy-based dairy range in June 2024, demonstrating that cost-engineered formulations can unlock mass-market penetration in price-sensitive geographies.
Non-dairy cheese and non-dairy desserts remain nascent categories constrained by taste and texture gaps that fermentation technology has yet to fully resolve, while cashew milk and hazelnut milk occupy premium niches with limited distribution beyond South Africa's urban centers. Hemp milk's omega-3 fatty acid profile positions it as a functional beverage, but regulatory ambiguity around hemp-derived ingredients in several African countries limits commercial viability. De Novo FoodLabs' precision-fermentation platform, which secured ZAR 11 million (approximately USD 700,000) in South African government grants, aims to produce dairy-identical casein and whey proteins that could eliminate the sensory compromises currently constraining cheese and dessert adoption. Flora Food Group's BlueBand Choco launch in Kenya in April 2024, which became the most successful FMCG product introduction that year, illustrates how indulgent positioning can overcome the health-food stigma that limits category growth.


By Packaging Type: Sustainability Tilts Toward PET
Cartons accounted for 54.02% of the market share in 2025, driven by Tetra Pak's ambient-stable aseptic technology, which supports distribution in regions with unreliable cold chain infrastructure. However, PET bottles are projected to grow at a CAGR of 8.54% from 2026 to 2031, fueled by urbanization and increasing demand for portion-controlled formats and on-the-go consumption. ALPLA's EUR 60 million investment in a South African PET recycling facility, set to produce over 35,000 tonnes annually starting in early 2025, highlights the advancement of closed-loop recycling infrastructure, enhancing PET's sustainability credentials to compete with cartons' renewable fiber content. Tetra Pak's "Better with Carton" campaign, launched in Lagos in November 2024, reflects a strategic effort to position cartons as a sustainability symbol rather than a commodity format, countering PET's convenience advantage. Additionally, Tetra Pak's collaboration with Lactalis in October 2024 to develop aseptic cartons using ISCC PLUS-certified recycled polymers underscores the integration of recycled content by carton suppliers to sustain their environmental differentiation.
Cans remain a niche format constrained by higher material costs and limited consumer familiarity, while reusable packaging models like Smartfill, Gcwalisa, and Reusefy are piloting deposit-return schemes in South Africa that could disrupt single-use formats if scaled beyond early-adopter segments. Carrinho's February 2025 installation of SIPA PET packaging technology in Angola signals that regional players are investing in high-speed automation to achieve cost parity with imported products, a dynamic that will intensify competition and compress margins. Tetra Pak's collaboration with Lactogal to develop paper-based barrier cartons with 90% renewable content and 33% carbon reduction in 2024 illustrates how packaging innovation is shifting from functional performance to environmental impact as a primary differentiation axis.
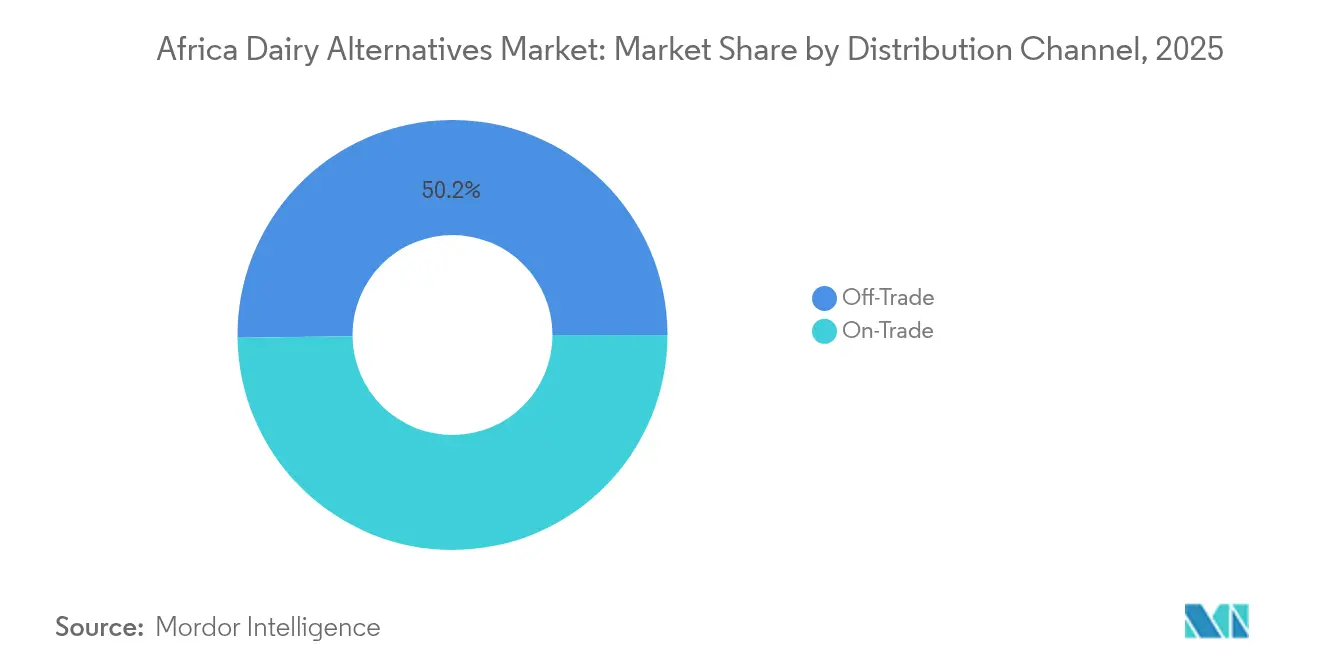
By Distribution Channel: On-Trade Gains Premium Ground
Off-trade channels held 50.21% market share in 2025, driven by Pick n Pay's expansion to over 300 plant-based SKUs and substantial year-on-year growth in fresh plant-based sales, yet on-trade channels will grow at 9.08% CAGR through 2026-2031 as cafes and quick-service restaurants adopt barista-grade oat and almond milks to differentiate premium beverage menus. South African cafe chains Kauai, Vida, and Seattle Coffee Company now offer plant-based lattes as standard menu items, a shift that normalizes dairy alternatives beyond health-conscious niches and into everyday consumption occasions. Flora Food Group's BlueBand Good Breakfast Programme, which reached a significant number of children in Kenya, Uganda, and Tanzania, demonstrates how institutional foodservice channels can build early-life familiarity that translates into adult purchasing behavior.
Within the off-trade, supermarkets and hypermarkets dominate due to their refrigeration infrastructure and ability to stock diverse SKUs, while convenience stores and online retail remain underdeveloped outside South Africa's urban centers. Pick'n Pay reported significant sales uplifts in stores featuring dedicated plant-based destinations versus scattered shelf placement, indicating that merchandising strategy is as critical as product assortment. Online retail penetration remains nascent, constrained by logistics costs and consumer preference for in-store product inspection, yet South Africa's functional foods retail value grew year-on-year in 2024, suggesting that e-commerce will accelerate as digital payment infrastructure and last-mile delivery networks mature. Warehouse clubs and gas stations occupy marginal share, serving impulse-purchase occasions rather than planned grocery trips.
Geography Analysis
South Africa captured 48.62% of regional revenue in 2025, anchored by Pick n Pay's expansion to over plant-based SKUs, year-on-year growth in fresh plant-based sales, and sales uplifts in stores featuring dedicated plant-based destinations. The market's relative maturity reflects 81% lactose intolerance prevalence, established cold-chain infrastructure in coastal metros, and a youth cohort exhibiting 31% plant-based dietary adoption, penetration rates that mirror early-stage adoption curves in Australia and the United Kingdom a decade prior. However, plant-based milks represent a very small percentage of the country's annual dairy consumption, versus a significant percentage in the United States, revealing a vast untapped addressable market constrained by pricing. 42% of consumers cite high cost as the primary barrier, and limited distribution beyond Johannesburg, Cape Town, and Durban.
ButtaNutt's triple-digit annual growth since 2020 and the University of the Free State's June 2024 launch of an affordable soy-based dairy range demonstrate that cost-engineered formulations can unlock mass-market penetration if brands prioritize affordability over premium positioning. South Africa's July 2025 introduction of meat-analogue labeling regulations signals regulatory maturation, yet the absence of codified plant-based dairy nomenclature creates compliance uncertainty that delays product launches. Nigeria will post the fastest geographic CAGR at 7.52% through 2026-2031, driven by 87% lactose intolerance prevalence, a median age of 18.6 years, and rapid urbanization in Lagos, Abuja, and Port Harcourt that is creating a health-conscious middle class. Flora Food Group's BlueBand Choco launch in Kenya in April 2024, which became the most successful FMCG product introduction that year, illustrates the velocity at which youth-targeted formulations can achieve scale in high-growth African markets.
However, Nigeria's cold-chain infrastructure deficit forces brands to prioritize UHT formats that degrade sensory attributes, and Tetra Pak's partnership with Wecyclers to improve post-consumer carton recycling does not address the upstream logistics gaps that prevent fresh product distribution beyond tier-1 cities. The rest of Africa, encompassing Kenya, Ghana, Egypt, Morocco, and Tanzania, exhibits heterogeneous growth patterns, with Kenya's 39% lactose intolerance rate requiring tailored strategies that prioritize taste and indulgence over functional necessity according to the National Center for Biotechnology Information.
Competitive Landscape
The Africa dairy alternatives market exhibits moderate concentration, with multinational players like Danone and Nestlé S.A. leveraging global R&D platforms and distribution networks to compete against regional specialists such as Clover and emerging precision-fermentation startups like De Novo FoodLabs, which secured ZAR 11 million in South African government grants to develop dairy-identical proteins. Strategic patterns reveal a bifurcation between multinationals pursuing premium positioning through imported formulations and local players prioritizing affordability through cost-engineered soy and coconut bases, a dynamic exemplified by the University of the Free State's June 2024 launch of an affordable soy-based dairy range targeting low-income households.
Flora Food Group's BlueBand Choco launch in Kenya in April 2024, which became the most successful FMCG product introduction that year, demonstrates that indulgent positioning can overcome the health-food stigma constraining category growth, while ButtaNutt's triple-digit annual growth since 2020 illustrates how niche brands can scale rapidly by targeting underserved segments. Opportunities center on precision fermentation and enzyme technologies that can eliminate the taste and texture gaps currently constraining cheese and dessert adoption, with De Novo FoodLabs' casein and whey protein platform representing the most advanced African effort to achieve dairy-identical functionality.
Tetra Pak's EUR 100 million annual investment in renewable and recycled resources signals that packaging suppliers are positioning themselves as sustainability partners rather than commodity vendors, a shift that creates entry barriers for smaller brands lacking capital to co-develop proprietary formats. ALPLA's EUR 60 million investment in a South African PET recycling facility producing over 35,000 tonnes annually starting early 2025 illustrates how closed-loop infrastructure is maturing to a point where regional players can compete on sustainability credentials previously dominated by European imports. Emerging disruptors include reusable packaging models like Smartfill and Gcwalisa, which are piloting deposit-return schemes in South Africa that could disrupt single-use formats if scaled beyond early-adopter segments.
Africa Dairy Alternatives Industry Leaders
-
Danone S.A.
-
Nestlé S.A.
-
Blue Diamond Growers
-
SunOpta Inc.
-
Vitasoy International Holdings Ltd
- *Disclaimer: Major Players sorted in no particular order

Recent Industry Developments
- July 2024: Giraf Macadamia, a South African player in macadamia production, launched its new range of Giraf macadamia drinks in South Africa. The product range was produced from macadamia sourced from local growers and packaged in 100% recyclable materials.
- October 2023: 260 Brands, Zambia's leading processor of corn and soy-based consumer products, celebrated a significant achievement with the inauguration of Zambia’s first plant-based milk factory at its headquarters in Lusaka. This commitment to supporting local agriculture further underscores the company’s dedication to the Zambian community.


Africa Dairy Alternatives Market Report Scope
Dairy alternatives are plant-based products designed to replace traditional dairy items like milk, cheese, and yogurt. The Africa dairy alternatives market is segmented by type, packaging type, distribution channel, and geography. By type, the market is segmented into non-dairy cheese, non-dairy milk, non-dairy yogurt, and more. By packaging type, the market is segmented into pet bottles, cans, cartons, and others. By distribution channel, the market is segmented into off-trade and on-trade. By geography, the market is segmented into Nigeria, south Africa, and more. The market forecasts are provided in terms of value (USD) and Volume (Tons).
By Type
| Non-Dairy Milk | Oat Milk |
| Hemp Milk | |
| Hazelnut Milk | |
| Soy Milk | |
| Almond Milk | |
| Coconut Milk | |
| Cashew Milk | |
| Non-Dairy Cheese | |
| Non-Dairy Desserts | |
| Non-Dairy Yogurt | |
| Others |
Packaging Type
| PET Bottles |
| Cans |
| Cartons |
| Others |
Distribution Channel
| On-trade | |
| Off-trade | Convenience Stores |
| Supermarkets and Hypermarkets | |
| On-line Retail | |
| Others |
Geography
| South Africa |
| Nigeria |
| Rest of Africa |
| By Type | Non-Dairy Milk | Oat Milk |
| Hemp Milk | ||
| Hazelnut Milk | ||
| Soy Milk | ||
| Almond Milk | ||
| Coconut Milk | ||
| Cashew Milk | ||
| Non-Dairy Cheese | ||
| Non-Dairy Desserts | ||
| Non-Dairy Yogurt | ||
| Others | ||
| Packaging Type | PET Bottles | |
| Cans | ||
| Cartons | ||
| Others | ||
| Distribution Channel | On-trade | |
| Off-trade | Convenience Stores | |
| Supermarkets and Hypermarkets | ||
| On-line Retail | ||
| Others | ||
| Geography | South Africa | |
| Nigeria | ||
| Rest of Africa | ||


Market Definition
- Dairy Alternatives - Dairy alternatives are foods that are made from plant-based milk/oils instead of their usual animal products, such as cheese, butter, milk, ice cream, yogurt, etc. Plant-based or non-dairy milk alternative is the fast-growing segment in the newer food product development category of functional and specialty beverage across the globe.
- Non-Dairy Butter - Non dairy butter is a vegan butter alternative that is made from a mixture of plant oils. With an increase in alternative diets like vegetarianism, veganism, and gluten intolerance, plant butter is a healthy non-dairy substitute for normal butter.
- Non-Dairy Ice Cream - Plant based ice cream is a growing category. Non-dairy ice cream is a type of dessert made without any animal ingredients. This is typically considered a substitute for regular ice cream for those who cannot or do not eat animal or animal-derived products, including eggs, milk, cream, or honey.
- Plant-Based Milk - Plant based milks are milk substitutes that are made from nuts (e.g., hazelnuts, hemp seeds), seeds (e.g., sesame, walnuts, coconuts, cashews, almonds, rice, oats, etc.) or legumes (e.g., soy). Plant-based milk such as soy milk and almond milk have been popular in East Asia and the Middle East for centuries.
| Keyword | Definition |
|---|---|
| Cultured Butter | Cultured butter is prepared by having the raw butter go through chemical processing and has been added with certain emulsifiers and foreign ingredients. |
| Uncultured Butter | This type of butter is one which has not been processed in any way |
| Natural Cheese | The type of cheese in its most natural form. It is made from natural and simple products and ingredients, including fresh and natural salts, natural colors, enzymes, and high-quality milk. |
| Processed Cheese | Processed cheese undergoes the same processes as natural cheese; however, it requires more steps and many different forms of ingredients. Making processed cheese involves melting natural cheese, emulsifying it, and adding preservatives and other artificial ingredients or colorings. |
| Single Cream | Single cream contains around 18% fat. It’s a single layer of cream that appears over boiled milk. |
| Double Cream | Double cream contains 48% fat, more than double the amount of fat of single cream. It’s heavier and thicker than single cream |
| Whipping Cream | This has a much higher fat percentage than single cream (36%). Used to top cakes, pies, and puddings and as a thickener for sauces, soups, and fillings. |
| Frozen Desserts | Desserts that are meant to be eaten in frozen condition. E.g., sherbets, sorbets, frozen yogurts |
| UHT Milk (Ultra-high temperature milk) | Milk heated at a very high temperature. Ultra-high-temperature processing (UHT) of milk involves heating for 1–8 sec at 135–154°C. which kills the spore-forming pathogenic microorganism, resulting in a product with a shelf-life of several months. |
| Non-dairy butter/Plant-based butter | Butter made from plant-derived oil such as coconut, palm, etc. |
| Non-dairy Yogurt | Yogurt made from typically made from nuts, like almonds, cashews, coconuts, and even other foods like soybeans, plantains, oats, and peas |
| On-trade | It refers to restaurants, QSRs, and bars. |
| Off-trade | It refers to supermarkets, hypermarkets, on-line channels, etc. |
| Neufchatel cheese | One of the oldest kinds of cheese in France. It is a soft, slightly crumbly, mold-ripened, bloomy-rind cheese made in the Neufchâtel-en-Bray region of Normandy. |
| Flexitarian | It refers to a consumer preferring a semi-vegetarian diet, that is centered on plant foods with limited or occasional inclusion of meat. |
| Lactose Intolerance | Lactose intolerance is a reaction in digestive system to lactose, the sugar in milk. It causes uncomfortable symptoms in response to the consumption of dairy products. |
| Cream Cheese | Cream cheese is a soft and creamy fresh cheese with a tangy taste made from milk and cream. |
| Sorbets | Sorbet is a frozen dessert made using ice combined with fruit juice, fruit purée, or other ingredients, such as wine, liqueur, or honey. |
| Sherbet | Sherbet is a sweetened frozen dessert made with fruit and some sort of dairy product such as milk or cream. |
| Shelf stable | Foods that can be safely stored at room temperature, or "on the shelf," for at least one year and do not have to be cooked or refrigerated to eat safely. |
| DSD | Direct Store Delivery is the process in supply chain management wherein the product is delivered from manufacturing plant directly to the retailer. |
| OU Kosher | Orthodox Union Kosher is a kosher certification agency based in New York City. |
| Gelato | Gelato is a frozen creamy dessert made with milk, heavy cream and sugar. |
| Grass-fed Cows | Grass-fed cows are allowed to graze in pastures, where they eat a variety of grasses and clover. |


Research Methodology
Mordor Intelligence follows a four-step methodology in all our reports.
- Step-1: Identify Key Variables: In order to build a robust forecasting methodology, the variables and factors identified in Step 1 are tested against available historical market numbers. Through an iterative process, the variables required for market forecast are set, and the model is built on the basis of these variables.
- Step-2: Build a Market Model: Market-size estimations for the forecast years are in nominal terms. Inflation is not a part of the pricing, and the average selling price (ASP) is kept constant throughout the forecast period for each country.
- Step-3: Validate and Finalize: In this important step, all market numbers, variables, and analyst calls are validated through an extensive network of primary research experts from the market studied. The respondents are selected across levels and functions to generate a holistic picture of the market studied.
- Step-4: Research Outputs: Syndicated Reports, Custom Consulting Assignments, Databases & Subscription Platforms


