Middle East Dairy Alternatives Market Size and Share
Market Overview
| Study Period | 2021 - 2031 |
|---|---|
| Forecast Data Period | 2026 - 2031 |
| Historical Data Period | 2021 - 2024 |
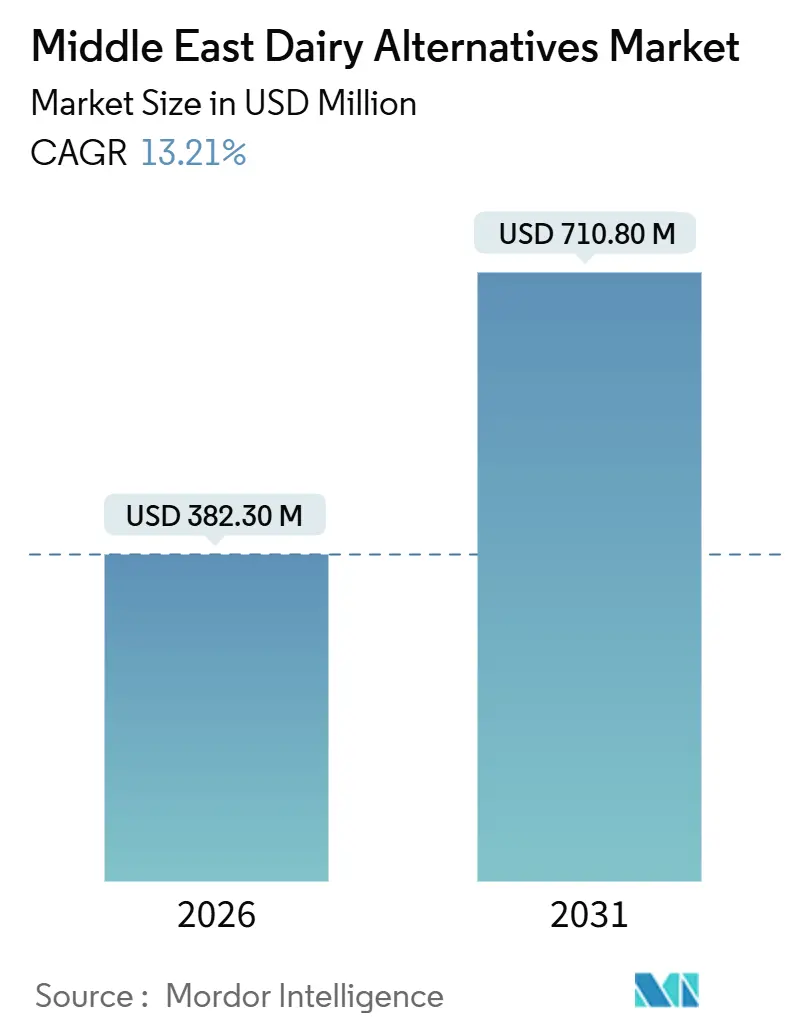
| Market Size (2026) | USD 382.30 Million |
| Market Size (2031) | USD 710.80 Million |
| Growth Rate (2026 - 2031) | 13.21% CAGR |
| Market Concentration | Low |
Major Players
*Disclaimer: Major Players sorted in no particular order Image © Mordor Intelligence. Reuse requires attribution under CC BY 4.0. |
|
Middle East Dairy Alternatives Market Analysis by Mordor Intelligence
The Middle East dairy alternatives market size reached USD 382.30 million in 2026 and is projected to attain USD 710.80 million by 2031, advancing at a 13.21% CAGR during 2026-2031. This growth is primarily driven by structural demand, as more than 70% of the Arab population experiences lactose intolerance. Additionally, sovereign food-security programs are promoting local production of plant-based ingredients. The increasing number of urban flexitarians, who link dairy-free options to wellness and sustainability, further supports this demand. Initiatives such as the UAE's National Food Security Strategy 2051 and Saudi Vision 2030 are expediting regulatory approvals, subsidizing pilot plants, and channeling venture capital into novel proteins. These efforts encourage manufacturers to expand domestic operations instead of relying on imports. Brands are focusing on innovation, offering products like date-flavored oat milk and cardamom yogurt alternatives to address the strong taste preferences for traditional items like laban and labneh. Furthermore, mandatory fortification of dairy-free products with Vitamin D, calcium, and B12 in the UAE and Saudi Arabia enhances their credibility and ensures their inclusion in public procurement and school meal programs. Simultaneously, advancements in packaging, such as aseptic cartons and lightweight aluminum cans, are addressing cold-chain limitations in Oman, Bahrain, and Kuwait. These improvements extend shelf life and geographic reach while maintaining food safety standards.
Key Report Takeaways
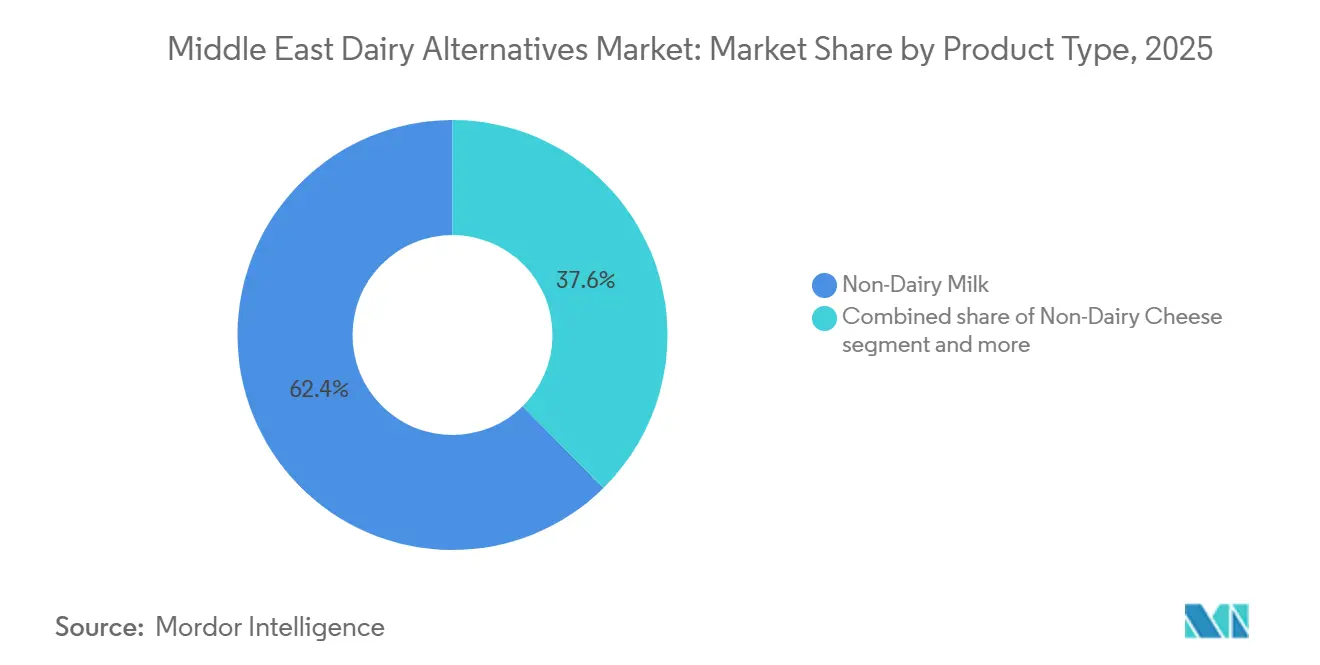
- By product type, Non-Dairy Milk held 62.39% of 2025 revenue, whereas Non-Dairy Desserts are forecast to rise at a 14.87% CAGR through 2031.
- By packaging, Cartons commanded 60.38% of 2025 sales, while Cans are expected to expand at a 13.98% CAGR through 2031.
- By distribution, Off-Trade channels captured 81.74% of the 2025 value; On-Trade outlets are poised to deliver the fastest trajectory with a 14.08% CAGR during 2026-2031.
- By country, Saudi Arabia represented 38.76% of 2025 spending, yet the United Arab Emirates is projected to post a 14.88% CAGR and outpace all other geographies to 2031.
Note: Market size and forecast figures in this report are generated using Mordor Intelligence’s proprietary estimation framework, updated with the latest available data and insights as of January 2026.
Middle East Dairy Alternatives Market Trends and Insights
Drivers Impact Analysis*
| Driver | (~) % Impact on CAGR Forecast | Geographic Relevance | Impact Timeline |
|---|---|---|---|
| High lactose-intolerance prevalence in GCC | +2.3% | GCC-wide, strongest in Saudi Arabia, UAE, Qatar | Medium term (2-4 years) |
| Rising health-conscious and flexitarian lifestyles | +2.1% | Urban centers: Dubai, Riyadh, Doha; spillover to Bahrain, Kuwait | Short term (≤ 2 years) |
| Continuous innovation in flavors and textures of dairy alternative products | +1.8% | UAE (R and D hubs), Saudi Arabia (local production), Egypt (export-oriented) | Medium term (2-4 years) |
| Fortification of products with essential nutrients | +1.5% | GCC-wide, regulatory push in UAE and Saudi Arabia | Long term (≥ 4 years) |
| Government food-security grants enabling local alt-dairy plants | +1.19% | UAE (Abu Dhabi), Saudi Arabia (NEOM, Riyadh), Qatar | Long term (≥ 4 years) |
| Growing consumer preference for natural and organic products | +1.4% | UAE, Saudi Arabia, Qatar (high-income segments) | Medium term (2-4 years) |
| Source: Mordor Intelligence | |||


High lactose-intolerance prevalence in GCC
In the Gulf region, a genetic predisposition to high lactose malabsorption rates significantly drives the demand for lactose-free and plant-based dairy alternatives. This biological limitation is further emphasized by the increasing diagnosis of lactose intolerance, a trend fueled by the expansion of healthcare access across the region. As a result, consumers are actively seeking alternatives that not only alleviate digestive discomfort but also maintain essential nutritional benefits. The impact of this shift is particularly notable in Saudi Arabia, where annual per-capita dairy consumption has traditionally exceeded 85 kilograms. This high consumption level presents a substantial opportunity for lactose-intolerant individuals to transition to plant-based options such as oat, almond, and soy milk. Additionally, in the UAE, regulatory mandates requiring the fortification of plant-based milk with Vitamin D and calcium enhance the credibility of these products as nutritionally comparable to traditional dairy, thereby reducing any perceived compromises in their adoption.
Rising health-conscious and flexitarian lifestyles
Consumers in the Middle East, particularly in Saudi Arabia, are increasingly focusing on health and wellness when making purchasing decisions. This shift is largely driven by the growing prevalence of obesity and diabetes in the Gulf region. These health challenges have led to government-led nutrition initiatives and a move by the private sector toward products that are lower in sugar, higher in protein, and plant-based. For example, in 2024, 48.6% of women aged 65-69 in Saudi Arabia were classified as obese, according to the General Authority for Statistics[1]Source: General Authority for Statistics, "Share of respondents with obesity in Saudi Arabia", stats.gov.sa. Additionally, Kuwait recorded the highest diabetes prevalence in the GCC at 25.6% in 2024, as reported by the International Diabetes Federation[2]Source: International Diabetes Federation, "IDF Diabetes Atlas - Eleventh Edition (2025)", idf.org. In response to this demand for healthier options, Almarai introduced protein-enriched dairy and plant-based SKUs in 2024, securing a significant share of the Saudi protein milk market. Moreover, the UAE's National Nutrition Strategy 2030 actively encourages balanced diets and a reduced dependence on calorie-dense animal products, supporting the adoption of dairy alternatives in school meal programs and public procurement.
Continuous innovation in flavors and textures of dairy alternative products
Flavor localization is playing a pivotal role in a region where traditional dairy products like laban, labneh, and zabadi hold deep cultural significance. Juhayna Food Industries introduced a plant-based line under its Nuts and Grains brand in 2022. In 2024, the company launched an almond Barista milk with foaming capabilities, catering to the region's thriving coffee culture and foodservice sector. To align with regional preferences, they are offering date-flavored plant-based milk and cardamom-infused yogurt alternatives. These products address the strong "taste loyalty to traditional dairy" by providing familiar flavors in plant-based formats. NÜITREE, the UAE's first dedicated plant-based factory, began operations in 2024. The company focuses on improving texture using hydrocolloids and fermentation technology to replicate the creamy mouthfeel of full-fat dairy, a key sensory attribute for Middle Eastern consumers. Additionally, King Abdullah University of Science and Technology is conducting research on seawater-adapted microalgae and controlled-environment cultivation. This research could lead to innovative protein and fat ingredients for dairy alternatives while minimizing freshwater usage.
Fortification of products with essential nutrients
The UAE requires the fortification of plant-based milk with Vitamin D, calcium, and B12 to ensure these alternatives achieve nutritional equivalence with conventional dairy. This regulation positions dairy alternatives as functional substitutes rather than niche products. Similarly, Saudi Arabia's Food and Drug Authority has introduced comparable fortification guidelines. Additionally, GCC standardization bodies are working to harmonize nutrient profiles across member states, facilitating smoother cross-border trade. Companies like Danone and Almarai have responded by incorporating Vitamin D3, calcium carbonate, and cyanocobalamin into their plant-based product lines. They prominently display these fortification claims on packaging to emphasize their equivalence to dairy milk. This strategy directly addresses a common consumer concern: the perception that plant-based alternatives lack the essential nutrients found in animal milk. Furthermore, Tanmiah Food Company's planned 2025 partnership with Big Idea Ventures highlights a focus on upstream innovation. By developing sustainable feed ingredients, they aim to explore alternative feed formulations. These innovations could reduce input costs for both conventional and plant-based dairy production, thereby supporting the economics of fortified products.
Restraints Impact Analysis*
| Restraint | (~) % Impact on CAGR Forecast | Geographic Relevance | Impact Timeline |
|---|---|---|---|
| Premium pricing versus subsidized dairy | -1.2% | GCC-wide, most acute in Saudi Arabia, Kuwait | Short term (≤ 2 years) |
| Strong taste loyalty to traditional dairy | -0.9% | Saudi Arabia, Oman, Bahrain (traditional consumption patterns) | Medium term (2-4 years) |
| Cold-chain gaps in smaller ME markets | -0.8% | Oman, Bahrain, Kuwait, Rest of Middle East | Medium term (2-4 years) |
| Halal/labelling ambiguity for novel plant proteins | -0.7% | GCC-wide, regulatory clarity needed | Short term (≤ 2 years) |
| Source: Mordor Intelligence | |||
Premium pricing versus subsidized dairy
Plant-based dairy products in GCC markets are priced 30-50% higher than conventional dairy products. This price difference stems from the region's dependence on imports, limited production volumes, and the absence of government subsidies that support traditional dairy farming. Saudi Arabia's National Center for Agriculture Technology and SALIC provide direct subsidies to conventional dairy farms, reducing retail prices for products like milk, laban, and zabadi. In contrast, plant-based alternatives incur full import duties and logistics costs. Local efforts, such as SADAFCO's oat milk launch and NÜITREE's factory in the UAE, are helping to reduce this price gap by avoiding import tariffs and lowering logistics expenses. However, achieving price parity with subsidized dairy products will require either the removal of subsidies for conventional dairy or equivalent government support for plant-based production. The UAE's "Make it in the Emirates" initiative, which offers competitive financing and energy tariffs for local manufacturers, presents a potential avenue for reducing costs.
Strong taste loyalty to traditional dairy
Traditional dairy products like laban, labneh, and zabadi are integral to Middle Eastern culinary traditions. These items are consumed daily in family meals, during religious occasions, and as accompaniments to staple dishes. Sensory attributes, particularly taste and texture, are the key purchase drivers. This highlights the need for plant-based alternatives to closely match these sensory qualities to encourage trial and repeat purchases. Flavor localization strategies, such as introducing date-flavored plant-based milk and cardamom yogurt alternatives, are gaining traction. However, consumer education and in-store sampling remain essential to overcoming initial hesitation. Additionally, the UAE's national campaigns promoting "eat fresh, buy local" and raising nutrition awareness could further drive acceptance if they include plant-based options.
*Our forecasts treat driver/restraint impacts as directional, not additive. The impact forecasts reflect baseline growth, mix effects, and variable interactions.
Segment Analysis
By Product Type: Non-Dairy Milk Retains Dominance While Desserts Accelerate
In 2025, Non-Dairy Milk represented 62.39% of the Middle East's dairy alternatives market, establishing itself as the leading option for consumers transitioning away from lactose. Oat milk drives growth in this sub-segment due to its viscosity, which is well-suited for café latte foam, and its neutral flavor, which pairs well with regional tea blends. Soy milk remains popular among cost-conscious consumers, offering a favorable protein-to-dirham ratio. On the other hand, almond milk maintains its premium positioning in wealthy urban areas. Coconut milk, while primarily niche and used in dishes like curries and desserts, experiences increased demand during Ramadan, aligning with a rise in coconut-based recipes. As fortification standards become stricter, market leaders are prominently showcasing Vitamin D, B12, and calcium levels on packaging, highlighting that achieving cow milk's nutritional equivalence is now a requirement rather than an aspiration.
Non-Dairy Desserts are projected to grow at a 14.87% CAGR, making them the fastest-growing segment, fueled by the Gulf's hot climate and high per-capita ice cream consumption. In 2024, Almarai's new ice cream SKUs incorporate coconut fat and date sugar to replicate the creamy texture associated with premium gelato. Plant-based yogurt alternatives use controlled fermentation to mimic the tang of zabadi, effectively turning traditional breakfast habits into dairy-free options. Although cheese analogs currently hold a smaller market share, they are gaining acceptance with the local availability of precision-fermented casein. By prioritizing flavor adaptation and texture authenticity, dessert formats are moving from niche vegan products to mainstream freezer staples, driving additional growth in the Middle East's dairy alternatives market.


By Packaging Type: Cartons Lead, Cans Provide Reach
In 2025, cartons accounted for 60.38% of the revenue, highlighting the effectiveness of aseptic processing in regions where temperatures often exceed 40 °C. Tetra Pak and SIG have optimized plant layouts in Jeddah and Abu Dhabi, providing manufacturers with immediate access to filling lines and recyclable board stock. The capability to ensure an extended shelf-life without refrigeration enables distributors to access traditional trade channels that generally lack reliable cold storage. While PET bottles dominate on-the-go consumption in Dubai and Doha, they remain secondary to cartons due to higher transport costs per liter.
Cans, expected to register a 13.98% CAGR, address distribution challenges in Oman, Bahrain, and Kuwait, where fragmented retail networks increase last-mile travel times. The region's aluminum recycling rate appeals to younger consumers, who associate environmental responsibility with brand value. Manufacturers accept the trade-off of “ambient-stable” cues, as it allows them to secure shelf space in mini-markets and petrol stations, which are typically inaccessible to chilled SKUs. Consequently, while cans expand their geographic reach, cartons retain their leadership in high-volume urban areas. This dynamic enables the Middle East's dairy alternatives market to serve both premium and cost-sensitive segments effectively.

By Distribution Channel: Off-Trade Dominates, On-Trade Sparks Trial
In 2025, Off-Trade venues, comprising hypermarkets, supermarkets, and online grocery platforms, accounted for a significant 81.74% share of sales, supported by the GCC's extensive modern-retail network. Retail leaders like Carrefour and Lulu are enhancing transparency by offering dedicated “plant-based ends” with QR codes that trace ingredient origins, a move that builds consumer trust and supports premium pricing. Additionally, subscription e-commerce models are leveraging this trend by delivering weekly oat-milk bundles to apartments, driven by the rise in smartphone adoption and flexible work arrangements. With increasing internet penetration, online distribution channels are witnessing significant growth. For instance, 100% of population using the Internet in United Arab Emirates and Saudi Arabia in 2024, according to the World Bank[3]Source: World Bank, "Individuals using the Internet", worldbank.org.
On-Trade channels, including cafés, hotels, and airlines, are anticipated to grow at a strong 14.08% CAGR. These venues are expanding their dairy-free menu options to cater to health-conscious residents and tourists. Barista-grade oat milk, capable of withstanding micro-foam temperatures, has become a staple in specialty coffee chains across cities like Riyadh and Muscat. Airlines such as Emirates and Saudia have started offering plant-based creamers on long-haul flights, marking a shift where dairy-free options are becoming mainstream rather than niche. Foodservice operators, aiming for differentiation and higher profit margins, are fostering the introduction of innovative SKUs. This approach not only increases consumer exposure but also enhances brand recall in the growing Middle East dairy alternatives market.
Geography Analysis
In 2025, Saudi Arabia is hold a significant 38.76% share, highlighting its position as the region's leading dairy market. This growth is driven by a rising middle class and government-supported agtech clusters that are now enabling local cultivation of oats and almonds. Domestic filling plants in Jeddah and Riyadh, combined with Almarai’s extensive daily delivery network of over 100,000 routes, are increasing the visibility of dairy-free products across traditional and modern retail outlets, including second-tier cities. Although Saudi Arabia's cold-chain network is improving, it still heavily relies on ambient-stable cartons in rural areas, emphasizing the previously discussed packaging hierarchy.
Between 2026 and 2031, the UAE is projected to grow at a strong 14.88% CAGR. This growth is supported by the UAE's transparent regulatory framework and a dynamic innovation ecosystem that integrates academic research with venture capital. Abu Dhabi's precision-fermentation pilot is a key development, producing whey analogs at a commercial scale and enabling food manufacturers to create plant-based cheeses with melting and stretching properties similar to traditional halloumi. Dubai's high concentration of specialty cafés, fitness studios, and health-food boutiques is driving consumer trials, establishing the city as a trendsetter for the broader GCC. Additionally, harmonized fortification standards across the federal emirates are simplifying interstate commerce and reducing compliance challenges for cross-emirate distribution.
Secondary markets, including Qatar, Oman, Bahrain, Kuwait, and Iran, offer growth potential but face challenges such as smaller populations, fragmented retail networks, and ongoing cold-chain limitations. However, there are positive developments: Qatar, with its enhanced logistics infrastructure post-2022 World Cup, now features temperature-controlled cargo bays that could serve as a re-export hub for chilled dairy alternatives. Oman and Bahrain are addressing last-mile refrigeration issues by utilizing aseptic cans. In Kuwait, while subsidies currently favor conventional milk, early policy discussions suggest a gradual shift in incentives to align with public health goals. Iran, despite sanctions, is experiencing growing urban demand for plant-based foods, with domestic startups innovating by using sunflower-seed bases to bypass hard-currency import restrictions. As distribution partnerships strengthen across these markets, the Middle East's dairy alternatives market is well-positioned to expand its reach beyond the two primary economies.
Competitive Landscape
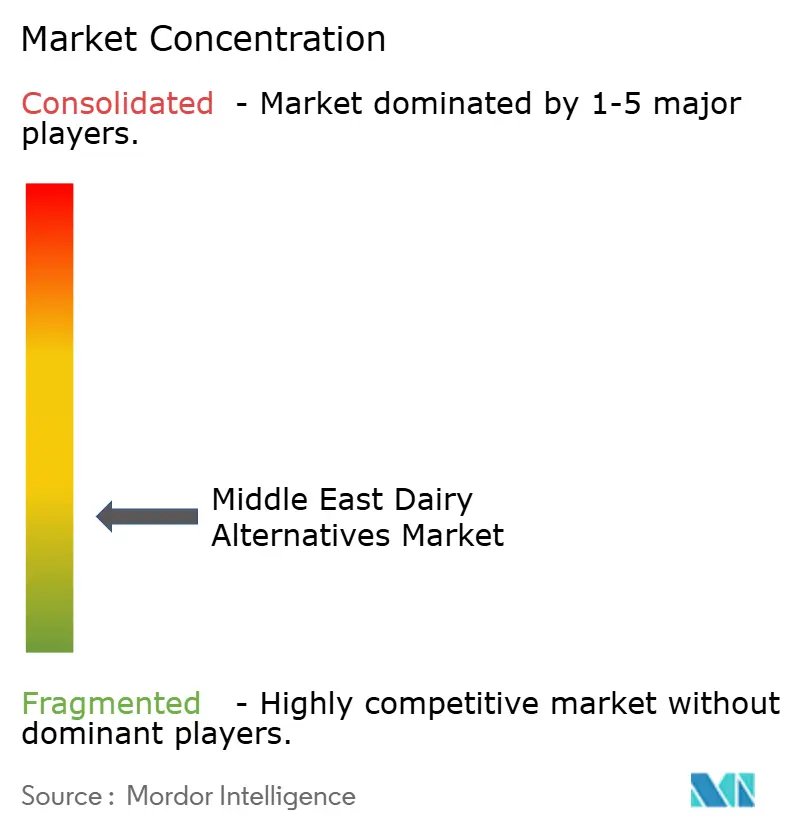
The Middle East Dairy Alternatives Market exhibits moderate fragmentation, with competition between global and regional players. Global leaders like Danone SA, Oatly Group AB, Flora Food Group, and Chobani LLC are contending with regional companies such as Almarai Company, SADAFCO, and Juhayna. At the same time, startups like Vivici and ImaginDairy are disrupting the market with precision fermentation technologies. Danone has invested USD 60 million in a Saudi facility, while Oatly has partnered with Unilever Food Solutions for distribution in the UAE. These strategies highlight efforts to establish local production and expand into the foodservice sector. Juhayna's export-driven model, which serves over 40 countries, showcases the potential of regional manufacturing hubs that benefit from lower labor costs and proximity to Middle East and North Africa markets. Opportunities for growth include flavor localization, such as date, cardamom, and saffron, as well as precision-fermented cheese analogs with authentic stretch and melt properties. Additionally, fortified products aimed at school meal programs and public procurement channels are gaining attention, particularly as UAE and Saudi regulations require nutritional equivalence with conventional dairy.
Leading players in the Middle East dairy alternatives market are focusing on innovation and expansion. Companies are introducing new plant-based dairy formulations, particularly in milk alternatives like oat, almond, and soy, while expanding their distribution networks across the region. They are demonstrating operational flexibility by investing in local manufacturing facilities and forming partnerships with regional distributors to ensure product availability and market reach. Strategic collaborations with foodservice operators, retailers, and e-commerce platforms are enhancing product accessibility. Companies are also prioritizing clean-label products, organic certifications, and sustainable packaging to meet evolving consumer demands. The competitive landscape is further shaped by strong marketing campaigns, especially in key markets like Saudi Arabia and the UAE, where companies emphasize the health and environmental benefits of their products.
Precision fermentation is becoming a transformative force in the market. Abu Dhabi has collaborated with Vivici to build a large-scale animal-free protein factory, while ImaginDairy has established a 100,000-liter fermentation facility. These developments enable local production of whey and casein analogs, eliminating the need for traditional animal agriculture. Such advancements position the Middle East as a growing hub for dairy alternatives, reducing reliance on imported ingredients and facilitating Halal certification through transparent, locally audited production processes. The region is also adopting advanced agricultural technologies. NEOM's Topian glasshouses and Pure Harvest's climate-controlled greenhouses are pioneering year-round cultivation of alternative protein crops. Additionally, King Abdullah University of Science and Technology is researching seawater-adapted microalgae, which could provide innovative protein and fat ingredients while conserving freshwater. Regulatory frameworks are advancing as well. The UAE's Ministry of Industry and Advanced Technology has introduced UAE.S 5048:2021 for novel foods, and Abu Dhabi is proposing a single-point contact for Halal certification, new food registration, and production permits, easing commercialization challenges for precision-fermented and plant-based products. Emerging players like NÜITREE, the UAE's first specialized plant-based factory, and startups in Iran and Egypt are developing culturally relevant flavors and formats to cater to traditional and price-sensitive consumers.
Middle East Dairy Alternatives Industry Leaders
-
Danone SA
-
Lactalis Group
-
Oatly Group AB
-
Chobani LLC
-
Flora Food Group
- *Disclaimer: Major Players sorted in no particular order

Recent Industry Developments
- October 2025: Vivici (formerly The Every Company) and Abu Dhabi partners announced plans to build a large-scale precision-fermentation facility in Abu Dhabi to produce animal-free dairy protein, positioning the emirate as a manufacturing hub for dairy alternatives and supporting regional supply chain resilience
- February 2024: Tres Marias has partnered with Costa Coffee to supply plant-based milk to 150 of its outlets in the UAE. The agreement, which includes a variety of oat, soya, coconut, and almond milks, is set to expand to an additional 150 Costa Coffee stores in Kuwait and Saudi Arabia.


Middle East Dairy Alternatives Market Report Scope
Dairy alternatives are plant-based, non-dairy products that mimic the taste, texture, and function of animal-derived dairy. The Middle East dairy alternatives market is segmented by product type, packaging type, distribution channel, and geography. By product type, the market is segmented into non-dairy milk, non-dairy cheese, non-dairy desserts, non-dairy yogurt, and others. The non-dairy milk segment is further segmented into oat, soy, almond, and coconut. By packaging type, the market is segmented into PET bottles, cans, cartons, and others. By distribution channel, the market is segmented into on-trade and off-trade. The off-trade segment is further segmented into convenience stores, supermarkets and hypermarkets, online retail, and others. By geography, the market is segmented into the United Arab Emirates, Qatar, Saudi Arabia, Oman, Bahrain, Iran, Kuwait, Rest of the Middle East. Market Forecasts are Provided in Value (USD Million).
| Non-Dairy Milk | Oat Milk |
| Soy Milk | |
| Almond Milk | |
| Coconut Milk | |
| Non-Dairy Cheese | |
| Non-Dairy Desserts | |
| Non-Dairy Yogurt | |
| Others |
| PET Bottles |
| Cans |
| Cartons |
| Others |
| On-trade | |
| Off-trade | Convenience Stores |
| Supermarkets and Hypermarkets | |
| On-line Retail | |
| Others (Warehouse clubs, gas stations, etc.) |
| United Arab Emirates |
| Qatar |
| Saudi Arabia |
| Oman |
| Bahrain |
| Iran |
| Kuwait |
| Rest of Middle East |
| By Product Type | Non-Dairy Milk | Oat Milk |
| Soy Milk | ||
| Almond Milk | ||
| Coconut Milk | ||
| Non-Dairy Cheese | ||
| Non-Dairy Desserts | ||
| Non-Dairy Yogurt | ||
| Others | ||
| Packaging Type | PET Bottles | |
| Cans | ||
| Cartons | ||
| Others | ||
| Distribution Channel | On-trade | |
| Off-trade | Convenience Stores | |
| Supermarkets and Hypermarkets | ||
| On-line Retail | ||
| Others (Warehouse clubs, gas stations, etc.) | ||
| Country | United Arab Emirates | |
| Qatar | ||
| Saudi Arabia | ||
| Oman | ||
| Bahrain | ||
| Iran | ||
| Kuwait | ||
| Rest of Middle East | ||


Market Definition
- Dairy Alternatives - Dairy alternatives are foods that are made from plant-based milk/oils instead of their usual animal products, such as cheese, butter, milk, ice cream, yogurt, etc. Plant-based or non-dairy milk alternative is the fast-growing segment in the newer food product development category of functional and specialty beverage across the globe.
- Non-Dairy Butter - Non dairy butter is a vegan butter alternative that is made from a mixture of plant oils. With an increase in alternative diets like vegetarianism, veganism, and gluten intolerance, plant butter is a healthy non-dairy substitute for normal butter.
- Non-Dairy Ice Cream - Plant based ice cream is a growing category. Non-dairy ice cream is a type of dessert made without any animal ingredients. This is typically considered a substitute for regular ice cream for those who cannot or do not eat animal or animal-derived products, including eggs, milk, cream, or honey.
- Plant-Based Milk - Plant based milks are milk substitutes that are made from nuts (e.g., hazelnuts, hemp seeds), seeds (e.g., sesame, walnuts, coconuts, cashews, almonds, rice, oats, etc.) or legumes (e.g., soy). Plant-based milk such as soy milk and almond milk have been popular in East Asia and the Middle East for centuries.
| Keyword | Definition |
|---|---|
| Cultured Butter | Cultured butter is prepared by having the raw butter go through chemical processing and has been added with certain emulsifiers and foreign ingredients. |
| Uncultured Butter | This type of butter is one which has not been processed in any way |
| Natural Cheese | The type of cheese in its most natural form. It is made from natural and simple products and ingredients, including fresh and natural salts, natural colors, enzymes, and high-quality milk. |
| Processed Cheese | Processed cheese undergoes the same processes as natural cheese; however, it requires more steps and many different forms of ingredients. Making processed cheese involves melting natural cheese, emulsifying it, and adding preservatives and other artificial ingredients or colorings. |
| Single Cream | Single cream contains around 18% fat. It’s a single layer of cream that appears over boiled milk. |
| Double Cream | Double cream contains 48% fat, more than double the amount of fat of single cream. It’s heavier and thicker than single cream |
| Whipping Cream | This has a much higher fat percentage than single cream (36%). Used to top cakes, pies, and puddings and as a thickener for sauces, soups, and fillings. |
| Frozen Desserts | Desserts that are meant to be eaten in frozen condition. E.g., sherbets, sorbets, frozen yogurts |
| UHT Milk (Ultra-high temperature milk) | Milk heated at a very high temperature. Ultra-high-temperature processing (UHT) of milk involves heating for 1–8 sec at 135–154°C. which kills the spore-forming pathogenic microorganism, resulting in a product with a shelf-life of several months. |
| Non-dairy butter/Plant-based butter | Butter made from plant-derived oil such as coconut, palm, etc. |
| Non-dairy Yogurt | Yogurt made from typically made from nuts, like almonds, cashews, coconuts, and even other foods like soybeans, plantains, oats, and peas |
| On-trade | It refers to restaurants, QSRs, and bars. |
| Off-trade | It refers to supermarkets, hypermarkets, on-line channels, etc. |
| Neufchatel cheese | One of the oldest kinds of cheese in France. It is a soft, slightly crumbly, mold-ripened, bloomy-rind cheese made in the Neufchâtel-en-Bray region of Normandy. |
| Flexitarian | It refers to a consumer preferring a semi-vegetarian diet, that is centered on plant foods with limited or occasional inclusion of meat. |
| Lactose Intolerance | Lactose intolerance is a reaction in digestive system to lactose, the sugar in milk. It causes uncomfortable symptoms in response to the consumption of dairy products. |
| Cream Cheese | Cream cheese is a soft and creamy fresh cheese with a tangy taste made from milk and cream. |
| Sorbets | Sorbet is a frozen dessert made using ice combined with fruit juice, fruit purée, or other ingredients, such as wine, liqueur, or honey. |
| Sherbet | Sherbet is a sweetened frozen dessert made with fruit and some sort of dairy product such as milk or cream. |
| Shelf stable | Foods that can be safely stored at room temperature, or "on the shelf," for at least one year and do not have to be cooked or refrigerated to eat safely. |
| DSD | Direct Store Delivery is the process in supply chain management wherein the product is delivered from manufacturing plant directly to the retailer. |
| OU Kosher | Orthodox Union Kosher is a kosher certification agency based in New York City. |
| Gelato | Gelato is a frozen creamy dessert made with milk, heavy cream and sugar. |
| Grass-fed Cows | Grass-fed cows are allowed to graze in pastures, where they eat a variety of grasses and clover. |


Research Methodology
Mordor Intelligence follows a four-step methodology in all our reports.
- Step-1: Identify Key Variables: In order to build a robust forecasting methodology, the variables and factors identified in Step 1 are tested against available historical market numbers. Through an iterative process, the variables required for market forecast are set, and the model is built on the basis of these variables.
- Step-2: Build a Market Model: Market-size estimations for the forecast years are in nominal terms. Inflation is not a part of the pricing, and the average selling price (ASP) is kept constant throughout the forecast period for each country.
- Step-3: Validate and Finalize: In this important step, all market numbers, variables, and analyst calls are validated through an extensive network of primary research experts from the market studied. The respondents are selected across levels and functions to generate a holistic picture of the market studied.
- Step-4: Research Outputs: Syndicated Reports, Custom Consulting Assignments, Databases & Subscription Platforms


