United States Dairy Alternatives Market Size and Share
Market Overview
| Study Period | 2021 - 2031 |
|---|---|
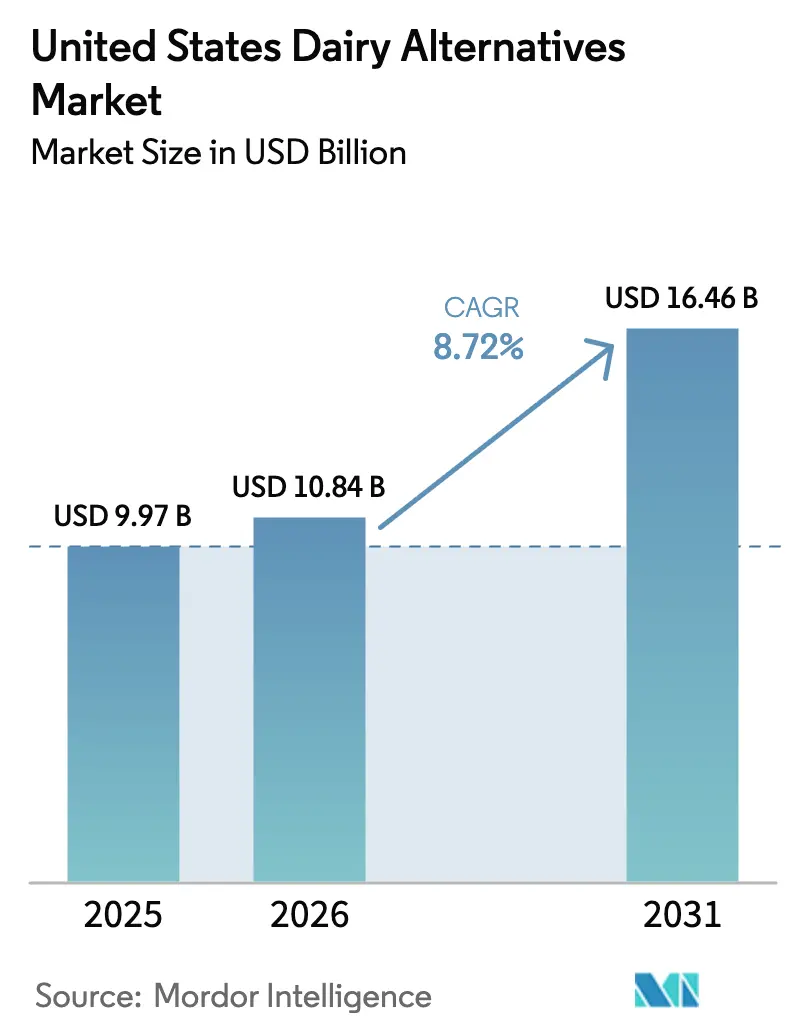
| Base Year Market Size (2025) | USD 9.97 Billion |
| Market Size (2026) | USD 10.84 Billion |
| Market Size (2031) | USD 16.46 Billion |
| Growth Rate (2026 - 2031) | 8.72% CAGR |
| Fastest Growing Market | Off-Trade |
| Largest Market | Off-Trade |
Major Players
*Disclaimer: Major Players sorted in no particular order Image © Mordor Intelligence. Reuse requires attribution under CC BY 4.0. |
|
United States Dairy Alternatives Market Analysis by Mordor Intelligence
The United States Dairy Alternatives Market size was valued at USD 9.97 billion in 2025 and estimated to grow from USD 10.84 billion in 2026 to reach USD 16.46 billion by 2031, at a CAGR of 8.72% during the forecast period (2026-2031). This growth is primarily driven by increasing health consciousness among consumers. Innovations in taste, texture, and nutritional fortification, along with expanding applications, are enhancing the appeal of dairy alternatives. The market is characterized by a dynamic innovation ecosystem focused on formulation advancements, product differentiation, and value-added nutrition, transitioning plant-based alternatives from niche products to mainstream options in American households. Market participants are leveraging fermentation technologies, clean-label ingredients, and allergen-friendly formulations to improve sensory experiences and address consumer demands for transparency and functionality. Additionally, the adoption of dairy alternatives in foodservice channels, including cafes, quick-service outlets, and restaurants, is further integrating these products into daily consumption patterns, supporting consistent market growth.
Key Report Takeaways
- By type, non-dairy milk captured 45.42% of the United States dairy alternatives market share in 2025, whereas non-dairy cheese is advancing at the fastest 10.39% CAGR through 2031.
- By flavor, unflavored variants held 67.05% share of the United States dairy alternatives market size in 2025, while flavored products are rising at an 11.34% CAGR to 2031.
- By packaging, cartons led with 60.78% of the United States dairy alternatives market share in 2025; PET bottles are expanding at a 10.29% CAGR through 2031.
- By distribution, off-trade channels represented 91.40% of the United States dairy alternatives market size in 2025, yet on-trade venues are recording a 8.98% CAGR as coffee chains adopt plant-based milk nationally
Note: Market size and forecast figures in this report are generated using Mordor Intelligence’s proprietary estimation framework, updated with the latest available data and insights as of 2026.
United States Dairy Alternatives Market Trends and Insights
Drivers Impact Analysis*
| Driver | (~) % Impact on CAGR Forecast | Geographic Relevance | Impact Timeline |
|---|---|---|---|
| Rising consumer awareness of health and wellness | +2.1% | National, with early gains in West Coast urban centers and Northeast metro areas | Medium term (2-4 years) |
| Growth of vegan, flexitarian, and plant-forward diets | +1.8% | National, strongest in California, Pacific Northwest, and Northeast; emerging in urban South | Medium term (2-4 years) |
| Clean-label and health-driven preferences | +1.5% | National, premium positioning in coastal markets, mass-market penetration in Midwest | Medium term (2-4 years) |
| Innovation in product formulations | +1.7% | National, R&D concentrated in California and Northeast innovation hubs | Long term (≥4 years) |
| Influence of social media and health influencers | +1.2% | National, Gen Z and Millennial cohorts across all regions | Short term (≤2 years) |
| Allergen-friendly product demand | +0.6% | National, higher impact in Asian American, Hispanic/Latino, and African American communities | Short term (≤2 years) |
| Source: Mordor Intelligence | |||


Rising consumer awareness of health and wellness
Increasing consumer awareness of health and wellness is a key driver for the United States Dairy Alternatives Market. Americans are increasingly opting for plant-based options, which are perceived as lower in saturated fats, cholesterol-free, and rich in essential nutrients that support digestive health, heart health, and active lifestyles. This trend is further fueled by the growing prevalence of lactose intolerance, which affects millions, and a preference for clean-label, fortified products that provide vitamins, minerals, and probiotics without the drawbacks of dairy. As a result, consumers are incorporating alternatives such as almond, oat, soy, and coconut-based products into their daily diets, including breakfast cereals and smoothies. For example, in March 2024, Tirlán introduced its Truly Gluten Free Premium Irish Oat drink, made with Irish oats, into the United States market. The Original Oat Milk is fortified with Vitamin B2, B12, D2, and Calcium, catering to health-conscious consumers seeking nutrient-dense and digestible alternatives for smoothies, cereals, or standalone consumption. This product highlights how companies are addressing wellness demands by offering verified gluten-free and lactose-free options with minimal ingredients that support immune function, bone health, and energy requirements.
Growth of vegan, flexitarian, and plant-forward diets
The growth of vegan, flexitarian, and plant-forward diets is driving the market as consumers increasingly adopt lifestyles with reduced animal product consumption. This shift is motivated by ethical concerns, environmental awareness, and health benefits, leading to higher demand for dairy alternatives that integrate seamlessly into daily meals without compromising taste or nutrition. Both committed vegans and plant-forward consumers are prioritizing cruelty-free and sustainable options, supported by the growing cultural normalization of these diets through social media influencers and wellness communities. This dietary shift is expanding market penetration beyond niche segments, with mainstream households incorporating dairy alternatives into cereals, lattes, and recipes to align with values such as animal welfare and environmental sustainability. According to the Good Food Institute, 59% of United States households purchased plant-based foods in 2024, with plant-based milk leading in household penetration [1]Source: Good Food Institute, "U.S. retail market insights for the plant-based industry", gfi.org. This data underscores how flexitarian experimentation, supported by the availability of these products in supermarkets and cafes, is driving sustained demand. Dairy alternatives benefit from high consumer loyalty as they offer versatile and flavorful options suitable for a variety of culinary uses, including smoothies and desserts.
Clean-label and health-driven preferences
Clean-label and health-focused preferences are driving the growth of the United States Dairy Alternatives Market. Consumers are increasingly prioritizing products with transparent ingredient lists that are free from artificial additives, preservatives, and synthetic stabilizers. They favor minimally processed dairy alternatives that align with wellness goals, emphasizing natural nutrition, gut health, and reduced allergen exposure. This trend is particularly prominent among health-conscious demographics who seek short, whole-food ingredient formulations fortified with vitamins and minerals, without compromising on taste or texture. In response, brands are eliminating gums, emulsifiers, and artificial flavors, opting instead for fermentation techniques and natural thickeners to achieve creamy textures that are perceived as superior for daily use. Retailers are supporting this shift by offering clean-label shelving and certifications such as Non-GMO Project Verified, enhancing accessibility and trust. This trend is further normalizing dairy alternatives over traditional dairy products, especially as scrutiny of ultra-processed foods continues to rise.
Innovation in product formulations
Innovation in product formulations is driving the Dairy Alternatives Market by improving taste, texture, and nutritional profiles. This is achieved through methods such as precision fermentation, high-protein blends, and natural emulsifiers, which enhance creaminess and meltability in dairy alternatives. These advancements address historical challenges to mainstream adoption, particularly among flexitarians seeking seamless recipe substitutions. Brands are utilizing fermentation cultures, nut-derived fats, and starch systems to improve mouthfeel, while incorporating probiotics, omega-3s, and clean carbohydrates to enhance functional appeal. For example, in November 2024, The Laughing Cow introduced a plant-based spreadable cheese product nationwide. This vegan-certified, non-GMO offering, initially available in a garlic and herb flavor, is crafted from almond milk to replicate the brand's signature creamy, spreadable texture suitable for crackers, bagels, and recipes. This launch highlights how established dairy brands are reformulating iconic products with plant proteins and natural flavors to cater to vegan consumers.
Restraints Impact Analysis*
| Restraint | (~) % Impact on CAGR Forecast | Geographic Relevance | Impact Timeline |
|---|---|---|---|
| Regulatory and labeling challenges | -0.9% | National, state-level variations in terminology enforcement | Medium term (2-4 years) |
| Supply chain vulnerabilities | -1.2% | California almond sourcing, Northern Plains oat production, national logistics | Short term (≤2 years) |
| Skepticism toward novel ingredients | -0.7% | National, stronger in rural and Midwest regions | Medium term (2-4 years) |
| Strong cultural preferences for dairy | -1.1% | Midwest dairy states, rural South, older demographic cohorts | Long term (≥4 years) |
| Source: Mordor Intelligence | |||
Regulatory and labeling challenges
Regulatory and labeling challenges hinder the growth of the United States Dairy Alternatives Market due to inconsistent federal and state regulations. Restrictions on terms such as milk, cheese, and yogurt for plant-based products create compliance challenges, increase reformulation costs, and pose legal risks for brands. Companies must navigate Food and Drug Administration (FDA) draft guidance alongside state-specific bans, such as those in Florida and Missouri, which require qualifiers like plant-based or imitation to prevent consumer confusion claims from dairy industry groups. This fragmented regulatory environment is further complicated by ongoing lawsuits and varying nutritional disclosure requirements, forcing manufacturers to develop region-specific packaging. Failure to comply can result in delisting by retailers concerned about multi-state logistics, delaying nationwide product launches, and increasing operational costs. Additionally, demands for transparency in allergen and nutrient equivalence place further strain on producers.
Supply chain vulnerabilities
Supply chain vulnerabilities hinder the growth of the United States Dairy Alternatives Market due to a heavy reliance on imported raw materials and climate-sensitive crops. Almonds, sourced primarily from California orchards, are particularly affected by droughts, wildfires, and water restrictions, which disrupt yields critical for plant-based milks. Additionally, oat sourcing faces fluctuations from global suppliers due to weather extremes and shipping delays, leading to increased costs during periods of peak shortages. Processing facilities encounter challenges with backlogs in specialized equipment, such as high-shear mixers and aseptic fillers, compounded by post-pandemic labor shortages in skilled technicians and truck drivers. Smaller brands are particularly impacted by limited supplier diversification, leaving them vulnerable to single-origin disruptions, such as California's almond dependency or Brazil's coconut export interruptions. These challenges often result in price increases or stock shortages, undermining consumer trust and allowing larger, more resilient competitors to dominate shelf space.
*Our forecasts treat driver/restraint impacts as directional, not additive. The impact forecasts reflect baseline growth, mix effects, and variable interactions.
Segment Analysis
By Type: Fermentation Technology Propels Cheese Growth
Non-dairy milk accounted for a 45.42% share of the United States Dairy Alternatives Market in 2025, driven by its versatility in beverages and food applications, broad consumer appeal through diverse varieties, and alignment with health-conscious preferences. This market leadership is supported by continuous product innovations that enhance taste, texture, and nutrient fortification. Additionally, varied product profiles catering to low-calorie, allergen-free, and specific dietary needs further strengthen its position. Significant industry investments also highlight the growing demand. For example, in June 2024, SunOpta invested USD 26 million to expand its plant-based beverage processing facility in Modesto, California. This expansion increased oat milk production capacity by over 60% through advanced processing lines, reflecting strategic efforts to meet health-driven consumer trends and improve manufacturing efficiencies, thereby reinforcing non-dairy milk's dominance in the market.
The growth of non-dairy cheese in the United States Dairy Alternatives Market is supported by expanded distribution through supermarkets, specialty health stores, and online platforms, which enhance accessibility and visibility for formats such as shreds and slices. Collaborations between manufacturers, retailers, and foodservice operators have introduced innovative menu offerings in pizzas and burgers. Clean-label and organic preferences are driving demand for non-GMO, additive-free products fortified with vitamins, minerals, and plant proteins derived from nuts, soy, coconut, and oats. Additionally, the rise of artisanal and gourmet varieties with unique flavors appeals to premium-seeking millennials and Gen Z consumers. Sustainability initiatives, including regenerative farming practices, carbon-neutral actions, and eco-friendly packaging, attract environmentally conscious buyers.


By Flavor: Functional Ingredients Drive Flavored Segment
Unflavored products accounted for a 67.05% share of the United States Dairy Alternatives Market by flavor in 2025. Their dominance is attributed to their versatile neutrality, which allows seamless integration into various applications where consumers prefer customizable bases without added sugars, artificial flavors, or overpowering tastes that may interfere with recipes. The rising demand for additive-free options in foodservice, such as barista-grade milks, further supports this trend. Key drivers of this segment's leadership include formulation innovations that enhance creamy textures and mouthfeel without masking flavors, as well as the sustainability perceptions associated with plant-based products. These factors position unflavored dairy alternatives as a preferred choice for everyday dietary use and broad household adoption, surpassing niche flavored variants.
Flavored dairy alternatives are projected to grow at an 11.34% CAGR from 2026 to 2031 in the United States Dairy Alternatives Market. This growth is driven by increasing consumer demand for indulgent yet health-conscious options such as chocolate, vanilla, and strawberry-flavored plant-based milks, yogurts, and ice creams. These products replicate familiar dairy tastes while offering vegan, low-sugar, and fortified profiles that appeal to millennials and Gen Z consumers seeking experiential variety in smoothies, desserts, and beverages. The segment's rapid expansion surpasses that of unflavored products, fueled by continuous innovation in natural flavor extracts, reduced-sugar sweeteners like stevia and monk fruit, and creamy textures derived from oat, almond, and coconut bases. These advancements enable seamless integration into foodservice settings, including cafes and Quick Service Restaurants, as well as home recipes, where bold flavors enhance enjoyment without compromising clean-label standards.
By Packaging Type: Aseptic Cartons Enable Ambient Distribution
Cartons accounted for 60.78% of the United States Dairy Alternatives Market by packaging in 2025, driven by their convenience features such as easy pourability, stackability, and portability, which cater to on-the-go consumption. This dominance is further supported by sustainability benefits, as cartons are made from renewable paperboard with minimal plastic layers, enhancing recyclability and reducing carbon footprints compared to bottles or pouches. These attributes appeal to environmentally conscious consumers, especially in light of regulatory measures like California's Sustainable Packaging for the State of California (SB 1335) . This regulation mandates the use of reusable, recyclable, or compostable food service packaging at state facilities, favoring carton designs that meet statewide recycling standards, reduce contamination, and align with existing recycling infrastructure.
PET bottles are contributing to growth in the United States Dairy Alternatives Market by addressing consumer preferences for convenience and functionality. Their resealable design allows for multiple servings while maintaining product freshness, meeting the needs of busy, on-the-go lifestyles. This feature is particularly appealing to younger demographics who frequently consume plant-based beverages outside the home, such as at work, gyms, or social settings. The lightweight, shatterproof construction of PET bottles reduces shipping costs and minimizes breakage risks compared to glass. Additionally, ergonomic grips and tamper-evident caps enhance usability in both foodservice and home settings. The crystal-clear visibility of PET bottles also highlights the appealing colors of plant-based milks, encouraging impulse purchases.

By Distribution Channel: E-Commerce Accelerates Off-Trade Dominance
Off-trade channels account for a significant 91.40% distribution share in 2025, driven by extensive networks of supermarkets, hypermarkets, convenience stores, and online platforms. These channels provide one-stop accessibility, dedicated plant-based aisles, promotional displays, and a variety of bulk options for everyday home consumption, where most usage occurs through planned shopping. Convenience stores cater to impulse purchases of single-serve almond and oat milk during non-traditional hours, while the growth of e-commerce supports personalized subscriptions, home delivery, and exclusive product launches. These services align with the preferences of busy urban consumers who prioritize pantry stocking over sporadic foodservice purchases. High repeat purchases, retailer expansions with increased shelf space, and in-store tastings encourage product trials, comparisons, and brand loyalty across categories such as yogurts, cheeses, and milks from leading brands.
On-trade channels in the United States Dairy Alternatives Market are projected to grow at a 8.98% CAGR from 2026 to 2031, driven by the increasing integration of dairy alternatives in foodservice settings. Restaurants, cafes, and quick-service outlets are standardizing dairy alternatives in their menus to cater to vegan, flexitarian, and allergen-sensitive consumers. This growth is fueled by heightened menu diversification, reflecting consumer demand for indulgent yet ethical options in high-traffic settings. Barista-grade formulations and meltable cheeses enable seamless recipe substitutions, enhancing operator profitability through premium pricing. For example, the USDA Economic Research Service reported a 12.0% increase in spending on food away from home in 2023, rising to USD 4,485 per capita from USD 4,004 in 2022 . This recovery in restaurant traffic supports the adoption of dairy alternatives, as chains like Starbucks and Chipotle expand their plant-based offerings to align with experiential dining trends.
Geography Analysis
The West Coast leads the adoption of dairy alternatives in the United States, with states such as California, Oregon, and Washington demonstrating the highest per-capita consumption and a significant concentration of innovation hubs. California stands out as both a major production center featuring almond orchards, oat-processing facilities, and precision-fermentation startups, and a progressive consumer market. This combination creates a dynamic ecosystem where supply aligns with a willingness to experiment. Urban centers like Los Angeles, San Francisco, Portland, and Seattle drive foodservice penetration, with independent cafés and health-focused restaurants serving as early-adoption venues that influence broader retail trends.
The Northeast also exhibits strong growth in dairy alternatives, supported by urban density, multicultural populations, and high disposable incomes in metropolitan areas such as New York, Boston, Philadelphia, and Washington, D.C. This region benefits from an active foodservice culture and a diverse consumer base that readily adopts innovative plant-based foods and beverages. The presence of large retail chains and specialty grocery stores enhances product availability, catering to consumers who seek variety and premium quality. The region’s culinary landscape further accelerates adoption, with both mainstream and niche market players contributing to the expansion of the dairy alternatives market.
Other regions, including the South and Midwest, are experiencing growing adoption of dairy alternatives due to increasing health awareness, changing dietary preferences, and the development of retail and foodservice infrastructures. Factors such as population growth, urbanization, and improved distribution channels enhance consumer access to these products. Targeted marketing efforts and expanded product assortments in supermarkets and local stores are fostering sustained consumer demand, gradually balancing geographic consumption patterns and supporting national market growth. Collectively, these regional dynamics highlight the diverse factors driving the evolution of the dairy alternatives market in the United States.
Competitive Landscape
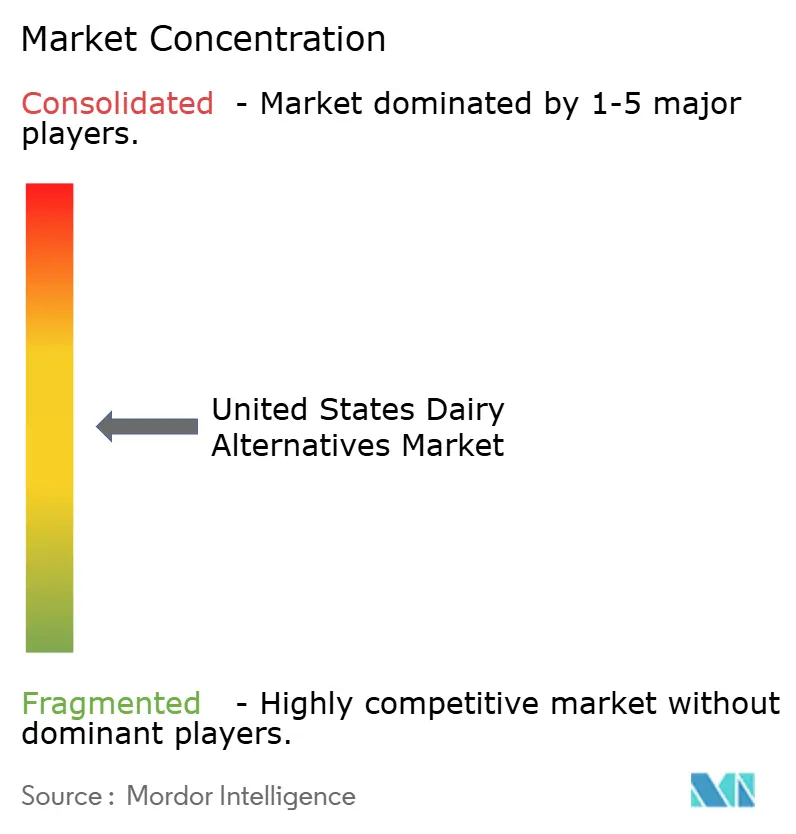
The competitive landscape of the United States dairy alternatives market is moderately concentrated, with key players including Blue Diamond Growers, Califia Farms LLC, Oatly Group AB, Danone SA, and Campbell Soup Company. These companies maintain strong market positions through strategies such as capacity expansion, product innovation, and technological advancements. Significant investments in Research and Development (R&D) are directed toward improving taste, nutritional profiles, and sustainable packaging. Additionally, they continue to expand their product portfolios, offering milk alternatives, yogurts, cheeses, and creamers to cater to diverse consumer groups, including vegans and individuals with lactose intolerance.
Strategic efforts by these market leaders focus on geographic expansion to capture growth opportunities beyond traditional urban centers. Capacity expansion projects are being implemented to scale production and meet increasing demand, with advanced processing technologies like precision fermentation being utilized to enhance product quality and variety. Furthermore, companies are forming partnerships and joint ventures to optimize supply chains and distribution networks, ensuring broader availability of their products through both retail and foodservice channels.
A notable example of such collaboration is the long-term hybrid partnership established in January 2023 between Oatly Group AB and Ya Ya Foods Corporation in North America. Under this agreement, Oatly continues producing its proprietary oat base at facilities in Ogden, Utah, and Fort Worth, Texas, while leveraging Ya Ya Foods' distribution and operational expertise. This partnership highlights the market's focus on combining production and distribution strengths to drive growth and innovation, enabling companies to sustain competitive advantages in a rapidly evolving market.
United States Dairy Alternatives Industry Leaders
-
Blue Diamond Growers
-
Califia Farms LLC
-
Oatly Group AB
-
Danone SA
-
Campbell Soup Company
- *Disclaimer: Major Players sorted in no particular order

Recent Industry Developments
- November 2025: Danone unveiled a high-protein variant of its Silk brand, named Silk Protein, which provides 13 grams of complete plant protein per serving. The drink contains 3 grams of fiber and does not include artificial sweeteners.
- May 2025: The Forager Project introduced its Unsweetened Plain Greek-Style Yogurt, offering 10 grams of protein per serving. The product offers a thick, creamy texture typically associated with Greek yogurt, without containing dairy, added sugar, or fillers.
- January 2025: RIND by Dina & Joshua introduced ALPINE SVVISS, a cashew-based vegan cheese. The product is gluten-free, cholesterol-free, and certified Kosher Pareve.
- January 2024: Oatly introduced two new oat milk varieties in the United States. The Oatly Unsweetened Oatmilk contains zero grams of sugar and provides 40 kcal per serving. The Oatly Super Basic Oatmilk is made with only four ingredients: water, oats, sea salt, and citrus zest fiber.


United States Dairy Alternatives Market Report Scope
Non-Dairy Butter, Non-Dairy Cheese, Non-Dairy Ice Cream, Non-Dairy Milk, Non-Dairy Yogurt are covered as segments by Category. Off-Trade, On-Trade are covered as segments by Distribution Channel.| Non-Dairy Milk | Oat Milk |
| Hemp Milk | |
| Hazelnut Milk | |
| Soy Milk | |
| Almond Milk | |
| Coconut Milk | |
| Cashew Milk | |
| Non-Dairy Cheese | |
| Non-Dairy Desserts | |
| Non-Dairy Yogurt | |
| Others |
| Flavored |
| Unflavored |
| PET Bottles |
| Cans |
| Cartons |
| Others |
| On-trade | |
| Off-trade | Convenience Stores |
| Supermarkets and Hypermarkets | |
| On-line Retail | |
| Others (Warehouse clubs, gas stations, etc.) |
| By Type | Non-Dairy Milk | Oat Milk |
| Hemp Milk | ||
| Hazelnut Milk | ||
| Soy Milk | ||
| Almond Milk | ||
| Coconut Milk | ||
| Cashew Milk | ||
| Non-Dairy Cheese | ||
| Non-Dairy Desserts | ||
| Non-Dairy Yogurt | ||
| Others | ||
| By Flavor | Flavored | |
| Unflavored | ||
| By Packaging Type | PET Bottles | |
| Cans | ||
| Cartons | ||
| Others | ||
| By Distribution Channel | On-trade | |
| Off-trade | Convenience Stores | |
| Supermarkets and Hypermarkets | ||
| On-line Retail | ||
| Others (Warehouse clubs, gas stations, etc.) | ||


Market Definition
- Dairy Alternatives - Dairy alternatives are foods that are made from plant-based milk/oils instead of their usual animal products, such as cheese, butter, milk, ice cream, yogurt, etc. Plant-based or non-dairy milk alternative is the fast-growing segment in the newer food product development category of functional and specialty beverage across the globe.
- Non-Dairy Butter - Non dairy butter is a vegan butter alternative that is made from a mixture of plant oils. With an increase in alternative diets like vegetarianism, veganism, and gluten intolerance, plant butter is a healthy non-dairy substitute for normal butter.
- Non-Dairy Ice Cream - Plant based ice cream is a growing category. Non-dairy ice cream is a type of dessert made without any animal ingredients. This is typically considered a substitute for regular ice cream for those who cannot or do not eat animal or animal-derived products, including eggs, milk, cream, or honey.
- Plant-Based Milk - Plant based milks are milk substitutes that are made from nuts (e.g., hazelnuts, hemp seeds), seeds (e.g., sesame, walnuts, coconuts, cashews, almonds, rice, oats, etc.) or legumes (e.g., soy). Plant-based milk such as soy milk and almond milk have been popular in East Asia and the Middle East for centuries.
| Keyword | Definition |
|---|---|
| Cultured Butter | Cultured butter is prepared by having the raw butter go through chemical processing and has been added with certain emulsifiers and foreign ingredients. |
| Uncultured Butter | This type of butter is one which has not been processed in any way |
| Natural Cheese | The type of cheese in its most natural form. It is made from natural and simple products and ingredients, including fresh and natural salts, natural colors, enzymes, and high-quality milk. |
| Processed Cheese | Processed cheese undergoes the same processes as natural cheese; however, it requires more steps and many different forms of ingredients. Making processed cheese involves melting natural cheese, emulsifying it, and adding preservatives and other artificial ingredients or colorings. |
| Single Cream | Single cream contains around 18% fat. It’s a single layer of cream that appears over boiled milk. |
| Double Cream | Double cream contains 48% fat, more than double the amount of fat of single cream. It’s heavier and thicker than single cream |
| Whipping Cream | This has a much higher fat percentage than single cream (36%). Used to top cakes, pies, and puddings and as a thickener for sauces, soups, and fillings. |
| Frozen Desserts | Desserts that are meant to be eaten in frozen condition. E.g., sherbets, sorbets, frozen yogurts |
| UHT Milk (Ultra-high temperature milk) | Milk heated at a very high temperature. Ultra-high-temperature processing (UHT) of milk involves heating for 1–8 sec at 135–154°C. which kills the spore-forming pathogenic microorganism, resulting in a product with a shelf-life of several months. |
| Non-dairy butter/Plant-based butter | Butter made from plant-derived oil such as coconut, palm, etc. |
| Non-dairy Yogurt | Yogurt made from typically made from nuts, like almonds, cashews, coconuts, and even other foods like soybeans, plantains, oats, and peas |
| On-trade | It refers to restaurants, QSRs, and bars. |
| Off-trade | It refers to supermarkets, hypermarkets, on-line channels, etc. |
| Neufchatel cheese | One of the oldest kinds of cheese in France. It is a soft, slightly crumbly, mold-ripened, bloomy-rind cheese made in the Neufchâtel-en-Bray region of Normandy. |
| Flexitarian | It refers to a consumer preferring a semi-vegetarian diet, that is centered on plant foods with limited or occasional inclusion of meat. |
| Lactose Intolerance | Lactose intolerance is a reaction in digestive system to lactose, the sugar in milk. It causes uncomfortable symptoms in response to the consumption of dairy products. |
| Cream Cheese | Cream cheese is a soft and creamy fresh cheese with a tangy taste made from milk and cream. |
| Sorbets | Sorbet is a frozen dessert made using ice combined with fruit juice, fruit purée, or other ingredients, such as wine, liqueur, or honey. |
| Sherbet | Sherbet is a sweetened frozen dessert made with fruit and some sort of dairy product such as milk or cream. |
| Shelf stable | Foods that can be safely stored at room temperature, or "on the shelf," for at least one year and do not have to be cooked or refrigerated to eat safely. |
| DSD | Direct Store Delivery is the process in supply chain management wherein the product is delivered from manufacturing plant directly to the retailer. |
| OU Kosher | Orthodox Union Kosher is a kosher certification agency based in New York City. |
| Gelato | Gelato is a frozen creamy dessert made with milk, heavy cream and sugar. |
| Grass-fed Cows | Grass-fed cows are allowed to graze in pastures, where they eat a variety of grasses and clover. |


Research Methodology
Mordor Intelligence follows a four-step methodology in all our reports.
- Step-1: Identify Key Variables: In order to build a robust forecasting methodology, the variables and factors identified in Step 1 are tested against available historical market numbers. Through an iterative process, the variables required for market forecast are set, and the model is built on the basis of these variables.
- Step-2: Build a Market Model: Market-size estimations for the forecast years are in nominal terms. Inflation is not a part of the pricing, and the average selling price (ASP) is kept constant throughout the forecast period for each country.
- Step-3: Validate and Finalize: In this important step, all market numbers, variables, and analyst calls are validated through an extensive network of primary research experts from the market studied. The respondents are selected across levels and functions to generate a holistic picture of the market studied.
- Step-4: Research Outputs: Syndicated Reports, Custom Consulting Assignments, Databases & Subscription Platforms


