Saudi Arabia Dairy Alternatives Market Size and Share
Market Overview
| Study Period | 2021 - 2031 |
|---|---|
| Forecast Data Period | 2026 - 2031 |
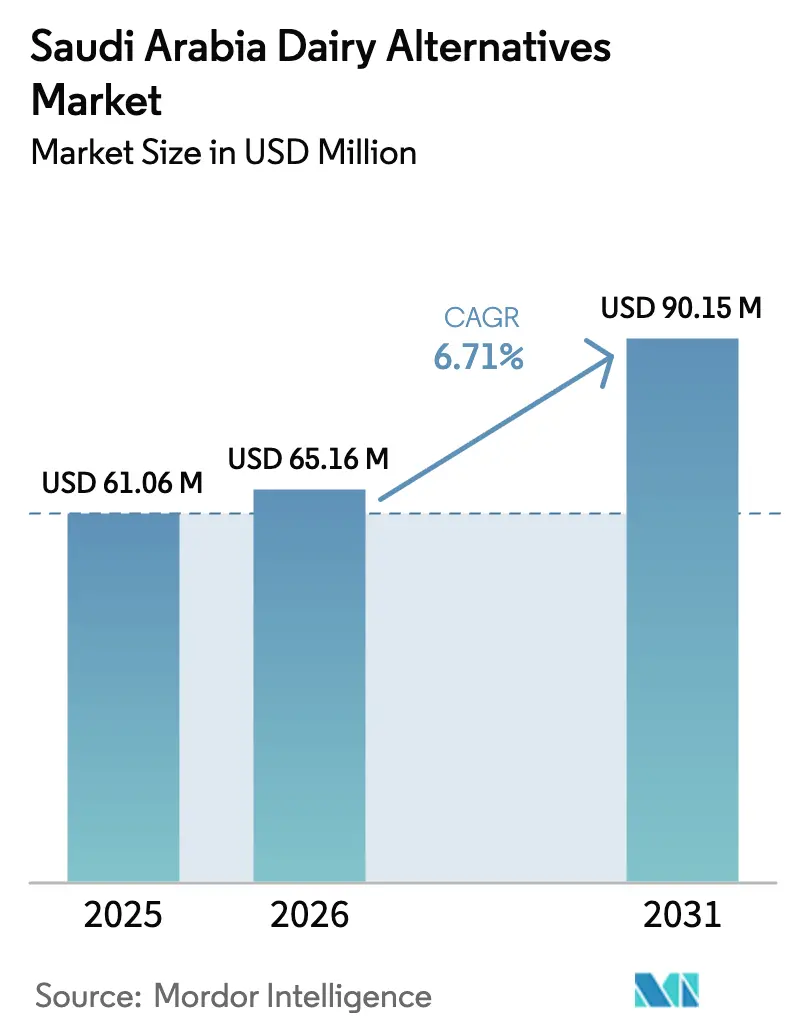
| Base Year Market Size (2025) | USD 61.06 Million |
| Market Size (2026) | USD 65.16 Million |
| Market Size (2031) | USD 90.15 Million |
| Growth Rate (2026 - 2031) | 6.71% CAGR |
| Market Concentration | Medium |
Major Players
*Disclaimer: Major Players sorted in no particular order Image © Mordor Intelligence. Reuse requires attribution under CC BY 4.0. |
|
Saudi Arabia Dairy Alternatives Market Analysis by Mordor Intelligence
The Saudi Arabia dairy alternatives market size was valued at USD 61.06 million in 2025 and estimated to grow from USD 65.16 million in 2026 to reach USD 90.15 million by 2031, at a CAGR of 6.71% during the forecast period (2026-2031). Rising lactose intolerance, policy-backed health awareness, and expanding modern retail underpin consistent demand even as conventional dairy remains price-competitive. Incumbent dairy processors leverage built-out cold chains to place plant-based lines next to traditional products, accelerating shelf visibility. Simultaneously, Vision 2030 investments in food parks and a 1 million m² dairy cluster lower future production costs for precision-fermented proteins, encouraging local manufacture. On-the-go lifestyles propel PET bottles, while e-commerce subscriptions broaden reach beyond the Kingdom’s urban core. Together, these forces keep the Saudi Arabia dairy alternatives market on a steady uptrend despite lingering taste- and price-related headwinds.
Key Report Takeaways
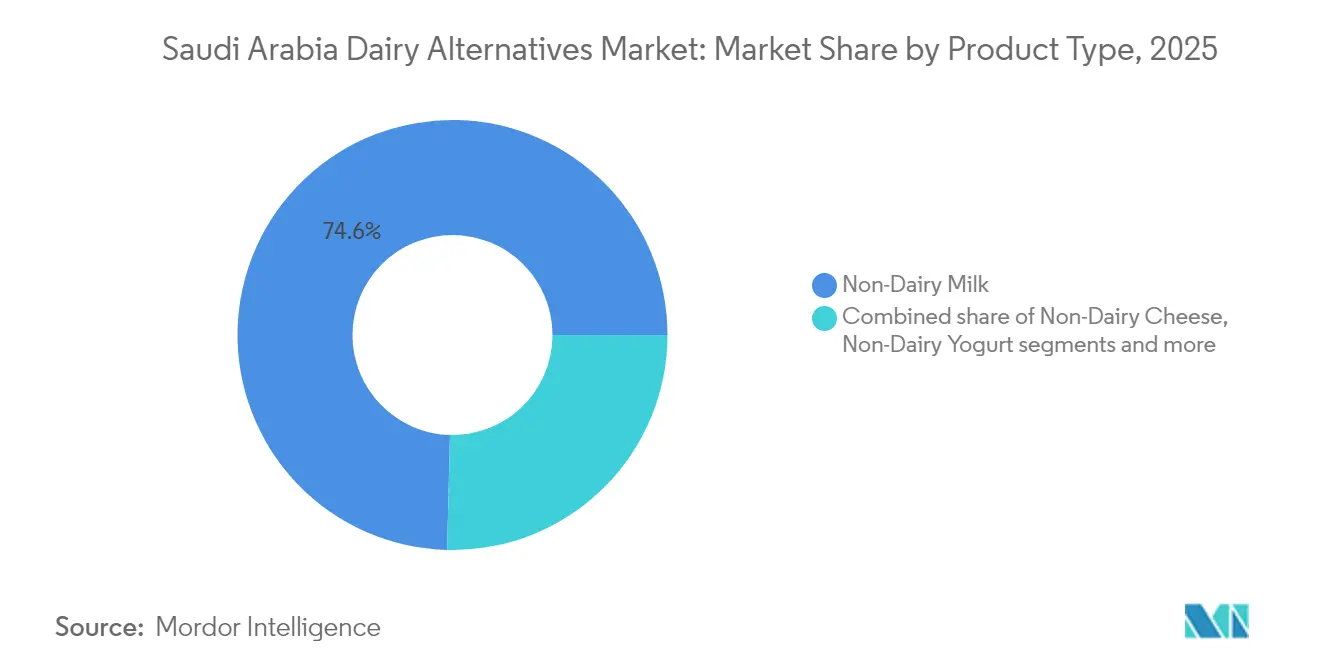
- By product type, non-dairy milk held 74.60% of the Saudi Arabia dairy alternatives market share in 2025, whereas non-dairy cheese is forecast to post the fastest 7.05% CAGR to 2031.
- By packaging type, cartons led with 52.80% revenue share in 2025; PET bottles are set to expand at a 7.18% CAGR through 2031.
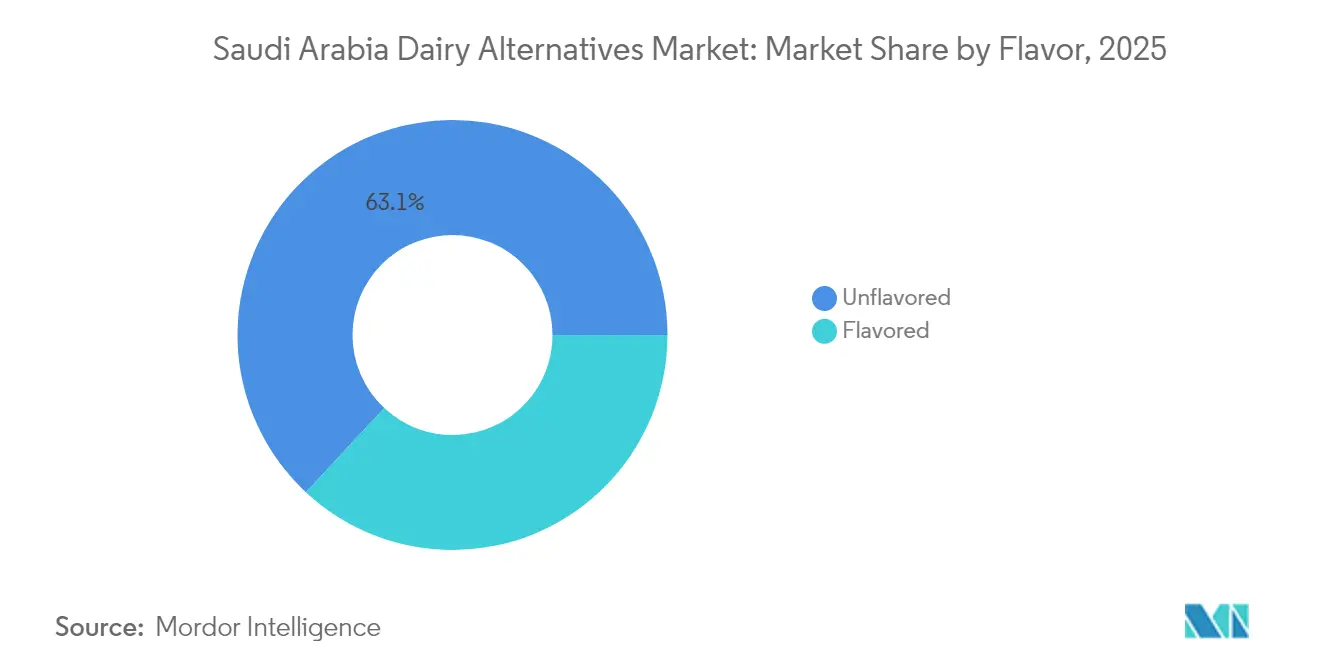
- By flavor, unflavored variants accounted for 63.05% of the Saudi Arabia dairy alternatives market size in 2025, while flavored products are advancing at 7.23% CAGR to 2031.
- By distribution channel, off-trade contributed 79.70% revenue in 2025, whereas on-trade is projected to grow at 6.78% CAGR to 2031.
Note: Market size and forecast figures in this report are generated using Mordor Intelligence’s proprietary estimation framework, updated with the latest available data and insights as of 2026.
Saudi Arabia Dairy Alternatives Market Trends and Insights
Drivers Impact Analysis*
| Driver | (~) % Impact on CAGR Forecast | Geographic Relevance | Impact Timeline |
|---|---|---|---|
| Rising prevalence of lactose intolerance | +1.2% | National, with higher urban concentration | Medium term (2-4 years) |
| Increasing vegan and flexitarian population | +0.8% | Urban centers, expatriate communities | Long term (≥ 4 years) |
| Health and sustainability awareness | +1.5% | National, driven by Vision 2030 initiatives | Medium term (2-4 years) |
| Health benefits like lower fat/calories and cholesterol | +1.1% | National, particularly health-conscious demographics | Short term (≤ 2 years) |
| Diverse product innovation in almond, soy, oat, coconut | +0.9% | National, with premium segment focus | Medium term (2-4 years) |
| Expansion in foodservice/menu space dedicated to plant-based | +0.7% | Urban centers, hospitality sector | Short term (≤ 2 years) |
| Source: Mordor Intelligence | |||


Rising prevalence of lactose intolerance
In Saudi Arabia, a rising number of individuals are grappling with lactose intolerance, significantly propelling the country's dairy alternatives market. As digestive discomfort linked to lactose becomes more prevalent, many Saudis are turning to plant-based substitutes, including almond, soy, oat, and coconut milk. This shift is driven not only by health concerns but also by an increasing preference for products that align with dietary restrictions and lifestyle choices. Heightened awareness about digestive health, coupled with improved diagnoses and public education on lactose intolerance, is further fueling this transition. Consequently, there's a surging demand for dairy-free beverages, yogurts, and cheeses, which are perceived as healthier and more suitable options for lactose-intolerant individuals. In response, manufacturers and retailers across Saudi Arabia are expanding their portfolios, introducing high-quality, fortified dairy-alternative products to meet the needs of this growing consumer segment and capitalize on the evolving market dynamics.
Increasing vegan and flexitarian population
The growing vegan and flexitarian population in Saudi Arabia is becoming a key driver of the country’s dairy alternatives market. As more consumers adopt plant-forward lifestyles whether for health, ethical, or environmental reasons the demand for non-dairy options such as plant-based milks, yogurts, and cheeses continues to rise. Flexitarian consumers, in particular, are not fully eliminating animal products but are intentionally reducing their consumption, which significantly broadens the potential customer base for dairy alternatives. This shift is further supported by increasing global exposure, social media influence, and a wider availability of high-quality plant-based products across retail channels. Consequently, manufacturers and foodservice operators are expanding their dairy-free offerings to cater to this rapidly evolving consumer preference.
Health and sustainability awareness
Growing health and sustainability awareness is a key driver of the Saudi Arabia dairy alternatives market, as consumers increasingly seek products that support both personal well-being and environmental responsibility. Rising incidences of lactose intolerance, lifestyle-related health concerns, and a shift toward balanced diets are encouraging many Saudis to explore plant-based milk, yogurt, and cheese as nutritious, lower-cholesterol options. Consumer research reveals health motivation drives 91.99% of sustainable diet interest, significantly outweighing environmental concerns at 17.73%, suggesting successful positioning requires health-first messaging with sustainability as a secondary benefit [1]Source: Frontiers, "Generational perspectives on sustainable diets in Saudi Arabia: implications for food security and behavioral change", frontiersin.org. At the same time, greater public focus on sustainability—driven by national initiatives like Saudi Vision 2030 has elevated interest in products with lower carbon footprints and reduced resource consumption compared to traditional dairy. As a result, health-conscious and eco-aware consumers are fueling strong demand for dairy alternatives across retail and foodservice channels in the Kingdom.
Health benefits like lower fat/calories and cholesterol
Health benefits such as lower fat, fewer calories, and reduced cholesterol content are major factors driving the growth of the Saudi Arabia dairy alternatives market. As consumers become more mindful of diet-related health issues such as obesity, heart disease, and high cholesterol they are increasingly turning to plant-based milk, yogurt, and cheese as healthier substitutes for traditional dairy. According to the General Authority for Statistics, adult obesity rates in 2024 stand at 22.8% for males and 23.5% for females, with an overweight prevalence of 45.1% [2]Source: General Authority for Statistics, "Health Determinants Statistics Publication 2024", stats.gov.sa. This surge in obesity and overweight statistics highlights the increasing burden of lifestyle-related diseases, which are often linked to poor dietary habits and sedentary lifestyles. Many dairy alternative products offer naturally lower saturated fat levels and are often fortified with essential nutrients, making them appealing to individuals seeking lighter, more nutritious options without compromising taste or functionality. This shift toward healthier consumption habits continues to boost demand for dairy alternatives across the Kingdom. Moreover, the Saudi Food and Drug Authority's new nutritional labeling requirements, effective July 2025, mandate comprehensive nutrient disclosure that will highlight these health advantages on product packaging[3]Source: GCC Standardization Organization (GSO), "Requirements of nutritional labelling", istitlaa.ncc.gov.sa.
Restraints Impact Analysis*
| Restraint | (~) % Impact on CAGR Forecast | Geographic Relevance | Impact Timeline |
|---|---|---|---|
| Higher price points than conventional dairy | -1.8% | National, particularly price-sensitive segments | Short term (≤ 2 years) |
| Limited consumer awareness in rural areas | -1.2% | Rural regions, traditional communities | Long term (≥ 4 years) |
| Taste and texture lag vs traditional dairy | -1.0% | National, across all demographics | Medium term (2-4 years) |
| Allergies to nuts or soy, restricting choices | -0.6% | National, particularly urban areas with higher allergy awareness | Medium term (2-4 years) |
| Source: Mordor Intelligence | |||
Higher price points than conventional dairy
The dairy alternatives market in Saudi Arabia faces a notable challenge due to higher price points compared to conventional dairy products. Producers of plant-based milks, yogurts, and cheeses incur higher costs because they source premium raw materials such as almonds, oats, and soy. They also rely on advanced technologies to create the desired textures and flavors, which further drives up production and processing expenses. These elevated prices significantly limit the accessibility of dairy alternatives for price-sensitive consumers, particularly in a market where traditional dairy products are widely available and competitively priced. This pricing disparity often discourages even health-conscious consumers from fully transitioning to plant-based options. Consequently, the market struggles to achieve broader penetration and growth across the Kingdom, as affordability remains a critical factor influencing consumer choices.
Limited consumer awareness in rural areas
The Saudi Arabia dairy alternatives market faces significant challenges due to limited consumer awareness in rural areas. Urban centers have actively embraced plant-based trends, driven by the increasing presence of modern retail outlets, widespread digital media campaigns, and growing health-conscious initiatives. These efforts have successfully introduced urban consumers to the nutritional and environmental benefits of dairy alternatives. However, rural communities remain largely unfamiliar with these products, creating a significant gap in market penetration. The lack of product availability in rural regions, coupled with minimal promotional activities and restricted access to specialty retail channels, further exacerbates this issue. Companies operating in the market struggle to extend their reach beyond major cities, where the adoption of dairy alternatives remains concentrated. This urban-centric adoption pattern continues to hinder the market's broader nationwide growth and slows its overall expansion potential.
*Our forecasts treat driver/restraint impacts as directional, not additive. The impact forecasts reflect baseline growth, mix effects, and variable interactions.
Segment Analysis
By Product Type: Non-Dairy Milk Dominates Innovation Pipeline
Non-dairy milk accounted for 74.60% of the Saudi Arabia dairy alternatives market in 2025, firmly positioning it as the core volume and value driver within the category. Its dominance stems from early market entry, strong overlap with existing cow’s milk usage occasions, and high consumer familiarity with liquid dairy substitutes in beverages, breakfast, and cooking. Consumers perceive plant-based milks as an easy, low-risk switch that delivers clear benefits around lactose-free, lower-fat, and “better-for-you” positioning without major behavior change. Wide availability across supermarkets, hypermarkets, convenience stores, and online channels further entrenches its leadership, as retailers dedicate more shelf space and run frequent promotions on leading non-dairy milk brands. Continuous innovation in almond, oat, soy, and blended milks, including fortified and flavored variants, keeps the segment relevant for both health-conscious and lifestyle-driven consumers.
Non-dairy cheese is emerging as the fastest-growing segment, with a projected CAGR of 7.05% through 2031, signaling increasing consumer openness to more sophisticated dairy substitutes beyond milk. This acceleration reflects improving product quality, as advances in formulations and ingredients help narrow historical gaps in taste, texture, and meltability that once limited adoption in traditional Saudi and international dishes. Rising experimentation among flexitarian, vegan, and lactose-intolerant consumers especially in urban centers supports trial of plant-based cheese slices, shreds, and spreads in home cooking, sandwiches, and foodservice menus. Greater visibility of non-dairy cheese in modern retail, specialty stores, and cafés also normalizes its use and encourages cross-purchasing from existing non-dairy milk shoppers. As manufacturers localize flavors and invest in clean-label, fortified, and premium-positioned offerings, non-dairy cheese moves from niche to a credible complement within the broader dairy basket.


By Packaging Type: Cartons Lead Amid Sustainability Shift
Cartons account for 52.80% of Saudi Arabia’s dairy alternatives packaging market in 2025, making them the dominant primary format across retail channels. Their leadership is underpinned by strong consumer familiarity from long-standing use in dairy and juice, which reduces perceived risk when trying plant-based products. Cartons offer cost-efficient packaging and transportation, supporting competitive pricing in a category that still commands a premium over conventional dairy. Their excellent shelf-stability aligns well with Saudi Arabia’s hot climate and long-distance distribution requirements, particularly for ambient plant-based milks moving through hypermarkets, supermarkets, and e-commerce fulfillment centers. The format also fits with retailer preferences for space-efficient, stackable packs that enable broad assortment on shelf.
PET bottles are projected to be the fastest-growing packaging segment, with an expected CAGR of 7.18% through 2031, reflecting evolving consumption behavior and premium positioning within the category. Growth is driven by on-the-go lifestyles among urban professionals and younger consumers, who favor resealable, durable formats for consumption in transit, at work, or at gyms. PET supports premiumization strategies, with brands using clear bottles, distinctive shapes, and elevated graphics to signal higher quality, functional benefits, and indulgent flavors. This format also aligns well with café, QSR, and convenience channels, where chilled single-serve plant-based beverages are gaining space in grab-and-go coolers. As health-focused and protein-enriched dairy alternatives grow, PET bottles become a natural vehicle for positioning them closer to functional beverages and smoothies.
By Flavor: Unflavored Preference Signals Versatility Demand
Unflavored dairy alternatives command 63.05% of the Saudi Arabian market in 2025, underscoring their role as the core, everyday choice for households seeking direct substitutes for conventional dairy. These products appeal strongly because they can be used seamlessly in tea, coffee, cooking, and baking without introducing additional taste notes that might conflict with local recipes. Their neutral profile makes them especially suitable for family consumption, where multiple stakeholders share the same product across varied applications. Unflavored variants also align well with health-conscious consumers who want to avoid added sugars, flavors, and colors while still accessing plant-based benefits. This positioning supports higher repeat purchase rates, as shoppers treat unflavored products as pantry staples rather than occasional treats. As a result, unflavored dairy alternatives serve as the primary volume driver of category penetration and help normalize plant-based options within mainstream Saudi diets.
Flavored dairy alternatives are projected to grow at a robust 7.23% CAGR through 2031, highlighting their role as the innovation and value-accretive engine of the category. This segment resonates particularly with younger consumers and urban professionals who seek indulgent, café-style experiences and are more willing to trade up for taste, variety, and differentiated positioning. Flavored offerings ranging from vanilla and chocolate to more experimental profiles help plant-based products move beyond pure “substitution” into lifestyle and occasion-based consumption. Brand owners use this segment to implement premium pricing, layered health claims, and limited-edition or seasonal launches that create excitement on shelf. These products also perform strongly in on-the-go and foodservice channels, where flavor becomes a key driver of impulse purchases.
By Distribution Channel: Off-Trade Dominance Amid Digital Transformation
Off-trade channels account for 79.70% of Saudi Arabia’s dairy alternatives sales in 2025, firmly positioning retail as the dominant route to market. This leadership reflects deeply ingrained consumer habits of purchasing dairy and dairy-like products during routine grocery trips, particularly in supermarkets and hypermarkets. These modern formats offer broad brand assortments, regular promotions, and trusted quality standards, which reduce the perceived risk of trial for newer plant-based products. Established cold chain and ambient distribution infrastructure in large retail chains also ensures consistent product availability and integrity across major cities and secondary towns. Within off-trade, growth is further supported by the rapid expansion of e-commerce and convenience stores, which add reach and convenience to the traditional hypermarket backbone. As plant-based options become more integrated into mainstream dairy shelves, off-trade channels will continue to anchor volume and household penetration for dairy alternatives.
On-trade channels are projected to grow at a CAGR of 6.78% through 2031, making foodservice a key growth engine for the Saudi dairy alternatives market despite its smaller current base. Restaurants, cafés, and specialty coffee chains increasingly incorporate plant-based milks, cheeses, and creams into beverages and menu items, exposing consumers to these products in trusted, experiential settings. This trend is reinforced by corporate wellness and ESG agendas that encourage the inclusion of plant-based options in workplace cafeterias, hospitals, universities, and hospitality venues. Younger, urban consumers and expatriates are particularly receptive to such offerings, viewing them as part of a modern, health-conscious lifestyle rather than purely functional substitutes. As more operators introduce plant-based “swaps” and co-brand with leading dairy-alternative manufacturers, on-trade becomes a powerful trial and education channel that can later translate into off-trade purchases.
Geography Analysis
In Saudi Arabia, major metropolitan areas like Riyadh, Jeddah, and Dammam dominate the dairy alternatives market. These cities boast strong purchasing power, a deep penetration of modern retail, and a keen exposure to global food trends. The northern and central regions, anchored by Riyadh, along with the western corridor near Jeddah and the holy cities, showcase a pronounced preference for plant-based milks and related products. This trend is fueled by dense populations of young, educated consumers and expatriates. Supermarkets, hypermarkets, and café chains in these hubs offer the broadest range of plant-based brands, creating a cycle of visibility, trial, and repeat purchase.
Conversely, secondary cities and conservative interior regions lag in adoption, with traditional dairy still reigning supreme and price sensitivity being more pronounced. Yet, as modern grocery formats and e-commerce gradually penetrate these areas, access to almond, oat, soy, and other plant-based milks is on the rise. Often, these products make their debut through large retailers’ private labels or imported brands. With growing awareness of lactose intolerance, calorie reduction, and clean-label positioning spreading beyond tier-1 cities, these emerging urban clusters are poised to shift from mere trial to regular consumption, especially among health-conscious families and younger professionals.
Regionally, Saudi Arabia stands as the cornerstone for plant-based dairy in the GCC. Its vast population and swiftly evolving retail and foodservice landscape grant it the largest share of the bloc’s plant-based dairy value. The central location of the country, coupled with logistics networks from Riyadh, Jeddah, and Dammam, ensures smooth distribution of both domestic and imported dairy alternative products throughout the kingdom and into neighboring states. Furthermore, with Vision 2030 underscoring health, sustainability, and food innovation, Saudi Arabia is not just a market but a launchpad for new plant-based formats, poised for scaling across the broader Middle East.
Competitive Landscape
The Saudi dairy alternatives market is characterized by a moderately fragmented competitive landscape, where established dairy giants hold a dominant position. These companies strategically leverage their extensive distribution networks and strong brand recognition to introduce plant-based products alongside their conventional dairy offerings. This dual approach not only strengthens their market position but also allows them to efficiently manage supply chains while transferring consumer trust from their traditional products to new alternatives. By doing so, they create significant barriers for new entrants, particularly pure-play alternative protein companies, which face challenges in gaining access to the market and establishing a foothold.
One of the critical strategies employed by incumbent dairy companies is the effective utilization of their existing retail relationships and cold chain infrastructure. These resources enable them to achieve rapid market penetration with minimal additional investment, ensuring their plant-based products are widely available to consumers. By integrating these alternatives into their existing operations, these companies maintain cost efficiency while meeting the growing demand for dairy alternatives. This approach not only enhances their competitive edge but also positions them as key players in the evolving market landscape, where consumer preferences are increasingly shifting toward plant-based options.
SADAFCO's successful oat milk launch exemplifies how established dairy players can capitalize on their infrastructure and market presence to gain a competitive advantage. The company effectively utilized its well-established retail network and cold chain capabilities to introduce the product, achieving swift market entry and widespread consumer adoption. This case highlights the significant advantage that incumbent players hold over new entrants, who often face high costs, logistical challenges, and limited resources in replicating such infrastructure. As a result, established dairy companies continue to dominate the Saudi dairy alternatives market, leveraging their strengths to meet the rising demand for plant-based products.
Saudi Arabia Dairy Alternatives Industry Leaders
-
Blue Diamond Growers
-
Saudia Dairy and Foodstuff Company (SADAFCO)
-
Danone S.A.
-
Al Othman Holding Company
-
Almarai
- *Disclaimer: Major Players sorted in no particular order

Recent Industry Developments
- May 2025: Saudi Arabia established a significant 1 million square-foot dairy cluster in Al-Kharj. This initiative was part of a larger effort to create specialized food industry hubs, with a particular focus on the dairy sector, across the Kingdom.
- May 2022: SADAFCO introduced Saudi Arabia's inaugural locally-produced oat milk, marking a significant milestone in the country's dairy alternatives market. This launch aligns with the growing consumer demand for plant-based milk options, catering to health-conscious individuals and those with dietary restrictions.


Saudi Arabia Dairy Alternatives Market Report Scope
Non-Dairy Butter, Non-Dairy Cheese, Non-Dairy Ice Cream, Non-Dairy Milk, Non-Dairy Yogurt are covered as segments by Category. Off-Trade, On-Trade are covered as segments by Distribution Channel.| Non-Dairy Milk | Almond Milk |
| Coconut Milk | |
| Oat Milk | |
| Soy Milk | |
| Hemp Milk | |
| Hazelnut Milk | |
| Non-Dairy Cheese | |
| Non-Dairy Desserts | |
| Non-Dairy Yogurt | |
| Others |
| Flavored |
| Unflavored |
| PET Bottles |
| Cans |
| Cartons |
| Others (Tetrapacks, Pouches) |
| Off-Trade | Convenience Stores |
| Online Retail | |
| Specialist Retailers | |
| Supermarkets and Hypermarkets | |
| Others | |
| On-Trade |
| By Product Type | Non-Dairy Milk | Almond Milk |
| Coconut Milk | ||
| Oat Milk | ||
| Soy Milk | ||
| Hemp Milk | ||
| Hazelnut Milk | ||
| Non-Dairy Cheese | ||
| Non-Dairy Desserts | ||
| Non-Dairy Yogurt | ||
| Others | ||
| Flavor | Flavored | |
| Unflavored | ||
| By Packaging Type | PET Bottles | |
| Cans | ||
| Cartons | ||
| Others (Tetrapacks, Pouches) | ||
| By Distribution Channel | Off-Trade | Convenience Stores |
| Online Retail | ||
| Specialist Retailers | ||
| Supermarkets and Hypermarkets | ||
| Others | ||
| On-Trade | ||


Market Definition
- Dairy Alternatives - Dairy alternatives are foods that are made from plant-based milk/oils instead of their usual animal products, such as cheese, butter, milk, ice cream, yogurt, etc. Plant-based or non-dairy milk alternative is the fast-growing segment in the newer food product development category of functional and specialty beverage across the globe.
- Non-Dairy Butter - Non dairy butter is a vegan butter alternative that is made from a mixture of plant oils. With an increase in alternative diets like vegetarianism, veganism, and gluten intolerance, plant butter is a healthy non-dairy substitute for normal butter.
- Non-Dairy Ice Cream - Plant based ice cream is a growing category. Non-dairy ice cream is a type of dessert made without any animal ingredients. This is typically considered a substitute for regular ice cream for those who cannot or do not eat animal or animal-derived products, including eggs, milk, cream, or honey.
- Plant-Based Milk - Plant based milks are milk substitutes that are made from nuts (e.g., hazelnuts, hemp seeds), seeds (e.g., sesame, walnuts, coconuts, cashews, almonds, rice, oats, etc.) or legumes (e.g., soy). Plant-based milk such as soy milk and almond milk have been popular in East Asia and the Middle East for centuries.
| Keyword | Definition |
|---|---|
| Cultured Butter | Cultured butter is prepared by having the raw butter go through chemical processing and has been added with certain emulsifiers and foreign ingredients. |
| Uncultured Butter | This type of butter is one which has not been processed in any way |
| Natural Cheese | The type of cheese in its most natural form. It is made from natural and simple products and ingredients, including fresh and natural salts, natural colors, enzymes, and high-quality milk. |
| Processed Cheese | Processed cheese undergoes the same processes as natural cheese; however, it requires more steps and many different forms of ingredients. Making processed cheese involves melting natural cheese, emulsifying it, and adding preservatives and other artificial ingredients or colorings. |
| Single Cream | Single cream contains around 18% fat. It’s a single layer of cream that appears over boiled milk. |
| Double Cream | Double cream contains 48% fat, more than double the amount of fat of single cream. It’s heavier and thicker than single cream |
| Whipping Cream | This has a much higher fat percentage than single cream (36%). Used to top cakes, pies, and puddings and as a thickener for sauces, soups, and fillings. |
| Frozen Desserts | Desserts that are meant to be eaten in frozen condition. E.g., sherbets, sorbets, frozen yogurts |
| UHT Milk (Ultra-high temperature milk) | Milk heated at a very high temperature. Ultra-high-temperature processing (UHT) of milk involves heating for 1–8 sec at 135–154°C. which kills the spore-forming pathogenic microorganism, resulting in a product with a shelf-life of several months. |
| Non-dairy butter/Plant-based butter | Butter made from plant-derived oil such as coconut, palm, etc. |
| Non-dairy Yogurt | Yogurt made from typically made from nuts, like almonds, cashews, coconuts, and even other foods like soybeans, plantains, oats, and peas |
| On-trade | It refers to restaurants, QSRs, and bars. |
| Off-trade | It refers to supermarkets, hypermarkets, on-line channels, etc. |
| Neufchatel cheese | One of the oldest kinds of cheese in France. It is a soft, slightly crumbly, mold-ripened, bloomy-rind cheese made in the Neufchâtel-en-Bray region of Normandy. |
| Flexitarian | It refers to a consumer preferring a semi-vegetarian diet, that is centered on plant foods with limited or occasional inclusion of meat. |
| Lactose Intolerance | Lactose intolerance is a reaction in digestive system to lactose, the sugar in milk. It causes uncomfortable symptoms in response to the consumption of dairy products. |
| Cream Cheese | Cream cheese is a soft and creamy fresh cheese with a tangy taste made from milk and cream. |
| Sorbets | Sorbet is a frozen dessert made using ice combined with fruit juice, fruit purée, or other ingredients, such as wine, liqueur, or honey. |
| Sherbet | Sherbet is a sweetened frozen dessert made with fruit and some sort of dairy product such as milk or cream. |
| Shelf stable | Foods that can be safely stored at room temperature, or "on the shelf," for at least one year and do not have to be cooked or refrigerated to eat safely. |
| DSD | Direct Store Delivery is the process in supply chain management wherein the product is delivered from manufacturing plant directly to the retailer. |
| OU Kosher | Orthodox Union Kosher is a kosher certification agency based in New York City. |
| Gelato | Gelato is a frozen creamy dessert made with milk, heavy cream and sugar. |
| Grass-fed Cows | Grass-fed cows are allowed to graze in pastures, where they eat a variety of grasses and clover. |


Research Methodology
Mordor Intelligence follows a four-step methodology in all our reports.
- Step-1: Identify Key Variables: In order to build a robust forecasting methodology, the variables and factors identified in Step 1 are tested against available historical market numbers. Through an iterative process, the variables required for market forecast are set, and the model is built on the basis of these variables.
- Step-2: Build a Market Model: Market-size estimations for the forecast years are in nominal terms. Inflation is not a part of the pricing, and the average selling price (ASP) is kept constant throughout the forecast period for each country.
- Step-3: Validate and Finalize: In this important step, all market numbers, variables, and analyst calls are validated through an extensive network of primary research experts from the market studied. The respondents are selected across levels and functions to generate a holistic picture of the market studied.
- Step-4: Research Outputs: Syndicated Reports, Custom Consulting Assignments, Databases & Subscription Platforms


