Underwater Robotics Market Size and Share
Market Overview
| Study Period | 2019 - 2030 |
|---|---|
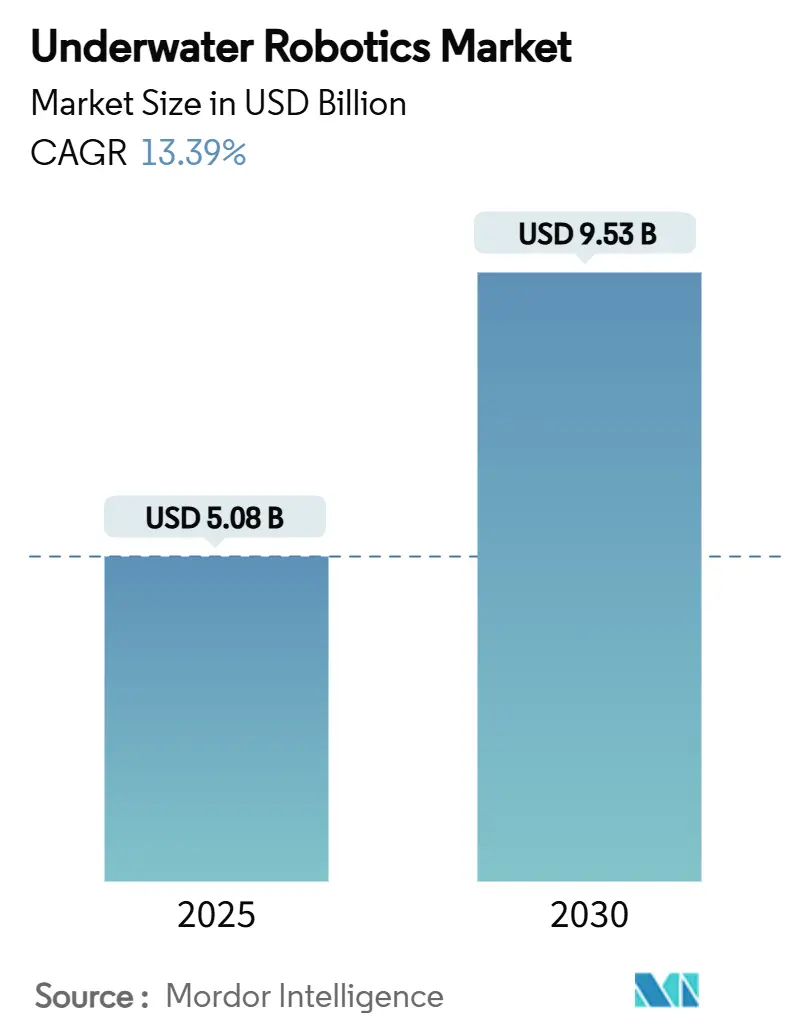
| Market Size (2025) | USD 5.08 Billion |
| Market Size (2030) | USD 9.53 Billion |
| Growth Rate (2025 - 2030) | 13.39% CAGR |
| Fastest Growing Market | Asia Pacific |
| Largest Market | Europe |
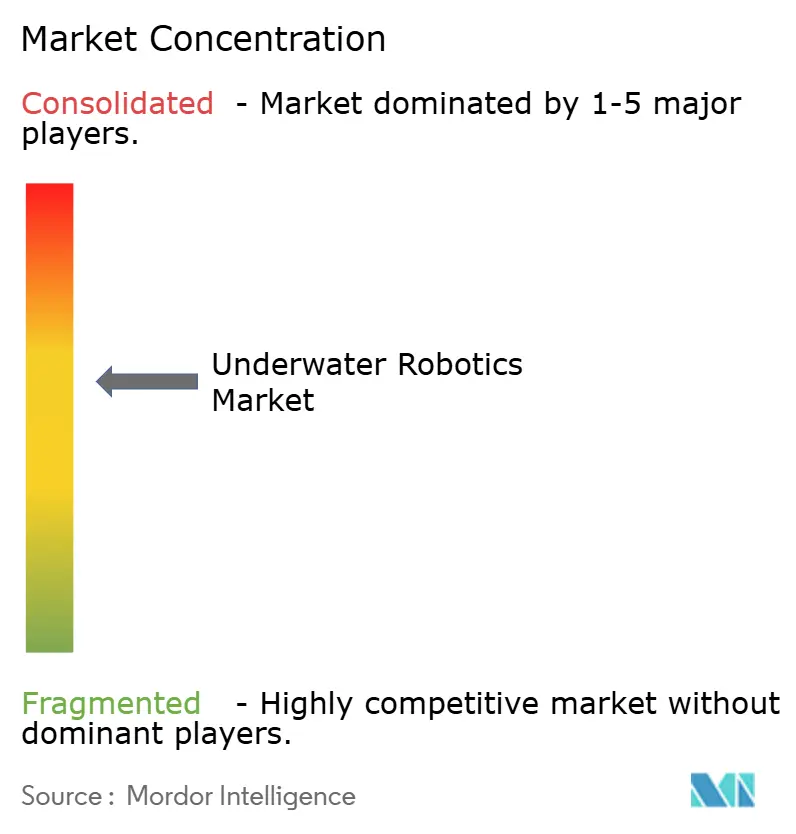
| Market Concentration | Medium |
Major Players *Disclaimer: Major Players sorted in no particular order Image © Mordor Intelligence. Reuse requires attribution under CC BY 4.0. | |
Underwater Robotics Market Analysis by Mordor Intelligence
The underwater robotics market size stood at USD 5.08 billion in 2025 and is forecast to reach USD 9.53 billion by 2030, translating into a 13.39% CAGR during the period. Growth is propelled by deep-water energy developments, rapid defense procurement of autonomous systems, offshore wind cost-reduction mandates and strong venture-capital flows into resident AUV technologies. Companies are expanding fleets—Oceaneering reported 67% remotely operated vehicle (ROV) utilization in Q1 2025, while Kongsberg logged 40% growth in maritime new-build orders—signaling sustained demand across commercial and defense domains. Software revenues are growing steadily as adaptive navigation and predictive maintenance platforms continue to advance, highlighting the ongoing shift toward autonomous operations. Meanwhile, supply-chain pressures for rare-earth magnets and subsea batteries are reshaping procurement strategies, driving research into alternative propulsion and power architectures.
Key Report Takeaways
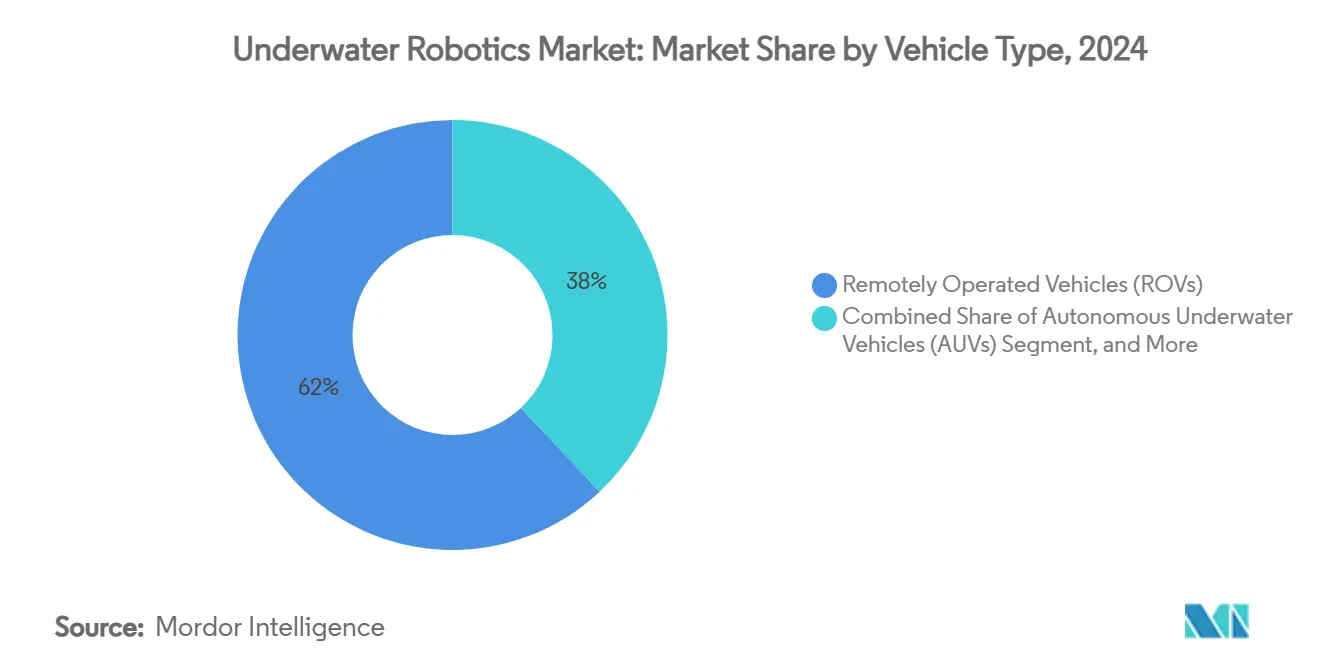
- By vehicle type, remotely operated vehicles held 62.11% of underwater robotics market share in 2024, while autonomous underwater vehicles are advancing at a 15.60% CAGR through 2030.
- By component, hardware represented 48.47% of underwater robotics market size in 2024; software is expanding at a 17.80% CAGR to 2030.
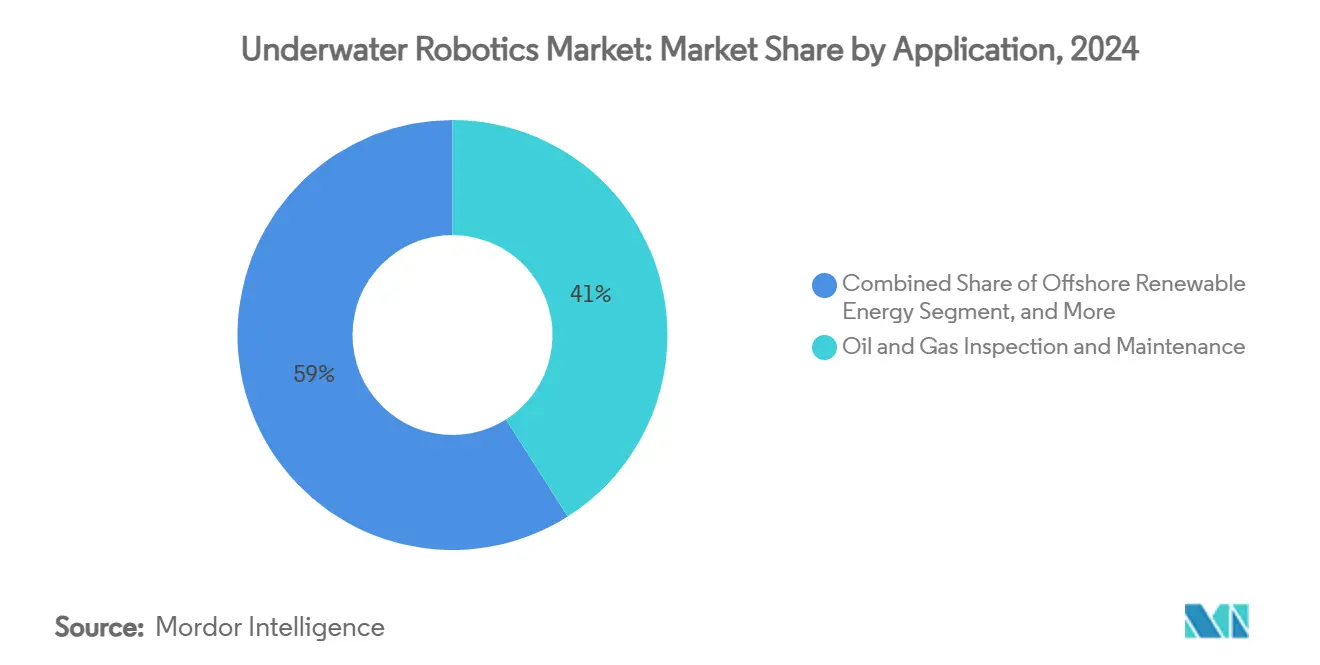
- By application, oil and gas inspection accounted for 41.30% share of the underwater robotics market size in 2024, whereas offshore renewable energy is poised for a 13.46% CAGR through 2030.
- By depth rating, the 1,000-3,000 m band led with 38.20% revenue in 2024; ultra-deep operations (>6,000 m) record the fastest CAGR at 16.40% between 2025-2030.
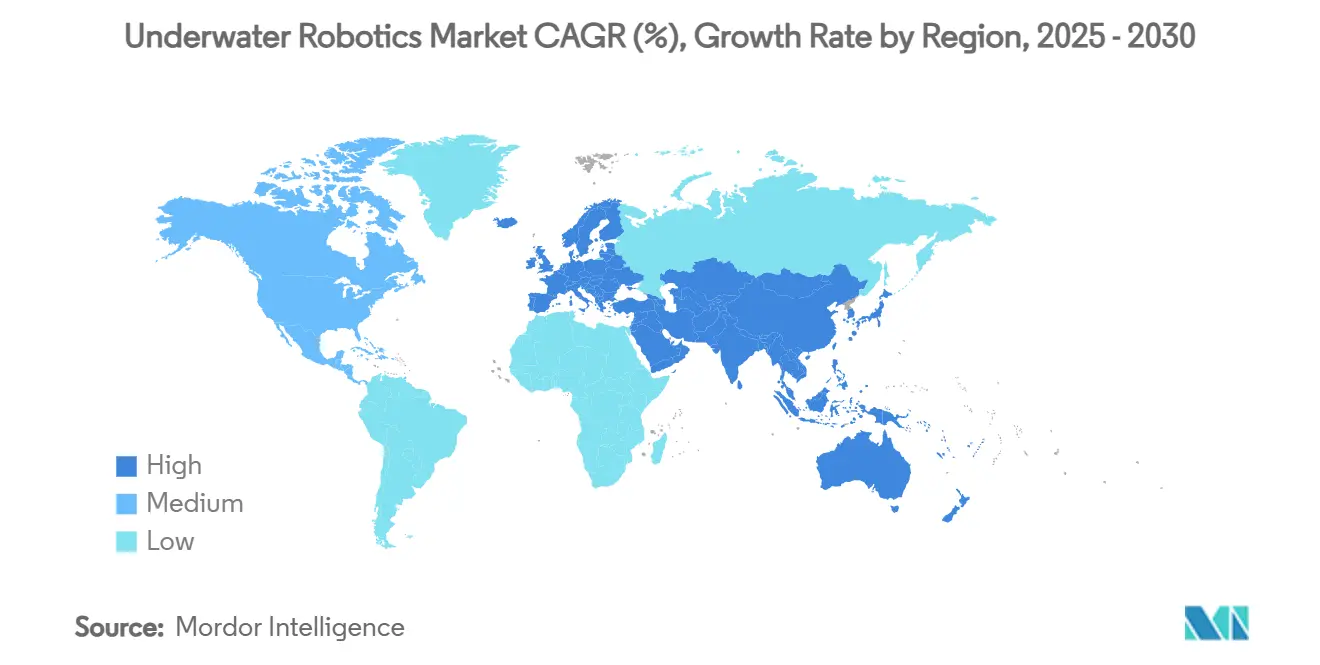
- By region, Europe commanded 31.62% of underwater robotics market share in 2024 and Asia-Pacific is projected to post a 13.62% CAGR to 2030.
Market Trends and Insights
Drivers Impact Analysis of Underwater Robotics Market*
| Driver | (~) % Impact on CAGR Forecast | Geographic Relevance | Impact Timeline |
|---|---|---|---|
| Escalating deep-water energy projects | +3.2% | North Sea, Gulf of Mexico, Brazil | Medium term (2-4 years) |
| Rapid defense adoption of autonomous MCM | +2.8% | United States, Europe, Indo-Pacific | Short term (≤ 2 years) |
| Offshore wind farm OPEX optimization mandates | +2.5% | Europe, North America East Coast, Asia-Pacific | Medium term (2-4 years) |
| Aquaculture shift to offshore cages | +1.9% | Norway, Chile, Mediterranean, Asia-Pacific | Long term (≥ 4 years) |
| AI-enabled adaptive navigation algorithms | +1.7% | Global technology hubs | Medium term (2-4 years) |
| Venture-capital funding for resident AUVs | +1.2% | North America, Europe innovation clusters | Long term (≥ 4 years) |
| Source: Mordor Intelligence | |||
Escalating Deep-Water Energy Projects Drive Advanced ROV Deployment
Operators are committing new capital to fields below 1,000 m where saturation diving is not economical. Work-class ROVs perform photogrammetry, valve actuation and debris removal in these environments, allowing producers such as Shell to cut inspection costs and downtime. Deeper assets demand higher-thrust propulsion, thicker pressure housing and real-time 4K imaging, pushing OEM R&D spending and fueling upgrades across existing fleets. Autonomous pipeline-inspection vehicles like Kawasaki’s SPICE now cover 20 km missions at 3,000 m in a single sortie, demonstrating the operational savings of robotic endurance and precise navigation.[1]Government of Japan, “Underwater Robots for Pipeline Inspection,” gov-online.go.jp
Rapid Defense Adoption of Autonomous Mine-Countermeasure Systems
Navies are fielding large-displacement AUVs that remain submerged for 10 days, map seafloor mines and relay data without exposing sailors to risk. The U.S. Navy’s deployment of Anduril’s Dive-LD to Squadron 1 underscores an accelerating procurement tempo, with annual production capacity surpassing 200 units at the Rhode Island plant. Australia’s Ghost Shark program and Chinese exports of surveillance robots to the Middle East illustrate a multiregional arms race in subsea autonomy, driving volume demand for sensors, guidance software and hybrid power modules.
Offshore Wind Farm OPEX Optimization Mandates
European and Asian offshore wind operators are under pressure to reduce levelized energy costs. Robotic inspection of monopiles, transition pieces and export cables help defer human dives and heavy-lift jack-ups. Saab Seaeye Cougar-XTi vehicles, recently purchased by HBC Group, carry multi-beam sonars and laser profilers that complete foundation surveys in a single tidal window. Oceaneering's Inform Predict platform, leveraging AI-driven data analytics, optimizes inspection processes and identifies early-stage corrosion, supporting compliance with OPEX-reduction objectives.
Aquaculture Shift to Offshore Cages
Salmon producers are relocating grow-out phases to exposed waters to mitigate lice and waste. Norway’s Mowi expanded its ROV fleet by 40% to manage net integrity, mortalities and biomass assessment, adopting tools such as the Foover for humane fish removal. Asian ventures pair wind turbines with fish cages, necessitating dual-role vehicles that inspect both energy and farming assets, thereby broadening addressable opportunities for the underwater robotics market.
Restraints Impact Analysis of Underwater Robotics Market*
| Restraint | (~) % Impact on CAGR Forecast | Geographic Relevance | Impact Timeline |
|---|---|---|---|
| Limited subsea battery endurance | −2.1% | Global, especially ultra-deepwater | Medium term (2-4 years) |
| Rare-earth magnet supply crunch | −1.8% | Global, supply concentrated in China | Short term (≤ 2 years) |
| Fiber-optic tether cost inflation | −1.3% | Global tethered operations | Short term (≤ 2 years) |
| Regulatory lag on full autonomy | −0.9% | International waters, EEZ boundaries | Long term (≥ 4 years) |
| Source: Mordor Intelligence | |||
Limited Subsea Battery Endurance and Re-charging Infrastructure
AUV sorties remain capped at roughly 24 hours because high-pressure housings cut usable energy density. Hydrogen fuel cells, exemplified by Cellula Robotics’ Solus-XR, extend range past 5,000 km, but marine refueling nodes remain rare. Research into mid-mission docking led by Purdue University shows promise, yet commercial roll-out awaits standardization of wet-mate connectors and inductive charging pads.[2]Purdue University, “Autonomous Docking for AUVs,” sciencedaily.com
Supply-Chain Crunch for Rare-Earth Thruster Magnets
Permanent-magnet motors deliver the precise thrust that station-keeping tasks demand, but neodymium dysprosium supplies remain concentrated. Kongsberg thrusters are experiencing extended lead times and rising component costs, including increased fiber-optic part expenses. Consequently, integrators are testing hybrid hydraulic-electric designs, despite challenges related to weight and efficiency.
*Our forecasts treat driver/restraint impacts as directional, not additive. The impact forecasts reflect baseline growth, mix effects, and variable interactions.
Underwater Robotics Market Segment Analysis
By Vehicle Type:
ROVs Maintain Dominance While AUVs AccelerateThe underwater robotics market size for ROVs amounted to USD 3.16 billion in 2024 and captured 62.11% underwater robotics market share, anchored by work-class units that deliver tooling, torque and real-time visuals to deep-water energy operators. [3]Blueye Robotics, “Ballast Tank Inspections Cut to Two Days,” blueyerobotics.comDemand extends to observation-class craft supporting offshore wind farm maintenance and micro-ROVs handling confined inspections within storage tanks and dams.
AUV revenue is climbing to 15.60% CAGR as platforms transition from survey to intervention roles. Deep-rated designs such as Kawasaki’s SPICE perform 20 km pipeline scans per eight-hour mission, while defense customers procure large-displacement vehicles that stay submerged for 10 days. Hybrid vehicles and buoyancy-driven gliders round out niche long-duration scientific tasks, adding resilience to fleet portfolios.


By Component:
Hardware Dominance Challenged by Software InnovationHardware generated nearly half of 2024 revenue, led by frames, manipulators and propulsion systems that face magnet and alloy cost volatility. Battery modules are shifting to higher-capacity lithium packs and experimental solid-state chemistries to meet endurance targets without sacrificing payload.
Software, though currently smaller, is expanding 17.80% annually. Packages such as Oceaneering’s Inform Predict synthesize sensor logs and machine-learning models to schedule maintenance, cutting inspection scope and vessel days. Services, including Robotics-as-a-Service subscriptions, are also rising as cost-conscious operators favor OPEX over CAPEX.
By Application:
Energy Dominance with Renewable GrowthOil and gas inspection retained 41.30% of the underwater robotics market size in 2024, benefiting from aging infrastructure and stricter integrity mandates. Subsea 7’s adoption of high-speed data-imaging ROVs trims survey time and cuts vessel fuel burn.[4]Riviera Maritime Media, “High-Speed Imaging Cuts Costs,” rivieramm.com
Offshore renewable energy is on track for a 13.46% CAGR thanks to seabed-anchored wind arrays requiring cable burial, scour-monitoring and foundation cleaning. Defense, science and aquaculture represent secondary but fast-expanding verticals as autonomy scales.
By Depth Rating:
Mid-Water Operations Lead Current DemandAssets in the 1,000-3,000 m window generated the highest 2024 revenue, aligning with continental-shelf hydrocarbon fields and most wind farm installations. Operators favor this depth range because tooling, tether management and vessel logistics remain manageable.
Ultra-deep missions beyond 6,000 m are growing 16.40% per year on interest in polymetallic nodule harvesting and defense surveillance. Conversely, shallow-water fleets sustain harbor security, aquaculture and bridge inspection jobs, emphasizing portability and rapid deployment.
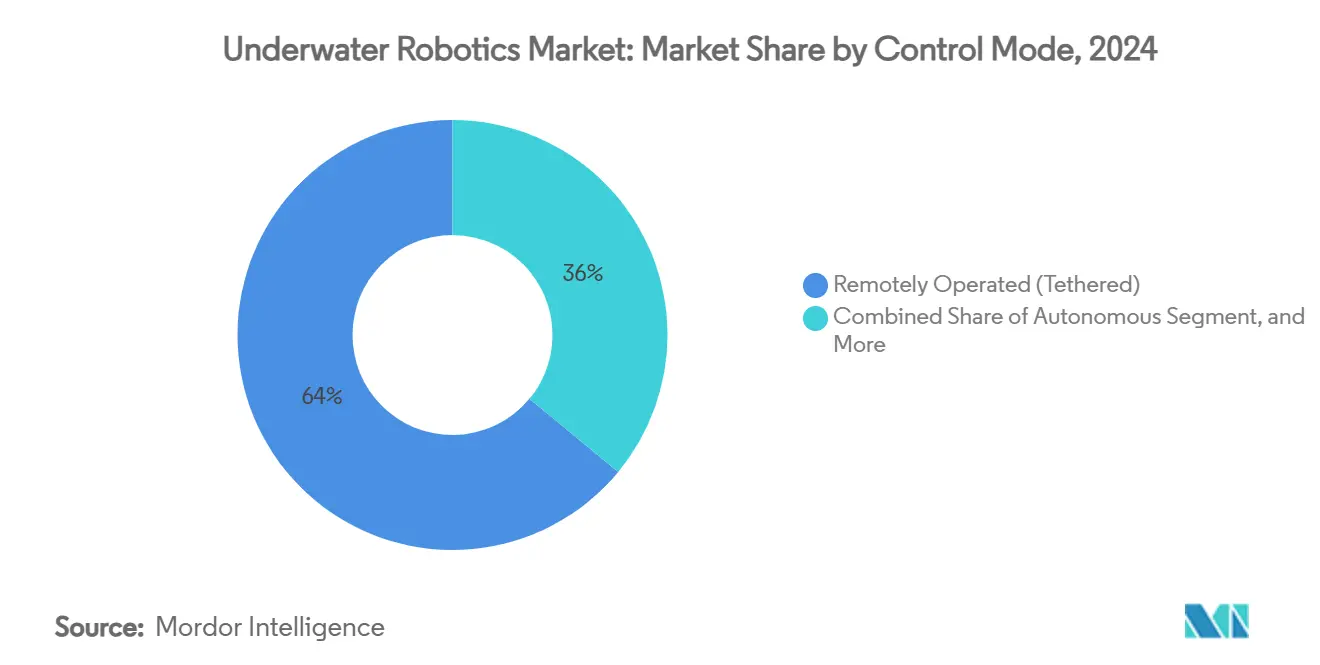
By Control Mode:
Tethered Systems Dominate with Autonomous GrowthRemotely operated tethered vehicles held 63.51% revenue in 2024 due to unlimited power and immediate human oversight, critical for valve turns and hot-stab tasks. However, fiber-optic tether costs have jumped 70%, prompting some operators to shorten umbilical’s or adopt hybrid acoustic-optical links.
Autonomous platforms are expanding to 16.61% annually. Mobile docking and residents AUV garages promise true persistent presence, letting missions run for months with minimal human interaction. Semi-autonomous modes blend AI navigation with top side approvals, providing a bridge toward full autonomy.
By End-User:
Energy Companies Lead with Aquaculture AccelerationEnergy operators represented 40.23% of 2024 expenditure, driven by consistent inspection, intervention and decommissioning needs. Oceaneering’s 67% fleet utilization underscores robust demand, even as capital budgets migrate toward lower-carbon assets.
Aquaculture’s 17.30% CAGR stems from the transition to offshore cages and stricter animal-welfare rules. ROVs handle daily husbandry tasks and environmental checks, improving feed conversion and mortality management. Government research institutes and commercial service providers round out the user base, often operating mixed fleets under subscription models.
Geography Analysis
Europe Underwater Robotics Market
Europe generated 31.62% of 2024 revenue, supported by mature North Sea energy assets, rapid offshore wind roll-out and clear autonomy guidelines such as the UK Maritime and Coastguard Agency’s MGN 702. Norway’s integrated approach to aquaculture and renewables further broadens robot utilization across value chains.
APAC Underwater Robotics Market
Asia-Pacific is the fastest-growing region, clocking a 13.62% CAGR as China broadens undersea surveillance exports and South Korea leverages shipyard capacity for floating wind foundations. Japan’s pipeline-inspection AUVs and Philippine-based floating-wind fabrication illustrate regional diversification efforts.
North America Underwater Robotics Market
North America remains a technology leader, propelled by Pentagon funding and Gulf of Mexico subsea infrastructure. During 2024-2025, venture investors directed considerable funding toward early-stage companies, including Bedrock Ocean, which focused on a mapping initiative, and Blue Water Autonomy, which completed a seed round.

Competitive Landscape
The underwater robotics market is moderately consolidated. Established service providers such as Oceaneering and Subsea 7 maintain diversified fleets and global logistics, giving them scale advantages. OEMs like Kongsberg supply integrated control, thruster and sensor suites that lock in customers to proprietary platforms, helping lift its maritime order intake 40% in Q2 2025.
Strategic Merger and Acquisitions accelerated during 2024-2025. In November 2024, BlueHalo absorbed VideoRay to bolster defense offerings, while Kraken Robotics bought 3D at Depth for USD 17 million, integrating laser LiDAR into existing seabed analytics. These deals illustrate a push toward end-to-end autonomy stacks combining vehicles, perception sensors and AI toolchains.
Start-ups such as Nauticus Robotics pursue a Robotics-as-a-Service model, securing USD 12 million to ready Aquanaut for Gulf of Mexico deployments. Resident docking solutions and wireless power transfer remain white-space opportunities, with university consortia piloting prototypes but lacking commercial scale.
Underwater Robotics Industry Leaders
Oceaneering International, Inc.
Saab AB (Saab Seaeye Ltd.)
Kongsberg Gruppen ASA
Teledyne Technologies Incorporated
Fugro N.V.
- *Disclaimer: Major Players sorted in no particular order
Underwater Robotics Market Companies Covered in this Report
- Oceaneering International, Inc.
- Saab AB (Saab Seaeye Ltd.)
- Kongsberg Gruppen ASA
- Teledyne Technologies Incorporated
- Fugro N.V.
- ECA Group (SPX Technologies Inc.)
- Forum Energy Technologies, Inc.
- DeepOcean Group Holding B.V.
- Schilling Robotics, LLC (TechnipFMC plc)
- IKM Subsea AS
- SMD Ltd. (CRRC Times Electric Co., Ltd.)
- Blue Robotics, Inc.
- Atlas Elektronik GmbH
- Boeing Defense, Space & Security (Orca XLUUV)
- Lockheed Martin Corporation
- Soil Machine Dynamics North America, Inc.
- Maritime Robotics AS
- Hydromea SA
- Paladin Underwater Systems LLC
- Seaber SAS

Recent Industry Developments in Underwater Robotics Market
- May 2025: Cellula Robotics partnered with Subsea Europe Services and FLANQ to advance long-duration AUV operations
- April 2025: Anduril delivered its Dive-LD AUV to the U.S. Navy’s Squadron 1, adding 10-day, 6,000 m endurance for intelligence missions
- April 2025: Kraken Robotics closed a USD 17 million deal for 3D at Depth, adding LiDAR imaging to its portfolio
- February 2025: Nauticus Robotics secured USD 12 million and installed a new CEO to fast-track Aquanaut certification
- November 2024: BlueHalo bought VideoRay, strengthening unmanned maritime offerings
- October 2024: VideoRay partnered with Sarcos, Vaarst and Greensea to integrate perception and manipulation technologies
- October 2024: UCO and Mowi expanded ROV collaboration, boosting fish-farm robotics capacity by 40%


Global Underwater Robotics Market Report Scope
Segmentation Overview
| Remotely Operated Vehicles (ROVs) | Work-class ROVs |
| Observation-class ROVs | |
| Micro and Mini ROVs | |
| Autonomous Underwater Vehicles (AUVs) | Shallow-water AUVs (<1,000 m) |
| Mid-water AUVs (1,000-3,000 m) | |
| Deep-water AUVs (3,000-6,000 m) | |
| Hybrid Vehicles and Gliders |
| Hardware | Frames and Pressure Housings |
| Thrusters and Propulsion | |
| Sensors and Instrumentation | |
| Cameras and Imaging | |
| Batteries and Power Systems | |
| Manipulator Arms and Tools | |
| Software | |
| Services |
| Oil and Gas Inspection and Maintenance |
| Offshore Renewable Energy |
| Defense and Security |
| Scientific Research and Exploration |
| Aquaculture and Fisheries |
| Salvage, Search and Rescue |
| Infrastructure (Ports, Dams, Bridges) |
| Less than 1,000 m |
| 1,000-3,000 m |
| 3,000-6,000 m |
| Above 6,000 m |
| Remotely Operated (Tethered) |
| Autonomous |
| Semi-Autonomous |
| Energy Companies |
| Defense and Government Agencies |
| Research Institutes and Universities |
| Commercial Service Providers |
| Aquaculture Operators |
| North America | United States |
| Canada | |
| Mexico | |
| Europe | Germany |
| France | |
| United Kingdom | |
| Italy | |
| Rest of Europe | |
| Asia-Pacific | China |
| Japan | |
| India | |
| Australia | |
| South Korea | |
| Rest of Asia-Pacific | |
| South America | Brazil |
| Argentina | |
| Rest of South America | |
| Middle East | Saudi Arabia |
| United Arab Emirates | |
| Kuwait | |
| Bahrain | |
| Rest of Middle East | |
| Africa | South Africa |
| Egypt | |
| Nigeria | |
| Rest of Africa |
| By Vehicle Type | Remotely Operated Vehicles (ROVs) | Work-class ROVs |
| Observation-class ROVs | ||
| Micro and Mini ROVs | ||
| Autonomous Underwater Vehicles (AUVs) | Shallow-water AUVs (<1,000 m) | |
| Mid-water AUVs (1,000-3,000 m) | ||
| Deep-water AUVs (3,000-6,000 m) | ||
| Hybrid Vehicles and Gliders | ||
| By Component | Hardware | Frames and Pressure Housings |
| Thrusters and Propulsion | ||
| Sensors and Instrumentation | ||
| Cameras and Imaging | ||
| Batteries and Power Systems | ||
| Manipulator Arms and Tools | ||
| Software | ||
| Services | ||
| By Application | Oil and Gas Inspection and Maintenance | |
| Offshore Renewable Energy | ||
| Defense and Security | ||
| Scientific Research and Exploration | ||
| Aquaculture and Fisheries | ||
| Salvage, Search and Rescue | ||
| Infrastructure (Ports, Dams, Bridges) | ||
| By Depth Rating | Less than 1,000 m | |
| 1,000-3,000 m | ||
| 3,000-6,000 m | ||
| Above 6,000 m | ||
| By Control Mode | Remotely Operated (Tethered) | |
| Autonomous | ||
| Semi-Autonomous | ||
| By End-User | Energy Companies | |
| Defense and Government Agencies | ||
| Research Institutes and Universities | ||
| Commercial Service Providers | ||
| Aquaculture Operators | ||
| Geography | North America | United States |
| Canada | ||
| Mexico | ||
| Europe | Germany | |
| France | ||
| United Kingdom | ||
| Italy | ||
| Rest of Europe | ||
| Asia-Pacific | China | |
| Japan | ||
| India | ||
| Australia | ||
| South Korea | ||
| Rest of Asia-Pacific | ||
| South America | Brazil | |
| Argentina | ||
| Rest of South America | ||
| Middle East | Saudi Arabia | |
| United Arab Emirates | ||
| Kuwait | ||
| Bahrain | ||
| Rest of Middle East | ||
| Africa | South Africa | |
| Egypt | ||
| Nigeria | ||
| Rest of Africa | ||


Key Questions Answered in the Report
What is the forecast value of the underwater robotics market by 2030?
The market is projected to reach USD 9.53 billion by 2030.
Which vehicle type currently dominates spending?
Remotely operated vehicles accounted for 62.11% of 2024 revenue.
Which region will grow fastest through 2030?
Asia-Pacific is expected to register a 13.62% CAGR on expanding defense and renewable projects.
What factor limits long-duration autonomous missions?
Subsea battery endurance and scarce mid-mission re-charging infrastructure remain key constraints.
Which end-user group shows the highest growth potential?
Aquaculture operators, adopting robots for offshore cage management, are forecast to expand at 17.30% CAGR.
How are companies reducing inspection costs in offshore wind farms?
Operators use AI-driven ROV platforms that cut inspection scope by about 50% while maintaining safety standards.
Page last updated on:


