Commercial Robotics Market Size and Share
Market Overview
| Study Period | 2020 - 2031 |
|---|---|
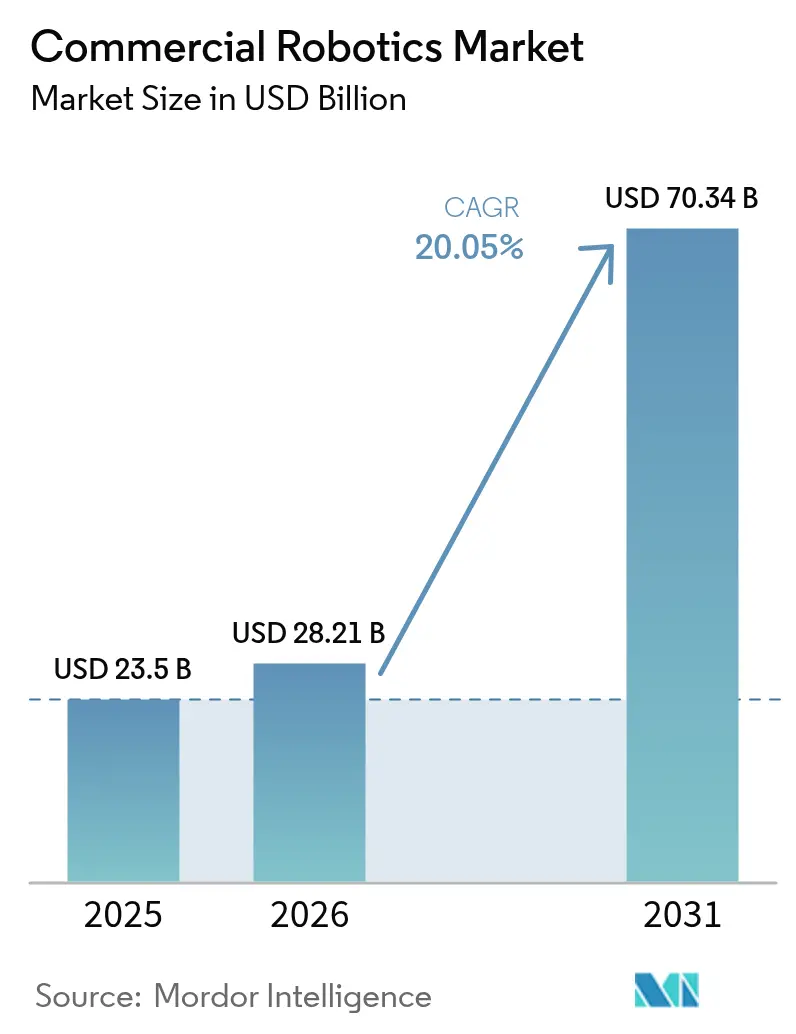
| Market Size (2026) | USD 28.21 Billion |
| Market Size (2031) | USD 70.34 Billion |
| Growth Rate (2026 - 2031) | 20.05% CAGR |
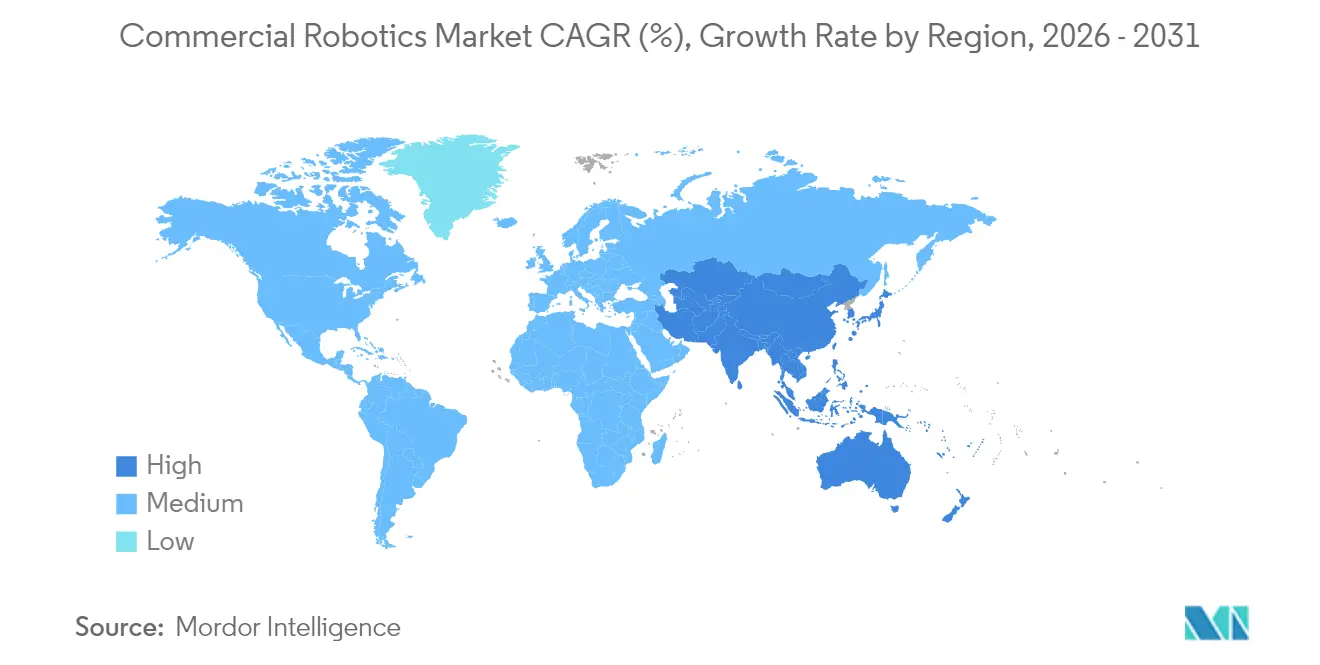
| Fastest Growing Market | Asia Pacific |
| Largest Market | North America |
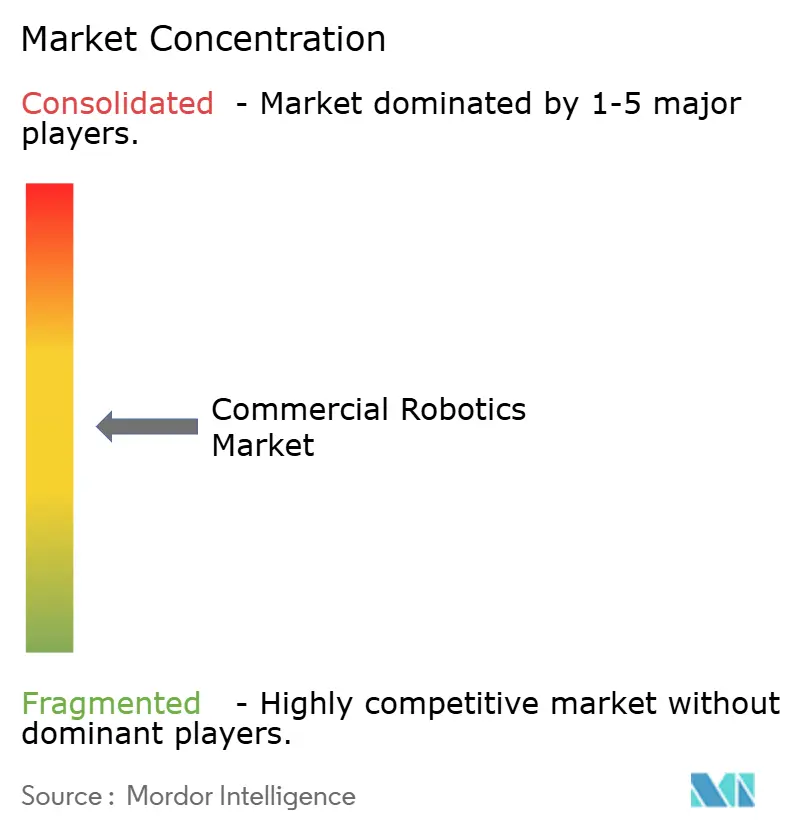
| Market Concentration | Medium |
Major Players *Disclaimer: Major Players sorted in no particular order Image © Mordor Intelligence. Reuse requires attribution under CC BY 4.0. | |
Commercial Robotics Market Analysis by Mordor Intelligence
The commercial robotics market size is expected to grow from USD 23.50 billion in 2025 to USD 28.21 billion in 2026 and is forecast to reach USD 70.34 billion by 2031 at 20.05% CAGR over 2026-2031. Robust demand stems from the fusion of artificial intelligence with edge-computing hardware that allows robots to execute perception and manipulation tasks locally, trimming latency to single-digit milliseconds. Acute labor shortages continue to tighten across manufacturing and logistics, pushing automation budgets higher as companies look to fill a projected 8.5 million U.S. job gap by decade-end. Government procurement cycles further stimulate orders for defense and security platforms, while large e-commerce players deploy hundreds of thousands of mobile robots to compress fulfillment times. Concurrently, China’s state-backed USD 138 billion capital plan underscores Asia-Pacific’s accelerating demand for autonomous systems.[1]International Federation of Robotics, “State-Backed Robotics Funding in China,” ifr.org
Key Report Takeaways
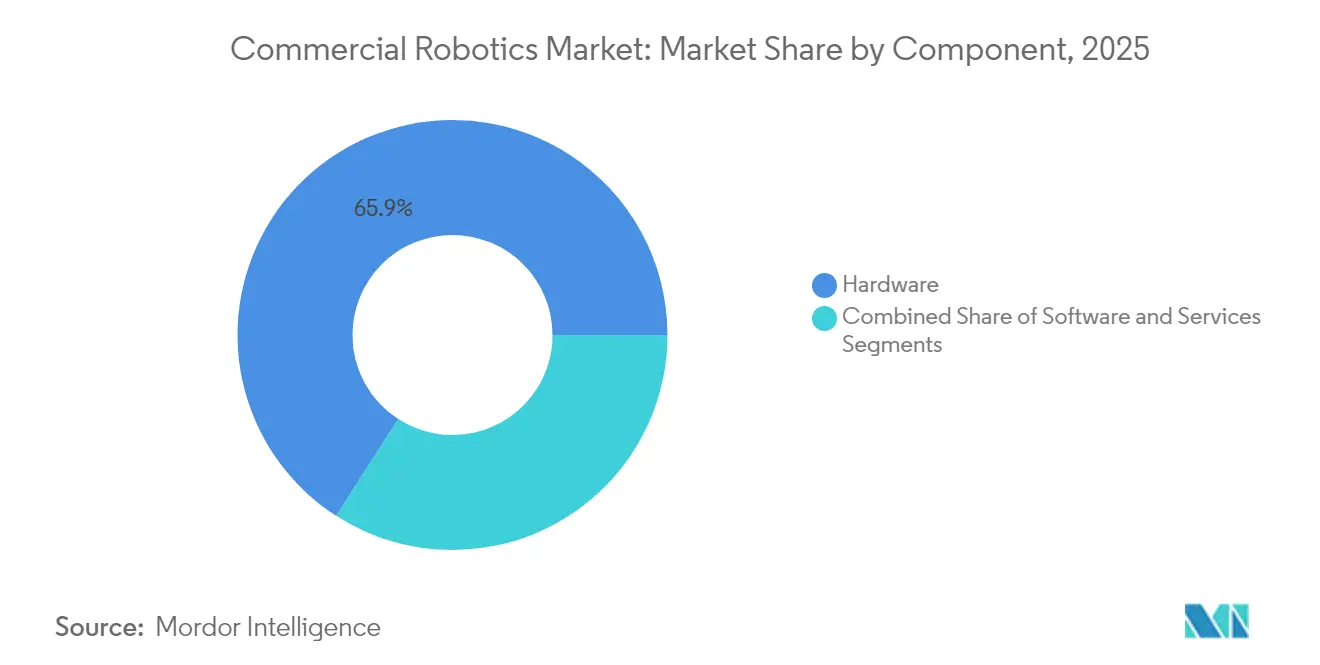
- By component, hardware led with 65.90% of 2025 revenue; software is set to grow at 21.45% CAGR to 2031.
- By type of robot, drones accounted for 37.45% of 2025 revenue; medical robots represent the fastest-growing category at 20.95% CAGR to 2031.
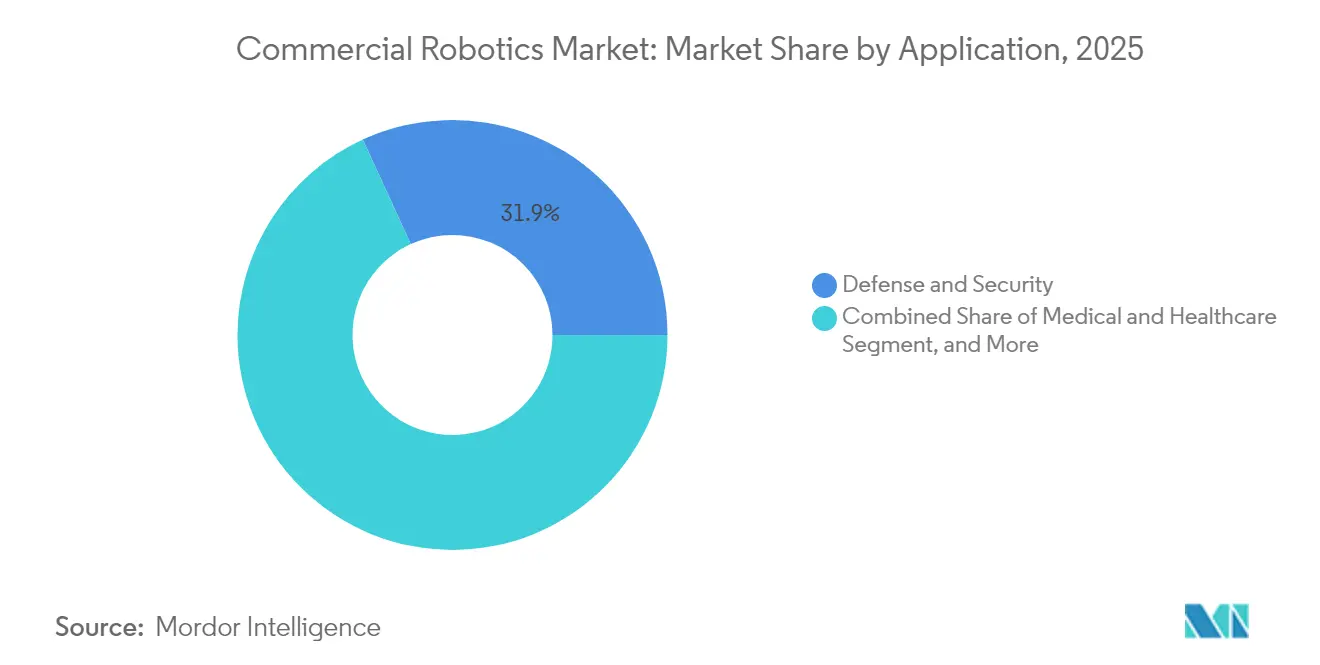
- By application, defense and security held 31.85% of 2025 revenue, whereas agriculture and forestry is forecast to expand at a 20.3% CAGR through 2031.
- By mobility, mobile ground robots captured 57.10% share in 2025, while aerial robots are advancing at 21.2% CAGR through 2031.
- By geography, North America commanded 36.10% revenue in 2025; Asia-Pacific is projected to grow at 20.95% CAGR, supported by long-term Chinese investment commitments.
Note: Market size and forecast figures in this report are generated using Mordor Intelligence’s proprietary estimation framework, updated with the latest available data and insights as of 2026.
Global Commercial Robotics Market Trends and Insights
Drivers Impact Analysis*
| Driver | (~) % Impact on CAGR Forecast | Geographic Relevance | Impact Timeline |
|---|---|---|---|
| Technological convergence of AI, edge computing and robotics | +4.2% | Global, concentrated in North America and China | Medium term (2-4 years) |
| Rising labor shortages and wage inflation | +3.8% | North America and EU, extending into APAC | Short term (≤ 2 years) |
| Expansion of e-commerce boosting warehouse robotics | +3.1% | Global, led by North America and China | Short term (≤ 2 years) |
| Increased government and defense spend on unmanned systems | +2.9% | Core markets in North America, EU, APAC | Medium term (2-4 years) |
| Eldercare service-robot adoption in super-aging economies | +2.4% | Japan, South Korea, Germany and select EU | Long term (≥ 4 years) |
| Regulatory fast-tracking of inspection robots | +1.8% | North America and EU with APAC spillover | Medium term (2-4 years) |
| Source: Mordor Intelligence | |||
Technological Convergence of AI, Edge Computing and Robotics
The commercial robotics market benefits from on-device AI inference that offsets cloud latency, enables split-second navigation choices, and supports generative task planning. Amazon operates more than 750,000 warehouse robots that deliver 25% efficiency gains by pairing vision models with local processing. John Deere's second-generation autonomy stack illustrates how edge AI permits centimeter-level steering in crop rows, enhancing uptime in unstructured fields. As advanced motion models mature, robots shift from rules-based motion to self-learning routines, turning capital equipment into upgradeable digital assets. This shift elevates software value and propels the commercial robotics market toward platform economics where algorithm improvements lift installed-base capability without mechanical retrofits.
Rising Labor Shortages and Wage Inflation
Manufacturers struggle to staff production lines as demographic shifts shrink labor pools. Vacancies could remove 2 million workers from U.S. factories by 2030, leading to an estimated USD 55 billion redirection of capital toward automation since 2021. Robotics mitigates repetitive and hazardous tasks, improving retention while sustaining throughput. As hardware prices have fallen to USD 10,856 per industrial robot, payback periods for mid-sized plants now average 1-3 years. Subscription financing models further lower entry barriers. Consequently, the commercial robotics market is positioned as a labor-augmentation tool rather than a displacement threat, aligning with corporate mandates to secure talent and productivity simultaneously.
Expansion of E-commerce Boosting Warehouse Robotics
Rapid-delivery expectations make automated fulfillment indispensable. Amazon’s USD 400 million North Andover facility combines predictive bin allocation with fleets of autonomous mobile robots to unload 700 cases per hour. DHL intends to add 1,000 Boston Dynamics units to a logistics network already running 200,000 smart devices, highlighting at-scale commercialization. Demand for intelligence that balances picker workloads and shortens cycle times links directly to revenue protection, embedding robotics in core operating models. Generative AI now recalculates route plans every few minutes, cutting travel distances and enabling profitable same-day shipping.
Increased Government and Defense Spend on Unmanned Systems
The U.S. Department of Defense earmarked USD 25.2 billion for AI and autonomy in FY 2025, tripling outlays since 2019. The Replicator initiative targets thousands of low-cost uncrewed assets by August 2025, catalyzing supplier ecosystems with dual-use spin-offs. Similar stimulus arises in China’s 14th Five-Year Plan, which fuses military and civil robotics development on a multi-decade horizon. Defense demand subsidizes high-reliability sensor suites subsequently commercialized in inspection, mining, and emergency-response applications, reinforcing growth across the broader commercial robotics market.
Restraints Impact Analysis*
| Restraint | (~) % Impact on CAGR Forecast | Geographic Relevance | Impact Timeline |
|---|---|---|---|
| High up-front cost of robotic systems | -2.8% | Global, intense for SMEs in developing markets | Short term (≤ 2 years) |
| Cyber-security vulnerabilities in connected robots | -1.9% | Global, critical infrastructure sectors | Medium term (2-4 years) |
| Supply-chain risk for rare-earth permanent magnets | -1.6% | Global, sharp for precision manufacturers | Long term (≥ 4 years) |
| Shortage of skilled integrators and technicians | -1.4% | Primarily North America and EU, expanding globally | Medium term (2-4 years) |
| Source: Mordor Intelligence | |||
High Up-front Cost of Robotic Systems
Total deployment budgets still top USD 100,000 once integration and training are included, delaying adoption for smaller firms. Robot-as-a-Service contracts help flatten capital curves by bundling equipment, software, and maintenance into monthly fees. Tennant’s USD 32 million agreement with Brain Corp underpins 6,500 autonomous cleaning units already in service, proving subscription models in facility care. Modular designs and standardized interfaces aim to trim engineering hours, but ecosystem tooling remains nascent, especially in emerging economies where integrator networks are thin.
Cyber-security Vulnerabilities in Connected Robots
Robots linked into operational technology networks expand the attack surface. Studies using Random Forest classifiers identify firmware exploitation as the dominant threat path, calling for IEC 62443 compliance throughout design and deployment. The EU’s NIS2 directive raises mandatory safeguards, adding cost layers that may slow orders until vendors certify hardened architectures. TÜV Rheinland advises integrating security by design, but many installers still treat cyber-hardening as a post-commissioning add-on, risking downtime and reputational damage.
*Our forecasts treat driver/restraint impacts as directional, not additive. The impact forecasts reflect baseline growth, mix effects, and variable interactions.
Segment Analysis
By Component: Hardware Dominance Faces Software Disruption
Hardware generated 65.90% of 2025 revenue, underscoring the capital intensity of actuators, drives, and sensor payloads that form each robotic platform’s physical backbone. Yet software posted a 21.45% CAGR, reflecting enterprise migration toward intelligence-defined value. Over 80% of ABB’s portfolio now bundles AI features that enable real-time path planning, dynamic force control, and digital twin-based simulation. Services contributed residual revenue but are widening as installed bases mature.
Software gains illustrate a strategic pivot. As hardware components commoditize, algorithm stacks dictate differentiation. Amazon’s tactile-sensor-equipped Vulcan robot moves 75% of stock-keeping units once reserved for human pickers, a feat impossible without advanced gripping software. Consequently, the commercial robotics market size for software is projected to outpace mechanical build spend by late decade, reshaping supplier power balances and enabling subscription monetization.


By Type of Robot: Drones Lead While Medical Robots Surge
Drones accounted for 37.45% of 2025 turnover, buoyed by inspection, mapping, and last-mile delivery services authorized under FAA Part 108 rules that permit beyond-visual-line-of-sight flights.Medical platforms posted the swiftest rise at 20.95% CAGR, with hospitals installing additional da Vinci systems to satisfy minimally invasive procedure demand. Intuitive Surgical recorded USD 2.25 billion Q1 2025 revenue on a 15% system-base expansion.
The category shift underscores healthcare’s appetite for precision and demographic-driven eldercare requirements. Meanwhile, field robots demonstrate traction in agriculture and construction, while autonomous guided vehicles dominate structured industrial pathways. Portfolio diversity signals that the commercial robotics market will rely on multi-modal platform growth rather than single-category dominance.
By Application: Defense Leads, Agriculture Accelerates
Defense and security platforms secured 31.85% of 2025 revenue, anchored by multi-year procurement contracts and readiness mandates. Agriculture and forestry posted a 20.3% CAGR, propelled by autonomous tractors that cultivate over 50,000 acres with centimeter precision. Medical, warehouse, and marine applications round out demand as each sector leverages autonomy to offset labor constraints.
Agriculture’s acceleration reflects growers’ need to bridge a 2.4 million labor deficit while managing input costs and sustainability targets. Vision-guided implements can target weeds with selective spraying, reducing herbicide use 80% and improving environmental compliance. As regulatory bodies finalize frameworks for field robot safety, the commercial robotics market anticipates rapid scale-out across row crops and specialty produce.
By Mobility: Mobile Ground Robots Dominate
Mobile ground robots held 57.10% share in 2025, favored for factory, retail, and airport logistics where existing floor layouts support autonomous navigation. Aerial robots, however, are advancing at a 21.2% CAGR as battery densities climb and regulatory thresholds ease. American Robotics received an FAA waiver that eliminates visual observers, a milestone that slashes operating cost per flight-hour.
Stationary robotic arms remain vital for high-precision assembly, while underwater vehicles such as Nauticus Robotics’ Aquanaut Mk2 cut greenhouse gas emissions in offshore inspection by replacing crewed vessels. This mixed-mobility landscape reinforces the commercial robotics market outlook, ensuring that capex is spread across varied locomotion form factors.
Geography Analysis
North America retained 36.10% revenue leadership in 2025, driven by defense outlays and hyperscale e-commerce deployments that utilize extensive autonomous fleets. Funded research programs and venture capital clusters accelerate commercialization cycles, enabling rapid transition from pilot projects to full plant-scale installations. Technology exports from Silicon Valley further support platform standardization in Canada and Mexico.
Asia-Pacific posts the steepest trajectory at 20.95% CAGR through 2031. China's pledge to inject nearly USD 138 billion backs industrial robot supply chains, raising indigenous supplier share from 30% to 47% between 2020 and 2023. National plans in Japan and South Korea collectively allocate more than USD 1 billion for humanoid and manufacturing-grade robots, channeling public-private partnerships into commercialization. Rapid urbanization and wage escalations across Southeast Asia further cultivate adoption among local manufacturers seeking productivity gains.
Europe remains a mature but innovation-active market, combining established automotive automation with stringent safety standards. The region's fit-for-55 emissions plan favors service robots that optimize energy and waste footprints. Middle East and Africa and South America remain nascent, constrained by integrator scarcity and limited financing. Nonetheless, port automation projects and mining robots are slowly catalyzing pilot orders that foreshadow longer-term demand.

Regulatory Landscape
Commercial robotics deployments are increasingly shaped by EU AI and machinery safety requirements. The EU AI Act (Regulation (EU) 2024/1689) sets out high-risk obligations for certain AI systems, with key high-risk requirements under Annex I applying from August 2, 2027. For AI-enabled robots used in workplaces and critical services, the timeline will affect documentation, risk management, and post-market monitoring.
Safety compliance is also tightening through product legislation and standards updates. The EU Machinery Regulation (Regulation (EU) 2023/1230) becomes applicable from January 14, 2027, and ISO 10218-1:2025 and ISO 10218-2:2025 entered into force on April 1, 2025, consolidating collaborative application requirements within core industrial robot safety standards. In May 2026, EU Council and Parliament negotiators reached a provisional agreement on a Digital Omnibus on AI to streamline interactions between the AI Act and machinery compliance. The EU Product Liability Directive (Directive (EU) 2024/2853) requires Member State transposition by December 9, 2026, reinforcing traceability and evidence preservation expectations across the robotics lifecycle.
Value Chain Analysis
The commercial robotics value chain runs from component suppliers (sensors, compute, batteries, motors, gearboxes, and precision motion parts) to robot OEMs (industrial arms, AMRs, drones, medical and field robots), software and AI stack providers, system integrators, and end users across logistics, manufacturing, healthcare, agriculture, defense, and offshore. Component availability and qualification, especially for precision motion elements such as harmonic reducers and linear guides, increasingly determine lead times and scaling, while rare-earth permanent magnets remain a strategic input risk for high-performance actuation.
A parallel humanoid and general-purpose robot supply chain is also forming, with visible clustering around Chinese manufacturing hubs for screws, reducers/servos/controllers, and tactile sensing and dexterous hands. This structure supports faster iteration cycles and specialization among suppliers. OEM strategies remain split between modularization and proprietary control, with more external sourcing for structural parts and compute modules, while actuation and force sensing are more often developed in-house to protect performance and safety margins. Downstream, Robot-as-a-Service models increasingly bundle hardware, software, and services, shifting the emphasis to field support networks and data pipelines for ongoing software improvement.
Competitive Landscape
The commercial robotics market shows moderate fragmentation as legacy automation vendors, AI-native startups, and vertically integrated tech conglomerates contest share. ABB, FANUC, and KUKA face margin compression amid software-centric business models, prompting ABB to pursue a USD 2.3 billion spin-off to sharpen focus.[3]ABB, “Software Share in Robotics Portfolio Surpasses 80%,” abb.com FANUC’s 16% slide in industrial robot shipments signals that low-code rivals are encroaching on traditional volume segments.
Technology giants leverage internal use cases as commercialization bases. Amazon’s warehouse fleets generate operating data that shortens product-development cycles, while Alphabet’s Intrinsic repurposes humanoid capabilities originally incubated inside Google X. Automotive OEMs pursue vertical moves: Hyundai completed its USD 1.1 billion Boston Dynamics acquisition, pairing robotics with electric-vehicle manufacturing synergies.
Emerging specialists focus on niche adjacencies. Apptronik collaborates with Jabil to mass-produce Apollo humanoids, targeting high-mix manufacturing cells with dexterous handling requirements. Nauticus Robotics applies subsea autonomy to reduce offshore inspection emissions, winning pilot engagements with global energy operators. These strategic pockets highlight room for differentiated value propositions even as consolidation pressures rise.
Commercial Robotics Industry Leaders
Yaskawa Electric Corporation
Northrop Grumman Corporation
Kuka AG
iRobot Corporation
Omron Adept Technologies Inc.
- *Disclaimer: Major Players sorted in no particular order

Market Opportunities and Future Outlook
Warehouse and logistics automation continues to be a key monetization path for commercial robotics. In June 2026, Amazon announced a 10 billion euro investment program for European fulfillment centers and referenced deployments including Proteus mobile robots and tote handling systems. The focus on brownfield retrofits points to ongoing demand for interoperable fleets, safety certification, and integrator capacity across multiple countries.
Industrial and service robotics suppliers also have room in AI-defined automation software and data-efficient deployment tooling, as buyers move from single-task automation to more general-purpose manipulation and rapid re-tasking. The expanded collaboration announced in June 2026 between Kawasaki Robotics and Dexterity around an 8-degree-of-freedom arm for trailer loading and unloading supports this shift toward flexible handling use cases. In July 2026, Nomagic announced new AI development capacity, including a new AI lab, to accelerate perception and control stacks for warehouse robots. On compliance requirements, the industry’s move toward ISO 10218:2025 aligned safety architectures, alongside the EU Machinery Regulation applicability from 2027, increases demand for pre-certified safety functions, validated human-robot collaboration methods, and cybersecurity-by-design engineering across global product lines.
Recent Industry Developments
- June 2026: Yaskawa Electric Corporation launched MOTOMAN-GP215L, GP400L, and GP700 industrial robots aimed at heavy-material handling use cases, including automotive production. The additions broaden Yaskawa's high-payload portfolio and support factories shifting to heavier workpieces and higher throughput requirements.
- May 2026: Northrop Grumman advanced its Mission Robotic Vehicle (MRV) program toward a summer 2026 launch for in-space commercial servicing, including refueling and life-extension for geostationary satellites. The step signals maturation of commercial space robotics capabilities that can extend into inspection, autonomous operations, and mission-critical reliability standards used across other commercial robotics domains.
- March 2026: KUKA unveiled the KUKA Automation Management Platform (KUKA AMP) at NVIDIA GTC 2026, positioning it around physical AI and intent-based automation workflows. The release strengthens the software layer around industrial robotics, supporting faster commissioning and tighter links between AI models and real-world production environments.


Research Methodology Framework and Report Scope
Market Definition and Coverage
This market covers revenue generated from robots used in commercial and institutional settings, where automation supports service delivery, inspection, logistics movement, agriculture, security, and medical tasks. It includes related software and services when they are sold with, or directly tied to, these deployed robotic systems.
Scope exclusions: We exclude consumer-only home robots and hobby drones that are bought mainly for personal recreation.
Segmentation Overview
- By Component
- Hardware
- Software
- Services
- By Type of Robot
- Drones / UAVs
- Field Robots
- Medical Robots
- Autonomous Guided Robots
- Other Types
- By Application
- Medical and Healthcare
- Defense and Security
- Agriculture and Forestry
- Marine and Offshore
- Warehousing and Logistics
- Other Applications
- By Mobility
- Stationary Robots
- Mobile Ground Robots
- Aerial Robots
- Marine / Underwater Robots
- By Geography
- North America
- United States
- Canada
- Mexico
- Europe
- Germany
- United Kingdom
- France
- Italy
- Spain
- Rest of Europe
- Asia-Pacific
- China
- Japan
- India
- South Korea
- Australia
- Rest of Asia-Pacific
- South America
- Brazil
- Argentina
- Rest of South America
- Middle East and Africa
- Middle East
- Saudi Arabia
- United Arab Emirates
- Turkey
- Rest of Middle East
- Africa
- South Africa
- Egypt
- Nigeria
- Rest of Africa
- Middle East
- North America
Data Sources, Market Sizing, and Validation
Desk Research
Desk work starts by setting the market perimeter and building a fact base that can be checked in public sources. We review robotics shipment and installation signals, safety and operating guidelines, and trade flows for key subsystems, and then map them to commercial adoption use cases.
Commonly used inputs include public sources such as International Federation of Robotics releases, US Bureau of Labor Statistics data, US International Trade Commission trade statistics, Eurostat indicators, and OECD industry data, along with peer reviewed robotics and medical device journals where relevant. We also use company annual reports, earnings call transcripts, investor presentations, and reputable press coverage to understand product mix and revenue exposure. In a few places, paid subscriptions for company financials and intelligence, patent databases, and shipment-level import export records are used to validate coverage and reduce missed players. These desk sources are illustrative and not exhaustive, since many other public references are also used for cross-checking and clarification.
Primary Interviews and Surveys
Primary work is used to pressure test the desk assumptions on what is being bought, how pricing is moving, and which applications are scaling faster. We speak with a mix of robot OEMs, component and software providers, system integrators, and large end users across healthcare, warehousing, agriculture, and security, and then we confirm regional patterns across APAC, EMEA, and the Americas.
Distribution of primary research fieldwork respondents
| Company type | Respondent position | Region |
|---|---|---|
| Top tier: 35% | CXOs: 13% | APAC: 45% |
| Mid tier: 51% | Functional/Unit leaders: 31% | EMEA: 29% |
| Smaller Players: 14% | Managers: 56% | Americas: 26% |
Market-Sizing & Forecasting
Sizing begins with a top-down build where adoption by major commercial application pools is reconstructed from install base signals, procurement activity, and the pace of automation rollouts, and then translated into revenue using typical system pricing and service attachment rates. The totals are corroborated with selective bottom-up approximations, where sampled supplier revenues, channel checks, and ASP times volume estimates are used to validate the output and adjust obvious gaps.
Key model inputs include the annual deployment pace of autonomous mobile robots in warehouses, procedure volumes and capital budgets that influence medical robot purchasing, agriculture mechanization indicators for field robots, drone utilization patterns in inspection and security, and average selling price bands by robot category and payload. When a bottom-up view is incomplete for smaller suppliers, the gap is handled through share-of-market expansion from verified regional lists and by applying conservative revenue density assumptions to known shipment or install signals.
For forecasting, we mainly use scenario analysis supported by a light multivariate regression overlay, because demand is sensitive to labor cost pressure, enterprise capex cycles, and regulatory acceptance in safety-critical use cases. Assumptions on price erosion, service attach rates, and regional ramp-ups are finalized after being reviewed with primary respondents, and they are kept consistent with observable adoption constraints.
Data Validation & Update Cycle
Validation is done by triangulating the model output against independent signals such as robotics shipment commentary, trade and production indicators for key parts, and disclosed revenue direction from relevant public companies. When outliers appear, the drivers are rechecked, and follow-up conversations are triggered to confirm whether the variance is caused by a one-time project, a pricing shift, or a scope mismatch.
Before sign-off, the model is reviewed in multiple steps by different analysts, with checks on year-to-year continuity, regional totals, and category-level realism. The report is refreshed annually, and interim updates are made when material events occur (for example, major regulation changes or sudden demand shocks). Right before delivery, we do a fresh pass so the final numbers reflect the latest available information.
Mordor Intelligence's Commercial Robotics Market Size Versus Other Published Estimates
Published market values for commercial robotics can look far apart even when they describe similar use cases, because the scope lines are not the same and the timing of the base year differs. Differences in what gets counted as part of a robotic system, how services are treated, and how currency and inflation are handled also create real spread.
Consumer-grade home robots and personal recreation drones sit outside Mordor Intelligence's scope, which is one reason the size can diverge versus sources that mix personal and professional demand or combine adjacent automation categories. Another frequent gap comes from how service revenue and software subscriptions are counted, since some estimates stick to hardware shipments only, while others apply broad markups without checking attachment rates by application. We also see variation from base-year selection and refresh cadence, where older estimates may not reflect recent hospital procurement cycles, warehouse automation project timing, or post-pandemic normalization in certain end markets.
Benchmark comparison
| Source | Market Size | Gaps in Research Methodology |
|---|---|---|
| Mordor Intelligence | USD 28.21 B (2026) | |
| Global Publisher A | USD 27.31 B (2024) | Uses an earlier base year and a longer forecast window, and the public summary does not clearly state whether software and services are included consistently across robot types. |
| Industry Publisher B | USD 24.99 B (2024) | Anchors on 2024 sizing and provides limited visibility on service attach assumptions, which can understate total value when integration and recurring support are meaningful in healthcare and logistics deployments. |
The table shows that year selection and what is counted around the robot (software, services, and integration) typically explain most of the spread. By keeping the scope tied to commercial deployments and checking price and attachment assumptions with market participants, our estimate stays traceable to clear demand indicators and can be repeated as conditions change.


Key Questions Answered in the Report
What is the projected value of the commercial robotics market by 2031?
The market is forecast to reach USD 70.34 billion by 2031.
Which application currently leads the commercial robotics market?
Defense and security platforms lead, accounting for 31.85% of 2025 revenue.
Why is Asia-Pacific expected to be the fastest-growing region?
Asia-Pacific benefits from China’s long-term USD 138 billion investment plan and expanding manufacturing automation.
How quickly are software revenues growing within the commercial robotics market?
Software is expanding at a 21.45% CAGR, outpacing hardware as AI capabilities become central to customer value.
What is the largest mobility segment in the commercial robotics market?
Mobile ground robots dominate with 57.10% share, driven by widespread warehouse and factory adoption.
How are high up-front costs being mitigated for smaller enterprises?
Robot-as-a-Service contracts and modular, standardized integration platforms are reducing initial capital expenditure and deployment complexity.
Page last updated on:


