Market Overview
| Study Period | 2020 - 2031 |
|---|---|
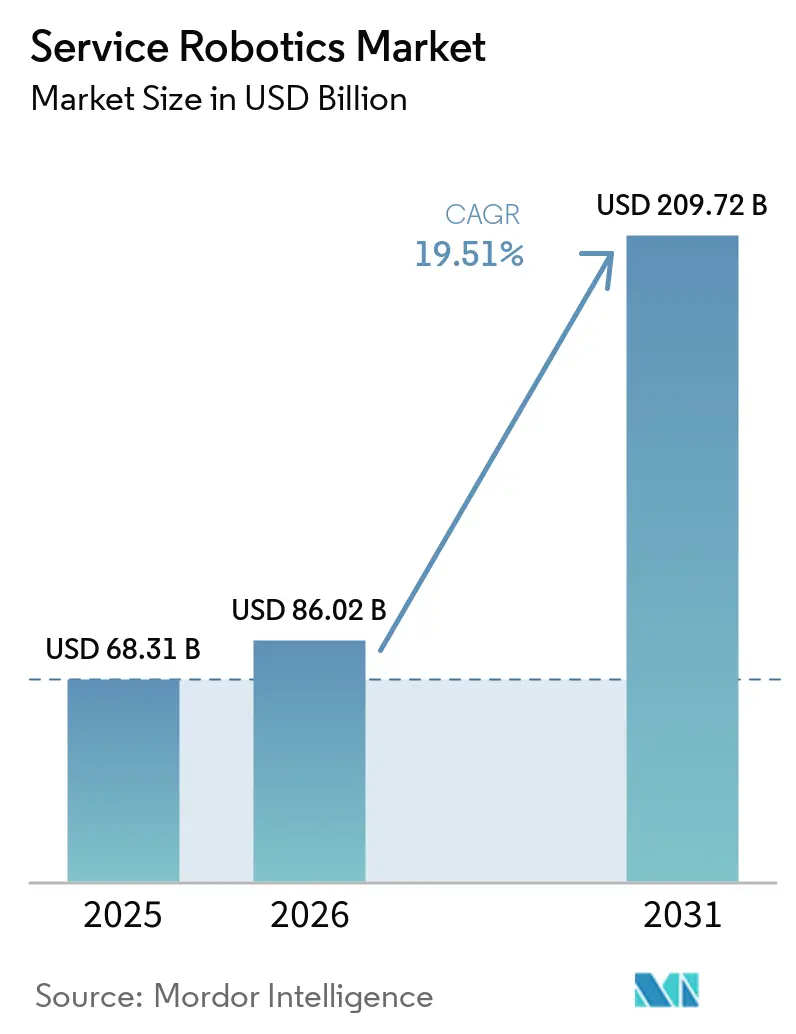
| Market Size (2026) | USD 86.02 Billion |
| Market Size (2031) | USD 209.72 Billion |
| Growth Rate (2026 - 2031) | 19.51% CAGR |
| Fastest Growing Market | Asia Pacific |
| Largest Market | Asia Pacific |
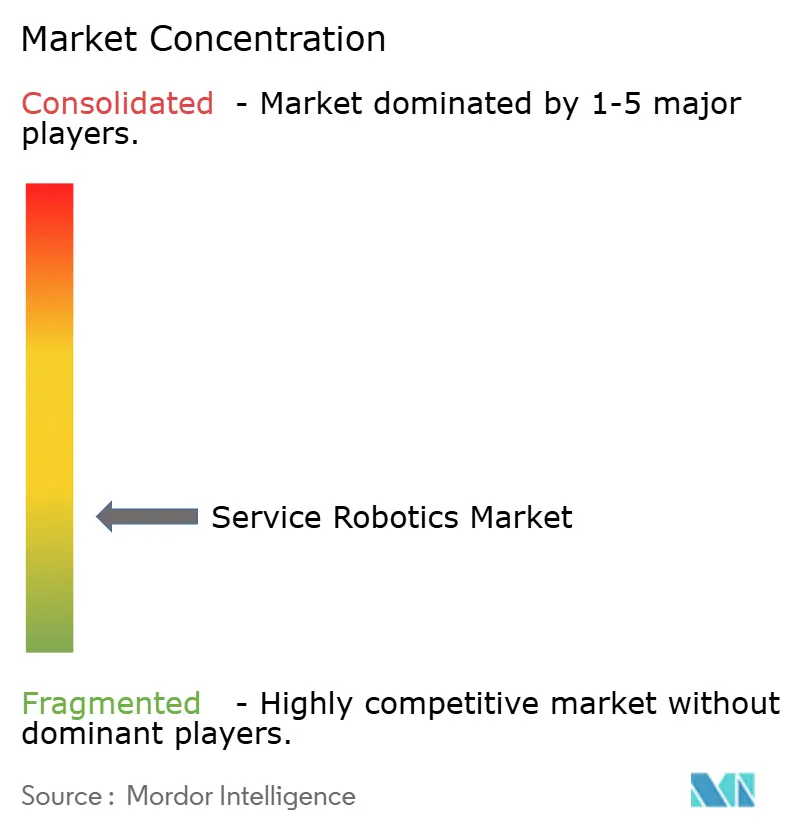
| Market Concentration | Low |
Major Players.webp) *Disclaimer: Major Players sorted in no particular order Image © Mordor Intelligence. Reuse requires attribution under CC BY 4.0. | |
Service Robotics Market Analysis by Mordor Intelligence
The service robotics market size was valued at USD 68.31 billion in 2025 and is estimated to grow from USD 86.02 billion in 2026 to reach USD 209.72 billion by 2031, at a CAGR of 19.51% during the forecast period (2026-2031). Intensifying labor shortages, hospital backlogs, and e-commerce fulfillment pressures are pushing organizations toward autonomous platforms that shrink task cycle times by up to 70% and cut per-unit costs in half. Professional deployments, led by logistics and surgical systems, already account for more than half of global revenue, while robot-as-a-service (RaaS) contracts are broadening access for small and medium enterprises that once lacked capital budgets. Asia-Pacific remains the fastest-growing geography, underpinned by China’s Made in China 2025 program and Japan’s elder-care subsidies, whereas North America anchors demand for commercial drones following the Federal Aviation Administration's expansion of beyond-visual-line-of-sight waivers. Competitive activity is accelerating as incumbents such as ABB, Omron, and Daifuku purchase specialist integrators to close capability gaps, even as lithium-battery shipping rules lengthen lead times and inflate cross-border logistics costs.
Key Report Takeaways
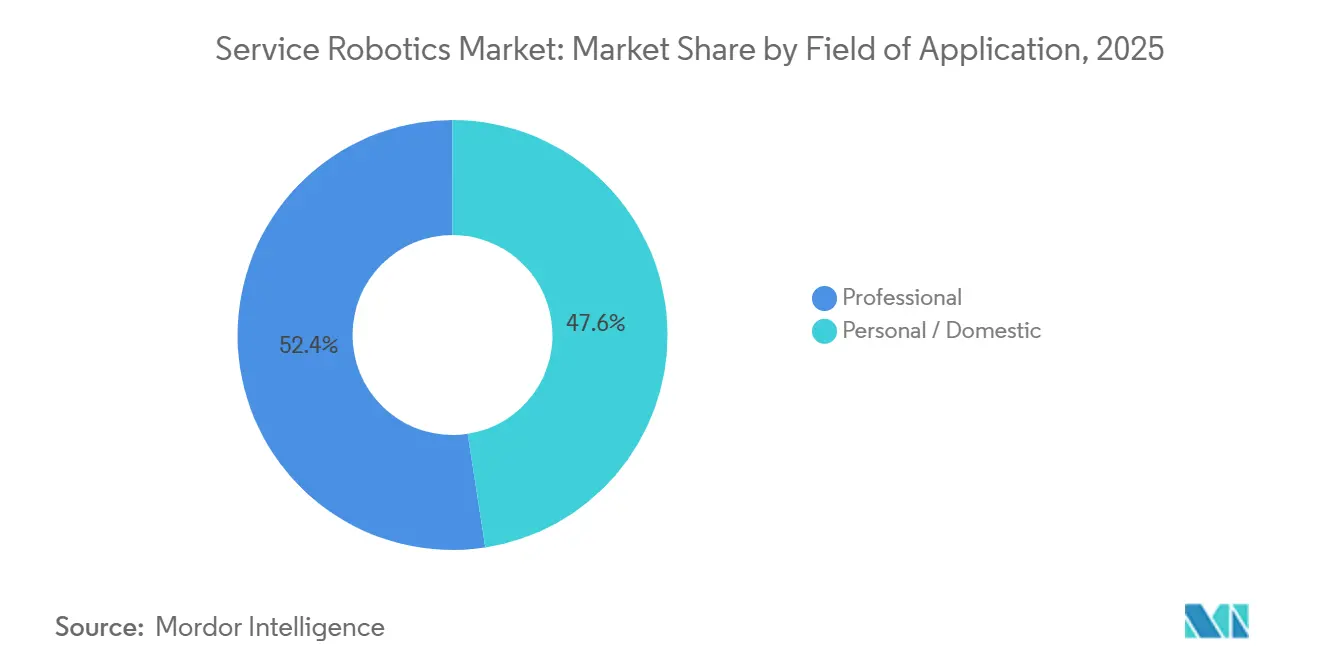
- By field of application, professional robots led with 52.44% revenue share in 2025 and are projected to expand at a 20.89% CAGR through 2031.
- By component, hardware accounted for 66.89% of the service robotics market share in 2025, whereas services are set to record the highest CAGR at 20.29% through 2031.
- By operating environment, ground-based platforms accounted for 79.34% of the service robotics market share in 2025, while aerial systems are forecast to grow the fastest, at a 20.23% CAGR, to 2031.
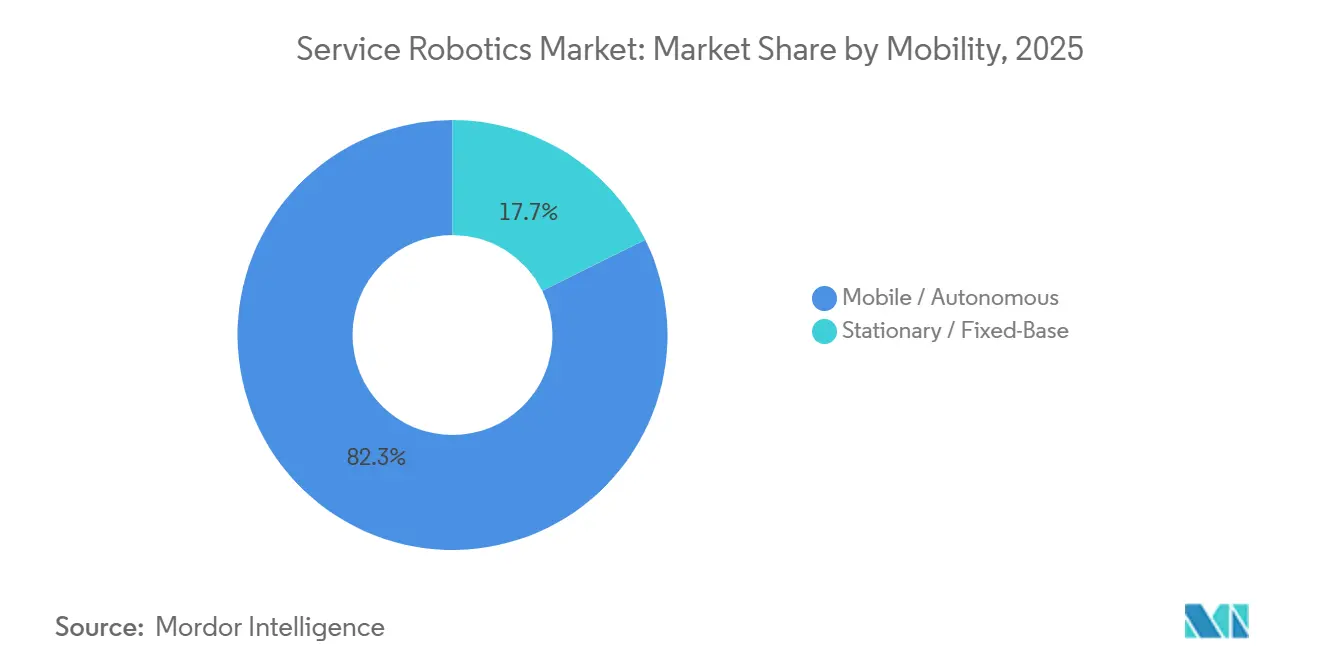
- By mobility, autonomous systems represented 82.31% of the service robotics market share in 2025 and continue to advance at a 19.96% CAGR through 2031.
- By end-user industry, logistics and warehousing accounted for 47.67% of demand in 2025, whereas healthcare is projected to post the fastest 20.91% CAGR through 2031.
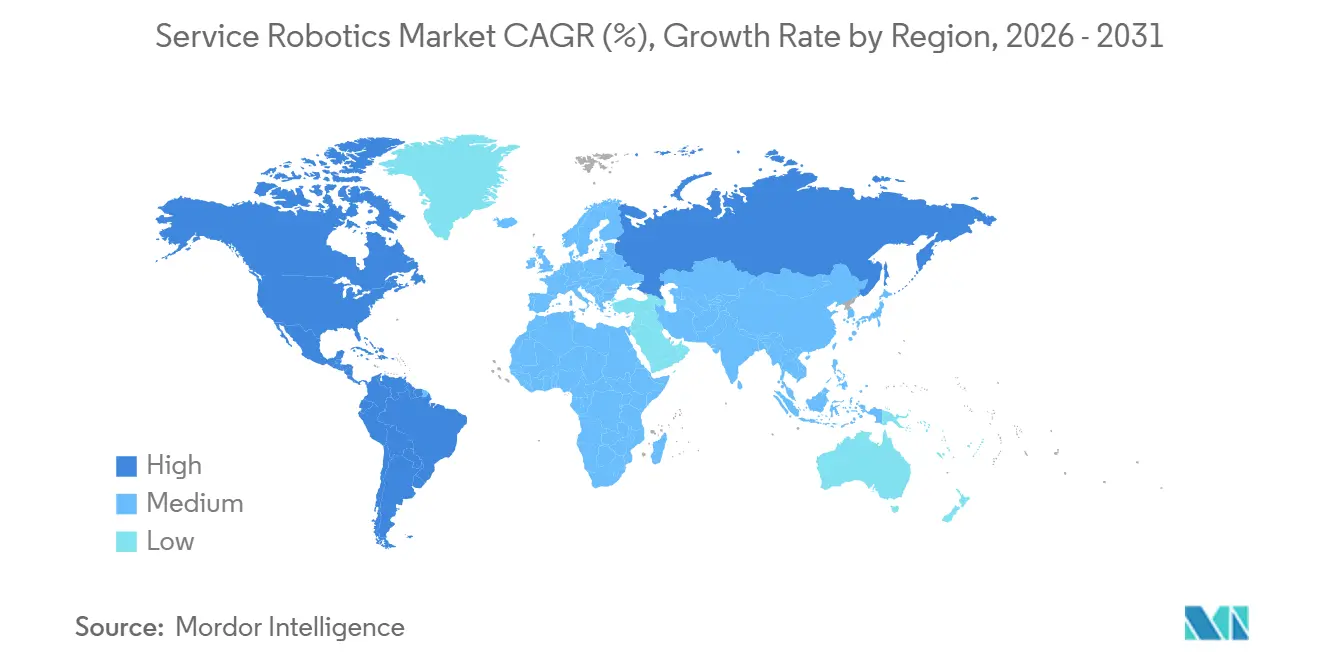
- By geography, Asia-Pacific dominated with a 38.28% share in 2025 and is predicted to accelerate at a 20.57% CAGR through 2031.
Note: Market size and forecast figures in this report are generated using Mordor Intelligence’s proprietary estimation framework, updated with the latest available data and insights as of January 2026.
Global Service Robotics Market Trends and Insights
Drivers Impact Analysis*
| Driver | (~) % Impact on CAGR Forecast | Geographic Relevance | Impact Timeline |
|---|---|---|---|
| Growing Demand for Automation in Healthcare, Logistics and Agriculture | +3.8% | Global, with concentration in North America, Europe, and Asia-Pacific | Medium term (2-4 years) |
| Rising Labor Shortages and Aging Population | +3.2% | North America, Europe, Japan, South Korea | Long term (≥ 4 years) |
| Rapid AI-Sensor Convergence Lowers Robot TCO | +2.9% | Global, led by Asia-Pacific manufacturing hubs | Short term (≤ 2 years) |
| Robot-as-a-Service (RaaS) Subscriptions Unlock SME Adoption | +2.4% | North America, Europe, with expansion to Latin America and Middle East | Medium term (2-4 years) |
| Eldercare Insurance Reimbursements for Assistive Robots | +1.8% | Germany, Netherlands, Japan, South Korea | Long term (≥ 4 years) |
| Dark-Store Micro-Fulfillment Boom Needs AMRs | +2.1% | North America, Europe, urban centers in Asia-Pacific | Short term (≤ 2 years) |
| Source: Mordor Intelligence | |||
Growing Demand for Automation in Healthcare, Logistics, and Agriculture
Hospitals performed more than 2 million robotic procedures in 2025 as da Vinci and Hugo systems expanded their indications, shortening operating room turnover and increasing surgical throughput.[1]Intuitive Surgical, “Form 10-K 2025,” sec.gov Peak-season e-commerce volumes pushed Amazon’s robot fleet past 750,000 units, trimming pick times below 30 seconds and setting a new productivity benchmark. On farms, autonomous tractors equipped with real-time kinematic GPS extended operating windows to 24 hours, improving land utilization by 40%. Component vendors now reuse sensors across sectors, driving scale economies that depress unit prices and compress deployment cycles from years to months. This tri-sector pull reinforces the service robotics market's growth trajectory.
Rising Labor Shortages and Ageing Population
OECD members will lose 15 million workers between 2025 and 2030, intensifying competition for warehouse and caregiving staff.[2]OECD, “Employment Outlook 2025,” oecd.org Japan projects a 690,000-worker elder-care gap by 2030 and now reimburses up to 90% of assistive robot costs, accelerating sales of transfer and bathing devices. Germany’s statutory insurers offer EUR 5,000 (USD 5,650) per unit, broadening the addressable household market. In U.S. hospitality, 1.9 million vacancies prompted hotels to deploy delivery robots, freeing staff for revenue-generating guest services. Demographic pressure, therefore, acts as a durable catalyst for the service robotics market.
Rapid AI-Sensor Convergence Lowers Robot TCO
Component prices fell 60% between 2022 and 2025 as lidar and vision chips migrated to 7 nm nodes, cutting navigation stack bills of materials to under USD 1,000.[3]International Federation of Robotics, “World Robotics 2025,” ifr.org Boston Dynamics integrated NVIDIA Jetson Orin, enabling on-board perception that navigates rubble-strewn construction sites in real time. Open-source ROS 2 libraries shrink development cycles to 18-24 months, while the average 5-year TCO for warehouse robots dropped to USD 45,000, half the 2020 level. Lower lifetime costs expand the viable user base and reinforce adoption momentum.
Robot-as-a-Service (RaaS) Subscriptions Unlock SME Adoption
Monthly fees start at USD 1,500 for cleaning robots and USD 3,000 for mobile warehouse units, turning lumpy capex into predictable opex and slashing payback periods below 18 months for Locus Robotics customers. Seegrid reported that 70% of 2025 contracts were RaaS, confirming appetite among budget-constrained operators. Subscription bundles also include updates and maintenance, reducing downtime risks that once deterred small businesses. By easing financial and technical barriers, RaaS accelerates penetration of the service robotics market.
Restraints Impact Analysis*
| Restraint | (~) % Impact on CAGR Forecast | Geographic Relevance | Impact Timeline |
|---|---|---|---|
| High CAPEX and Maintenance Costs | -2.1% | Global, particularly acute in emerging markets | Medium term (2-4 years) |
| Safety-Cybersecurity Compliance Burden | -1.6% | North America, Europe, with increasing scrutiny in Asia-Pacific | Long term (≥ 4 years) |
| Lithium-Battery Shipping Rules Limit Mobile Robots | -1.2% | Global, with highest impact on cross-border trade | Short term (≤ 2 years) |
| VC Funding Correction for Consumer-Robotics Start-ups | -0.9% | North America, Europe | Short term (≤ 2 years) |
| Source: Mordor Intelligence | |||
High CAPEX and Maintenance Costs
Surgical robots still cost USD 1.5-2.5 million, plus USD 150,000-200,000 yearly service contracts, constraining uptake to high-volume urban hospitals. Warehouses need fleets of 20-50 units, implying USD 1-2.5 million outlays before integration. 40% of operators cite budget ceilings as their top barrier, despite 24-month ROI models. Lithium-ion batteries require USD 5,000-8,000 in replacement costs every 3-4 years, and specialized technicians remain scarce outside major hubs. These costs slow diffusion in price-sensitive segments.
Safety-Cybersecurity Compliance Burden
ISO 13482 risk assessments and EU Machinery Regulation conformity tests add up to 20% to development budgets and can delay launches by a year. The U.S. Cybersecurity and Infrastructure Security Agency recommends encryption and role-based access controls, yet a 2025 ICS-CERT report documented 14 robot breaches in warehouses. New certification layers increase engineering overhead and lengthen sales cycles, especially for startups with limited resources.
*Our forecasts treat driver/restraint impacts as directional, not additive. The impact forecasts reflect baseline growth, mix effects, and variable interactions.
Segment Analysis
By Field of Application: Professional Platforms Drive Revenue Uptick
Professional service robots captured 52.44% of the service robotics market share in 2025, reflecting sustained investment in logistics automation and surgical suites. Logistics platforms remain the largest revenue pool because autonomous mobile robots cut pick-and-pack cycle times by 50-70%, while surgical systems add high-margin disposables, thereby increasing lifetime value. Field agriculture robots are gaining ground as autonomous tractors extend planting windows and drone scouts push yield-forecast accuracy past 90%. Inspection units for oil, gas, and telecom towers reduce confined-space exposure, keeping insurance premiums in check. Together, these use cases anchor professional demand and expand the overall service robotics market.
Consumer acceptance of domestic platforms also rose in 2025, as robotic vacuums and lawn mowers shipped 15 million units, yet their revenue base remains smaller than that of professional peers. Insurance-backed elder-assist robots outsell entertainment models in Japan and Germany because reimbursement covers up to USD 5,650 per device. Construction robots that automate demolition and concrete finishing grew briskly after contractors faced stricter OSHA limits on airborne contaminants. Security and rescue robots, along with underwater inspection vehicles, round out a diversified yet still emerging personal portfolio.


By Component: Services Outpace Hardware Expansion
Hardware represented 66.89% of 2025 revenue, driven by falling lidar and vision-chip prices that widened adoption in budget-sensitive industries. Multi-modal sensor suites and brushless DC drives improved energy efficiency by up to 30%, while lithium-iron-phosphate batteries reduced the risk of thermal runaway. Standardization around open-source ROS 2 trimmed integration lead times from years to months, helping vendors scale deliveries without custom firmware rewrites. These advances keep hardware dominant but steadily less differentiated.
The services stack, including software, fleet management, and predictive maintenance, is projected to expand at a 20.29% CAGR through 2031, the fastest rate across components. Robot-as-a-service bundles let small and medium enterprises avoid large capital outlays with monthly fees starting at USD 1,500, pushing subscription penetration past 70% of Seegrid’s new contracts. AI analytics that optimize path-planning and battery scheduling deliver 10-15% throughput gains, cementing software’s role as the top differentiator. Over a five-year life, service revenues often triple the original hardware invoice, tilting future profit pools toward code and cloud platforms.
By Operating Environment: Aerial Uptick Challenges Ground Dominance
Ground-based units held 79.34% of deployments in 2025, benefiting from smooth floors and controlled lighting in warehouses, hospitals, and retail aisles. Advanced simultaneous localization and mapping delivers centimeter-level accuracy without reflectors or magnetic tape, enabling operators to reconfigure layouts overnight. Hospitals leverage ground robots for medication delivery and linen transport, reducing nurses' walking distance by 25% per shift. Retailers use shelf-scanning units to reduce out-of-stock incidents, lifting same-store sales by low single digits.
Aerial platforms register the top growth trajectory at a 20.23% CAGR through 2031 after the Federal Aviation Administration issued 12,000 beyond-visual-line-of-sight waivers in 2025. Utilities use drones for power-line inspections, replacing helicopter flights at one-tenth the cost, and farms mount multispectral cameras to fine-tune nitrogen dosing. The European Union Aviation Safety Agency adopted a similar risk-assessment framework that cuts approval lead times below 90 days. Marine robots remain niche due to pressure-resistant housings, but offshore wind operators still accept the premium to avoid diver deployments in high-current waters.
By Mobility: Autonomous Systems Command Installations
Autonomous platforms accounted for 82.31% of installations in 2025, underscoring a structural shift away from fixed automation toward flexible fleets. Lidar-camera fusion enables real-time obstacle avoidance in mixed-traffic aisles, so facilities no longer need fenced-off robot zones. As a result, brownfield warehouses integrate fleets in weeks, not months, and report 15-20% higher throughput immediately after go-live. Hospitals further favor mobile medication carts that synchronize with electronic health records, trimming prescription errors.
Fixed-base robots maintain a foothold in tasks that require sub-millimeter precision or sterile conditions. Intuitive Surgical’s da Vinci system completed more than 2 million procedures in 2025 and still anchors high-acuity operating rooms. Clean-room fabs mount articulated arms on rails to handle wafers without particle contamination. Hybrid designs now merge the two worlds, ABB’s YuMi, mounted on a self-navigating base, restocks shelves and performs assembly within the same shift. These blended models signal the next evolution in the service robotics market size.
By End-User Industry: Logistics Leads, Healthcare Gains Velocity
Logistics and warehousing contributed 47.67% of 2025 demand after Amazon’s fleet surpassed 750,000 mobile robots, trimming order-fulfillment costs by 18%. Third-party logistics providers like DHL replicate the model to meet one-day delivery promises, while grocery retailers adopt micro-fulfillment robots to complete online orders in under 5 minutes. These gains cement logistics as the anchor tenant in the service robotics market.
Healthcare is set to post the quickest 20.91% CAGR as single-port surgical systems shorten length of stay and elder-care policies in Germany and the Netherlands reimburse up to USD 5,650 per assistive robot. Agriculture climbs on autonomous tractors that extend working hours, and construction firms deploy demolition robots to comply with OSHA silica-dust limits. Defense customers fund uncrewed ground vehicles for perimeter patrol, while hotels experiment with delivery robots in cities where hourly wages are near USD 20. Education and entertainment remain small niches but are gaining visibility as schools adopt STEM kits and museums add interactive exhibits.
Geography Analysis
Asia-Pacific captured 38.28% of 2025 revenue and is projected to grow at a 20.57% CAGR through 2031, making it the largest and fastest region for the service robotics market. China produced over 500,000 service robots in 2025, and government subsidies now underwrite installations in healthcare and logistics. Japan’s Long-Term Care Insurance covers up to 90% of certified elder-assist devices, stimulating domestic production by Panasonic and SoftBank Robotics. South Korea launched a KRW 1 trillion (USD 750 million) program to seed 50,000 service robot deployments by 2028, while India’s e-commerce fulfillment centers experiment with autonomous mobile fleets amid growing demand in tier-2 cities. Australia’s broadacre farms adopt drone scouting and autonomous tractors, with one-third already using precision agriculture.
North America held roughly 30% of revenue in 2025. The United States leads surgical robot installations and warehouse automation, and the Department of Defense requested USD 2.5 billion for unmanned systems in its 2026 budget. FAA waivers for beyond-visual-line-of-sight grew to 12,000 in 2025, energizing drone inspection services. Canada’s Prairie provinces deploy autonomous harvesters to counter seasonal labor gaps, and Mexican factories integrate collaborative robots as near-shoring accelerates.
Europe accounted for about 25% of the market value in 2025. Germany’s insurers reimburse assistive robots up to EUR 5,000, and the automotive sector introduces mobile fleets to offset 1.2 million vacancies. The United Kingdom’s NHS earmarked GBP 500 million for surgical robots to cut elective wait lists, while France subsidizes agricultural robots that prune vines and pick fruit. Russia’s market growth lags due to sanctions that restrict the import of sensors. The Middle East and Africa see hotel, hospital, and port projects in the United Arab Emirates and Saudi Arabia anchoring demand, whereas South Africa’s mines adopt autonomous haulage. In South America, Brazilian sugarcane and soybean farms are piloting drones and tractors, though tariffs and currency swings temper rollouts.

Competitive Landscape
Intuitive Surgical dominates surgical robotics with more than 70% revenue share and a global installed base of over 9,000 systems in 2025, supported by recurring instrument sales that account for over half of its cash flow. DJI Technology exerts similar control over commercial drones, accounting for roughly 75% of shipments through tight vertical integration of airframes, cameras, and flight controllers. Despite these leaders, the top 10 vendors captured only about 45% of total service-robotics revenue, leaving room for regional specialists to carve profitable niches.
Competitive intensity is rising as industrial-automation incumbents purchase niche integrators to accelerate time-to-market. Daifuku’s USD 960 million acquisition of Swisslog’s warehouse-automation division broadened its reach into autonomous mobile robots and automated storage systems, giving the company cross-sell access to large third-party logistics contracts. ABB partnered with NVIDIA in 2025 to embed the Jetson Orin edge-AI platform across its autonomous mobile robot line, boosting real-time object detection accuracy by 30%. Boston Dynamics shifted to an open-architecture model by licensing its Spot quadruped to third-party developers, a move expected to seed new applications in construction and energy inspection. These actions indicate a pivot toward ecosystem strategies rather than pure hardware differentiation.
Venture-funded challengers are scaling quickly on robot-as-a-service pricing that eliminates multimillion-dollar capital approvals. Locus Robotics surpassed 25,000 active warehouse units in 2025 and delivers software updates weekly via a cloud fleet-management stack that locks customers in for 5-year terms. At Pudu Robotics, 60,000 delivery and cleaning robots were shipped in 2025 following a USD 150 million Series D round led by SoftBank Vision Fund, extending its footprint to 60 countries. Figure AI and 1X Technologies together secured USD 800 million to pursue humanoid labor in warehousing and retail, although viable commercial deployments are still several years away. Collectively, these newcomers pressure incumbents on price, flexibility, and speed of innovation while pushing the overall market toward a moderate fragmentation profile.
Service Robotics Industry Leaders
iRobot Corporation
Dematic Corp.
Daifuku Co. Ltd.
Swisslog Holding AG (KUKA)
Omron Corporation
- *Disclaimer: Major Players sorted in no particular order

Recent Industry Developments
- December 2025: Intuitive Surgical secured FDA clearance for the da Vinci 5 system with force feedback and enhanced 3D vision.
- November 2025: Amazon committed USD 1.2 billion to add 250,000 autonomous mobile robots to its network by 2027.
- October 2025: Boston Dynamics and Toyota formed a USD 500 million joint venture to deploy humanoid robots in automotive plants.
- September 2025: Medtronic commercially launched Hugo RAS in Japan, securing 50 system orders for 2026 delivery.


Research Methodology Framework and Report Scope
Market Definitions and Key Coverage
Our study defines the service robotics market as the global revenue generated when autonomous or semi-autonomous machines perform useful tasks for people or equipment outside of classic factory automation. The boundary spans professional platforms, such as logistics AMRs, surgical systems, and inspection drones, and personal or domestic units like floor-cleaning and elder-care robots.
Scope exclusion: robots dedicated purely to fixed industrial manufacturing cells are left outside this analysis.
Segmentation Overview
- By Field of Application
- Professional
- Field Robots
- Professional Cleaning
- Inspection and Maintenance
- Construction and Demolition
- Logistics Systems
- Medical Robots
- Rescue and Security
- Defense Robots
- Underwater Systems
- Powered Human Exoskeletons
- Public-Relation Robots
- Personal / Domestic
- Domestic Task Robots
- Entertainment Robots
- Elderly and Handicap Assistance
- Professional
- By Component
- Hardware
- Sensors
- Actuators
- Controllers and Drives
- Power Systems
- Software
- Operating Systems and Middleware
- AI and Analytics Algorithms
- Services
- Hardware
- By Operating Environment
- Ground
- Aerial / UAV
- Marine / Underwater
- By Mobility
- Mobile / Autonomous
- Stationary / Fixed-Base
- By End-User Industry
- Healthcare and Medical
- Logistics and Warehousing
- Agriculture
- Construction and Demolition
- Defense and Security
- Hospitality and Retail
- Education and Entertainment
- By Geography
- North America
- United States
- Canada
- Mexico
- Europe
- Germany
- United Kingdom
- France
- Russia
- Rest of Europe
- Asia-Pacific
- China
- Japan
- India
- South Korea
- Australia
- Rest of Asia-Pacific
- Middle East and Africa
- Middle East
- Saudi Arabia
- United Arab Emirates
- Rest of Middle East
- Africa
- South Africa
- Egypt
- Rest of Africa
- Middle East
- South America
- Brazil
- Argentina
- Rest of South America
- North America
Detailed Research Methodology and Data Validation
Primary Research
Telephone and video interviews with robotics OEM executives, hospital procurement leads, 3PL warehouse managers, and consumer-electronics retailers across North America, Europe, and Asia helped validate unit mix, average selling prices, and payback expectations. Follow-up questionnaires allowed us to reconcile divergent viewpoints before locking scenario assumptions.
Desk Research
We began with structured searches across reputable public sources such as the International Federation of Robotics, the World Bank open data portal, Eurostat trade statistics, ITC-Comtrade customs records, and IEEE peer-reviewed journals that track robotic deployments. Corporate filings, investor presentations, and mainstream technology press supplied additional shipment and pricing clues, while subscription datasets like D&B Hoovers and Dow Jones Factiva enriched company financials and news flow that influence demand. The sources cited above are illustrative; many other publications informed the evidence base.
A second desk-work stream mined national health agencies, airport authorities, and e-commerce parcel audits to anchor end-use volumes for medical, hospitality, and logistics robots, respectively. These sector fingerprints offer early signals on adoption cycles that feed the model.
Market-Sizing & Forecasting
We first built a top-down demand pool by reconstructing professional and personal robot deployments from IFR shipment releases, adjusted for replacement cycles and documented ASP erosion. Selective bottom-up checks, such as supplier roll-ups of leading AMR vendors and sampled retail ASP × vacuum unit sales, tested the totals and flagged gaps. Key inputs include aging population ratios, e-commerce parcel growth, hospital surgical procedure volumes, warehouse floor space additions, and chipset price trends, each projected with multivariate regression. Where bottom-up tallies lagged official trade data, the delta was apportioned using three-year moving averages.
Data Validation & Update Cycle
Analyst peers reran variance tests, compared outputs with independent benchmarks, and re-contacted sources when anomalies persisted. Reports refresh every twelve months, and material events, such as large recalls, reimbursement shifts, and major regulatory changes, trigger interim updates. Before release, a fresh analyst pass ensures clients receive the latest calibrated view.
Why Our Service Robotics Baseline Commands Reliability
Published estimates often differ because firms pick unique scopes, convert currencies at varied dates, or refresh at different cadences.
Key gap drivers here include whether domestic toy robots are counted, how refurbished units are treated, and if freight-rate linked ASP adjustments are applied. Mordor Intelligence adopts a mid-cycle currency rate, excludes toys, and nets refurbished sales out of totals, which keeps our 2025 baseline grounded in active revenue rather than shipment hype.
Benchmark comparison
| Market Size | Anonymized source | Primary gap driver |
|---|---|---|
| USD 71.91 B (2025) | Mordor Intelligence | - |
| USD 47.10 B (2024) | Global Consultancy A | includes hobby drones and uses list prices without regional ASP discounts |
| USD 46.99 B (2023) | Industry Journal B | stops at professional robots and omits domestic vacuum category |
| USD 22.40 B (2024) | Regional Consultancy C | counts only shipped units in Asia Pacific, excludes service revenue streams |
In sum, the disciplined scoping choices, transparent variables, and yearly refresh cadence give our numbers a dependable middle ground that decision-makers can replicate and stress-test with limited effort.


Key Questions Answered in the Report
What is the current value of the service robotics market?
The service robotics market size is USD 86.02 billion in 2026.
How fast is the market expected to grow?
It is projected to expand at a 19.51% CAGR, reaching USD 209.72 billion by 2031.
Which application area dominates revenue?
Professional robots for logistics and healthcare held 52.44% of global revenue in 2025.
Which region is growing the fastest?
Asia-Pacific leads with a projected 20.57% CAGR through 2031.
Why are robot-as-a-service models important?
RaaS shifts spending from capital to operating budgets, cutting payback periods below 18 months for many small and mid-sized firms.
What is the main barrier to wider adoption?
High upfront costs and maintenance expenses remain the primary constraints, especially for hospitals and warehouses in emerging markets.
Page last updated on:


