Consumer Robotics Market Size and Share
Market Overview
| Study Period | 2020 - 2031 |
|---|---|
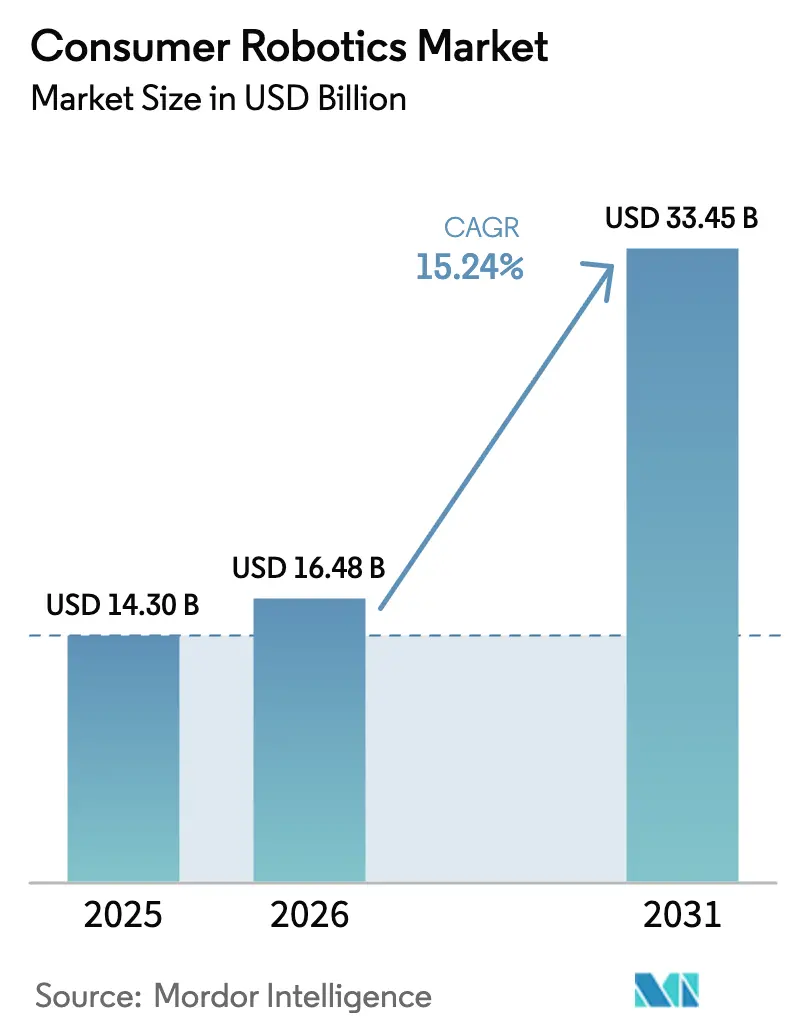
| Market Size (2026) | USD 16.48 Billion |
| Market Size (2031) | USD 33.45 Billion |
| Growth Rate (2026 - 2031) | 15.24% CAGR |
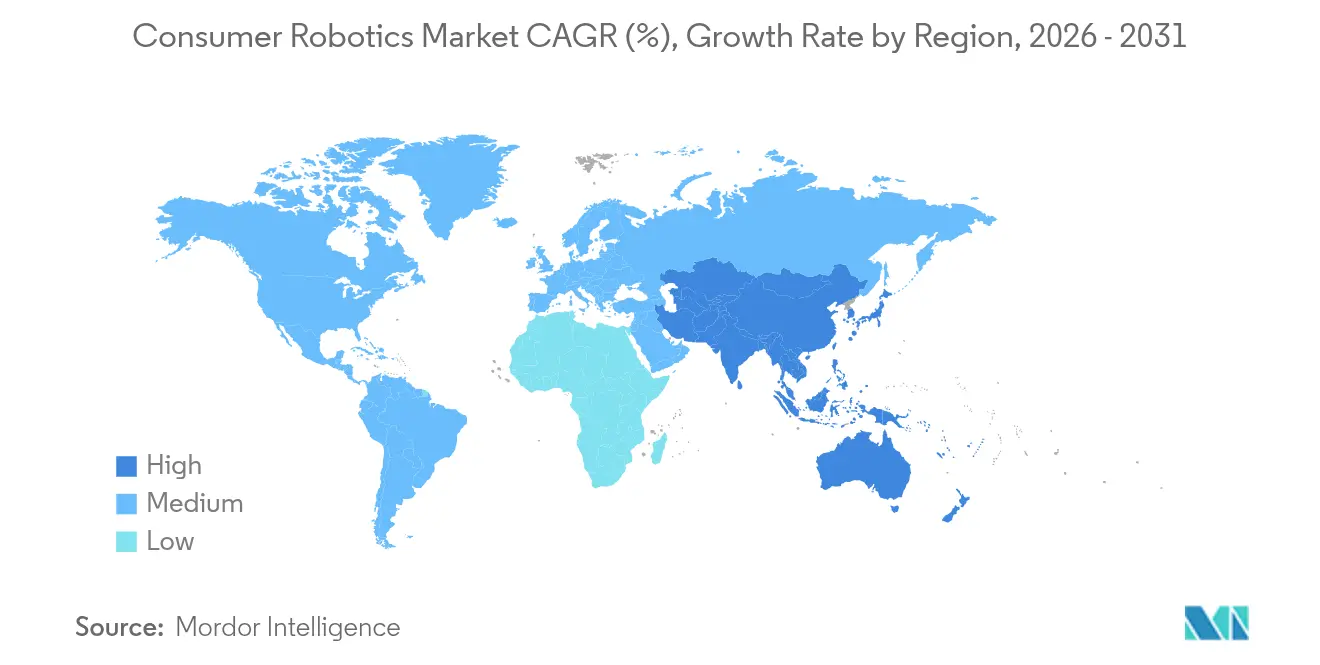
| Fastest Growing Market | Asia Pacific |
| Largest Market | North America |
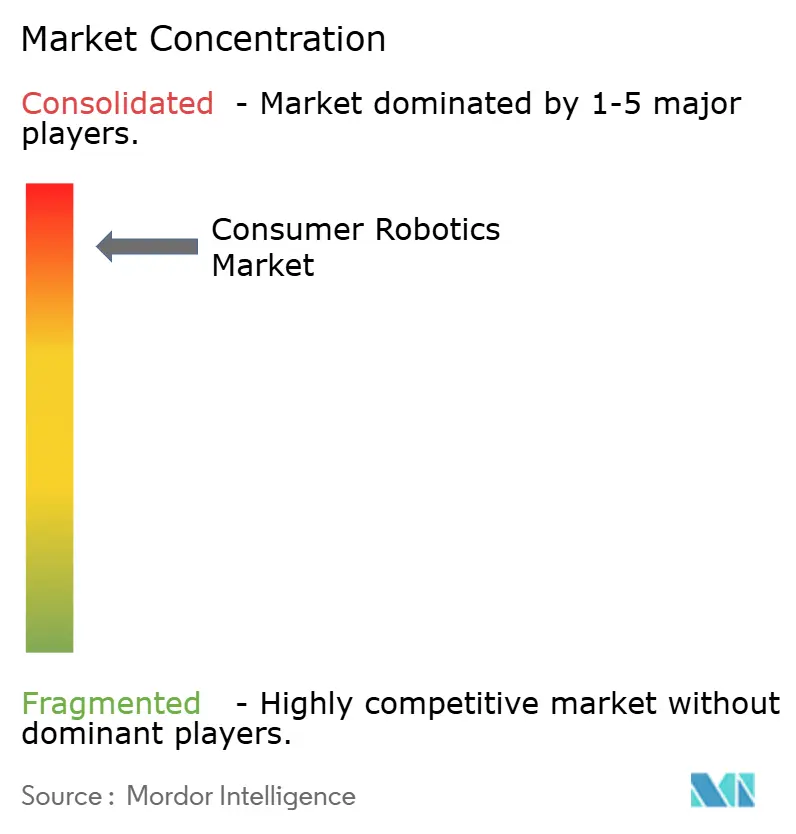
| Market Concentration | High |
Major Players *Disclaimer: Major Players sorted in no particular order Image © Mordor Intelligence. Reuse requires attribution under CC BY 4.0. | |
Consumer Robotics Market Analysis by Mordor Intelligence
The consumer robotics market size was valued at USD 14.30 billion in 2025 and estimated to grow from USD 16.48 billion in 2026 to reach USD 33.45 billion by 2031, at a CAGR of 15.24% during the forecast period (2026-2031). Demand was propelled by the shift from stand-alone household gadgets to intelligent, autonomous systems that plug into wider smart-home and aging-in-place ecosystems. Breakthroughs in visual SLAM navigation, on-device AI inference, and low-power semiconductor design enabled robots to operate safely in cluttered living spaces without external beacons. Governments in Japan, the United States, and parts of Europe funded assistive-robotics pilots that eased affordability barriers for older citizens.[1]European Parliament, “Eldercare Robotics and Demographic Change,” europarl.europa.eu Supply-chain reviews triggered by the Biden Administration pushed vendors to re-engineer battery and semiconductor sourcing to reduce geopolitical risk. Meanwhile, a subscription-based Robotics-as-a-Service (RaaS) model—growing at an estimated 18% annually—lowered upfront ownership costs and encouraged faster refresh cycles. Competitive intensity rose as the top five brands controlled 93% of global revenue, prompting consolidation and accelerated product road maps.
Key Report Takeaways
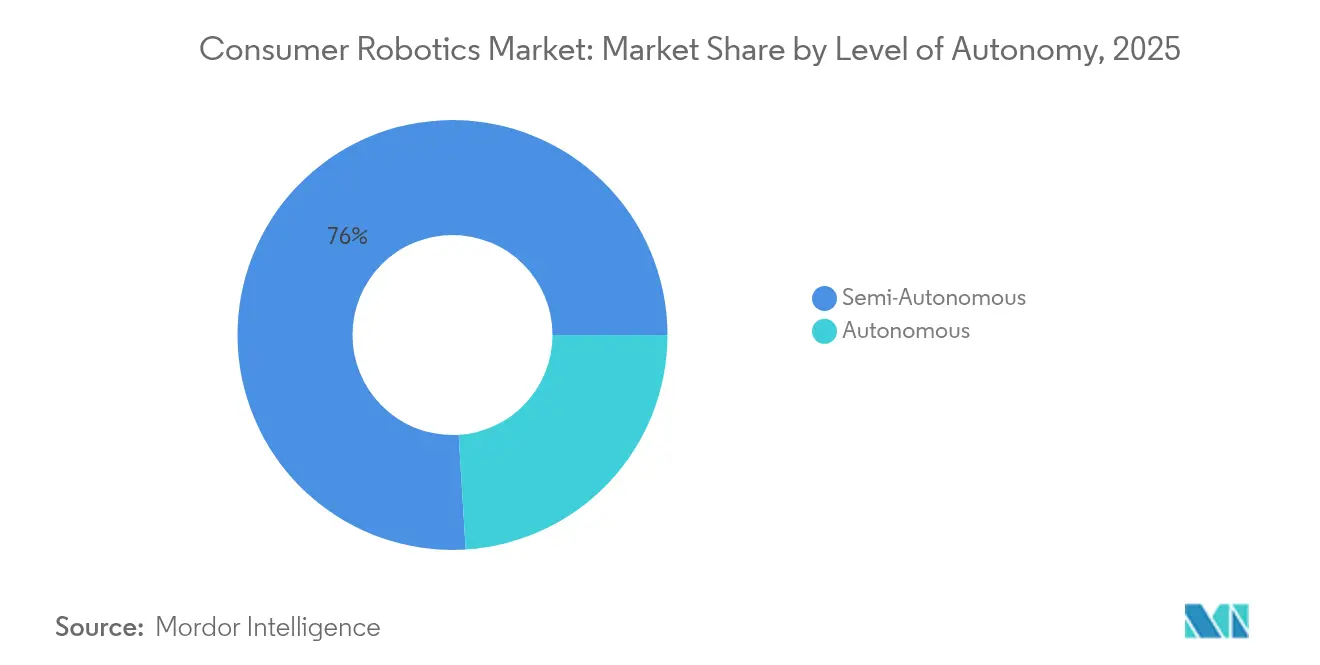
- By level of autonomy, semi-autonomous systems led with 75.98% of consumer robotics market share in 2025; fully autonomous robots are forecast to expand at a 24.23% CAGR through 2031.
- By product type, cleaning robots captured 63.85% of the consumer robotics market share in 2025, while social and companion robots are set to grow at a 27.68% CAGR to 2031.
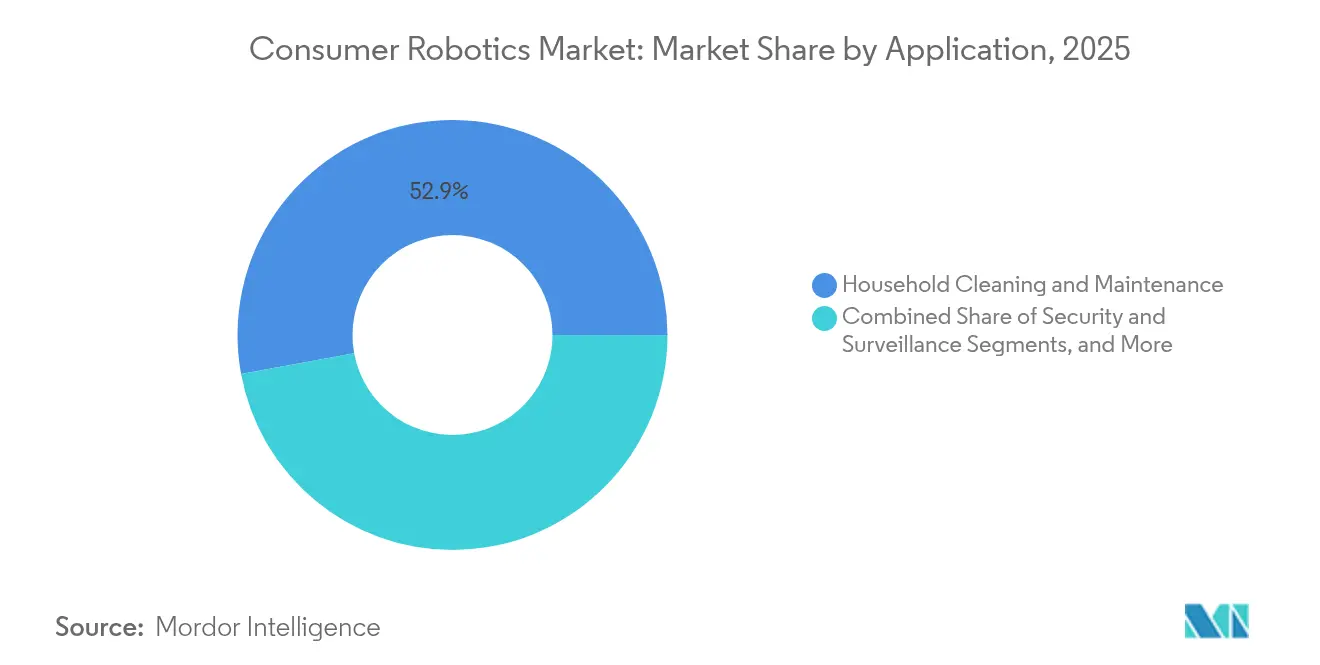
- By application, household cleaning held a 52.91% share of the consumer robotics market size in 2025; personal health and wellness is projected to rise at a 28.12% CAGR through 2031.
- By distribution channel, online retail accounted for 60.92% of the consumer robotics market size in 2025; direct-to-consumer is advancing at 26.02% CAGR through 2031.
- By geography, North America commanded 35.95% of the consumer robotics market size in 2025, while Asia-Pacific is forecast to expand at an 17.98% CAGR between 2026-2031.
Note: Market size and forecast figures in this report are generated using Mordor Intelligence’s proprietary estimation framework, updated with the latest available data and insights as of 2026.
Global Consumer Robotics Market Trends and Insights
Drivers Impact Analysis*
| Driver | (~) % Impact on CAGR Forecast | Geographic Relevance | Impact Timeline |
|---|---|---|---|
| Rising household-automation demand | +3.2% | Global, early adoption in North America and the EU | Medium term (2-4 years) |
| AI and visual-SLAM autonomy breakthroughs | +4.1% | Global, led by Asia-Pacific innovation hubs | Short term (≤ 2 years) |
| Smart-home ecosystem integration | +2.8% | North America and the EU core, expanding to Asia-Pacific | Medium term (2-4 years) |
| Subscription-based RaaS for consumers | +1.9% | North America and the EU are early markets, and global expansion | Long term (≥ 4 years) |
| Retail and hospitality service-robot roll-outs | +1.4% | Global, concentrated in urban centers | Medium term (2-4 years) |
| Aging-in-place government incentives | +2.1% | Japan, the EU, and North America with policy support | Long term (≥ 4 years) |
| Source: Mordor Intelligence | |||
Rising Household-Automation Demand
The pandemic-era shift toward remote work increased time spent at home, exposing pain points that basic appliances could not solve. Premium buyers gravitated toward autonomous floor-care systems, indoor delivery bots, and responsive air-quality monitors that communicate over Matter and Zigbee protocols. Samsung’s Ballie prototype, unveiled at CES 2025, illustrated how predictive AI enables the robot to pre-emptively trigger lighting, HVAC, and security routines while patrolling living spaces. Early adopters accepted 10-15% price premiums, validating willingness to pay for convenience and time savings, which broadened the consumer robotics market.
AI and Visual-SLAM Autonomy Breakthroughs
Cheap depth cameras, edge AI accelerators, and maturing SLAM algorithms lifted robots out of single-room confinement. ABB’s Flexley series and Roborock’s Saros Z70, capable of folding an arm to remove stray objects, showed that real-time perception married with manipulation unlocks new household tasks. Asian ODMs leveraged proximity to component supply chains to introduce iterative upgrades every 10 months, tightening innovation cycles and raising the performance baseline for the consumer robotics market.
Smart-Home Ecosystem Integration
Robots evolved into roaming IoT hubs, harvesting environmental data for smart-home platforms. Local-processing options alleviated compliance headaches in GDPR-regulated Europe, where consumers demanded privacy-preserving architectures. Vendors that embedded open APIs secured higher attach rates for subscriptions, such as consumables delivery or predictive maintenance. The resulting network effects deepened brand lock-in and amplified switching costs, strengthening revenue visibility across the consumer robotics market.
Subscription-Based RaaS for Consumers
Households hesitant to pay USD 500–1,800 upfront for a robotic vacuum welcomed all-inclusive monthly plans bundling hardware, consumables, and software updates. Vendors reported churn rates under 5% after 24 months, indicating strong retention economics. The model attracted mid-income segments in the United States and Western Europe, where credit penetration supported recurring billing. Over the forecast horizon, RaaS revenues are expected to diversify cash flows and accelerate feature deployment cycles, further energizing the consumer robotics market.
Restraints Impact Analysis*
| Restraint | (~) % Impact on CAGR Forecast | Geographic Relevance | Impact Timeline |
|---|---|---|---|
| High upfront cost in emerging economies | -2.3% | Asia-Pacific emerging, Latin America, Middle East | Medium term (2-4 years) |
| Data privacy and cybersecurity concerns | -1.8% | Global, heightened in the EU | Short term (≤ 2 years) |
| Critical raw-material supply risks | -1.6% | Global, concentrated in Asia | Long term (≥ 4 years) |
| Rising e-waste compliance costs | -1.1% | EU and North America | Medium term (2-4 years) |
| Source: Mordor Intelligence | |||
High Upfront Cost in Emerging Economies
In price-sensitive markets such as Indonesia and Brazil, the average robot vacuum selling for USD 700 equalled three to four weeks of household income, curbing adoption. Financing options remained scarce, and after-sales networks were thin, raising perceived risk. Even where RaaS pilots launched, limited broadband and patchy logistics undercut service reliability, delaying penetration outside Tier-1 cities. Until local assembly scales or taxation eases, affordability will continue to restrain the consumer robotics market.
Data-Privacy and Cyber-Security Concerns
Academic demonstrations at 37C3 in 2024 showed how compromised firmware could stream in-home video feeds, stirring public alarm. EU regulators responded by tightening certification rules for networked devices, adding cost and time to compliance. Manufacturers integrated on-device object recognition to limit cloud uploads and published transparency dashboards, but trust erosion remained a brake, especially among older buyers who would benefit most from assistive robots. Addressing these issues is essential for sustaining momentum in the consumer robotics market.
*Our forecasts treat driver/restraint impacts as directional, not additive. The impact forecasts reflect baseline growth, mix effects, and variable interactions.
Segment Analysis
By Level of Autonomy: Intelligence Drives Premium Migration
Semi-autonomous models dominated 2025 with 75.98% consumer robotics market share because they balanced hands-off operation with user oversight. Retail prices clustered near USD 600, making them attainable for mass-market households. Fully autonomous units, though below 25% of shipments, expanded at a 24.23% CAGR as AI cost curves improved. Early adopters applauded obstacle-removal arms and self-emptying docks, signalling readiness to pay USD 1,200-plus for hassle-free living.
A widening performance gap encouraged vendors to tier portfolios: entry models offer laser mapping; mid-tier products add voice-assistant integration; flagships tout real-time scene segmentation. This laddering strategy maximized upsell opportunities and lengthened product lifecycles. As sensor prices fall, fully autonomous devices are forecast to cross the USD 799 threshold by 2027, likely flipping the volume mix and reshaping the consumer robotics market.


By Product Type: Cleaning Dominance Faces Companion Challenge
Cleaning robots generated 63.85% of product-type revenue in 2025, giving them the largest consumer robotics market share among all categories. Continuous suction-power improvements, reusable dust bags, and self-emptying docks lifted margins and financed frequent refresh cycles. Leaders such as Roborock extended the category’s appeal by adding an AI-powered folding arm that removes toys and cables before vacuuming, a feature first shown on the Saros Z70 model. Appliance makers also filed patents for fleet coordination that lets a “master” vacuum dispatch smaller units to missed zones, boosting coverage while holding battery size in check. These innovations helped cleaning devices defend pricing power even as component costs eased.
Social and companion robots posted the fastest expansion, advancing at a 27.68% CAGR as households sought emotional engagement and light wellness monitoring. Premium buyers embraced pet-like robots that tell stories, schedule medication reminders, and provide basic telepresence for relatives, an evolution inspired by early therapeutic devices such as Paro that proved seniors respond positively to robotic companionship. Vendors reused mobility and vision stacks from vacuums, cutting time-to-market and enabling sub-USD 1,200 launch prices. Diversifying into emotionally driven use cases therefore mitigates over-reliance on the mature floor-care niche and widens brand reach across demographic groups.
By Application: Wellness Emergence Disrupts Cleaning Monopoly
Household cleaning secured a 52.91% share of the consumer robotics market size in 2025, as time-pressed professionals outsourced mundane chores. However, personal health and wellness use cases—from fall-detection walkers to exosuits aiding Parkinson’s gait—grew at 28.12% CAGR. Clinical trials at Harvard showed a 60% reduction in fall incidence, bolstering reimbursement arguments.
Security robots patrolled suburban driveways, but adoption remained limited to high-income brackets. Educational kits sustained modest demand as parents sought STEM enrichment. Diversifying beyond floor care diffuses revenue risk and elevates the consumer robotics market’s resilience to macro-cycles.
By Distribution Channel: Direct Connection Accelerates Growth
Online storefronts generated 60.92% of global revenue in 2025, aided by comparison engines and influencer tutorials. Platforms like Amazon deployed 750,000 internal robots, showcasing credibility that spilled over to consumer categories. Direct-to-consumer (DTC) sales, though smaller, climbed at 26.02% CAGR as brands chased higher margins and first-party data.
DTC pioneers bundled lifetime consumables, app upgrades, and extended warranties that compressed payback periods for buyers. Logistics partners offered two-day delivery and doorstep servicing, matching the convenience of e-commerce majors. As DTC penetration rises, manufacturers will own richer telemetry, enabling predictive upgrades that reinforce the consumer robotics market flywheel.
Geography Analysis
North America retained a 35.95% share in 2025, thanks to high disposable incomes and early smart-home adoption. Average selling prices there hovered 25% above global norms, supporting robust margins. Asia-Pacific posted the fastest expansion, clocking an 17.98% CAGR as Chinese and South Korean OEMs capitalized on local component clusters and demographic aging.
North America’s leadership stemmed from a tech-savvy middle class, strong broadband penetration, and federal initiatives that reimbursed exoskeletons for veterans. Vendors leveraged mature e-commerce logistics to sustain two-year replacement cycles. Yet reliance on Asia-Pacific components exposed cost structures to tariff swings and shipping disruptions, an Achilles heel that manufacturers began to address through near-shoring prototypes in Mexico and Canada.
Asia-Pacific's highest CAGR reflected an unparalleled blend of supply-side scale and demand-side urgency as populations aged rapidly. Government grants in Japan subsidized rehabilitation robots, while Chinese cities piloted community-care bots to offset caregiver shortages. Competitive local ecosystems drove down bill-of-materials costs, enabling sub-USD 400 robot vacuums that opened the lower-middle-income segment and widened the consumer robotics market funnel.
Europe showed measured but sustainable growth underpinned by stringent privacy laws that compelled manufacturers to invest in edge-computing safeguards. GDPR compliance elevated trust and permitted deeper smart-home integration, especially in Germany and the Nordics. Southern European economies, still recovering from earlier downturns, favoured RaaS schemes to spread expenses over time. Beyond the tri-regional hubs, Latin America and the Middle East registered early adoption among affluent urbanites, though currency volatility and service gaps tempered volumes.

Competitive Landscape
Concentration remained high: the top five vendors commanded 93% of global revenue, translating into significant pricing power and R&D scale. Roborock’s IPO filing in Hong Kong illustrated ambitions to bankroll platform expansion and marketing in Europe. iRobot, under margin pressure, restructured operations and pivoted toward lidar-equipped models priced as low as USD 299 to regain share.
Strategic alliances proliferated. Symbotic acquired Walmart’s internal robotics unit, securing a pipeline for retail-grade automation roll-outs. Electrolux patented multi-robot coordination, seeking differentiation through fleet efficiency. Start-ups attracted abundant venture capital, highlighted by Cybernetix Ventures’ USD 100 million fund targeting physical AI. Despite funding inflows, barriers to entry remained steep due to proprietary AI stacks and global service requirements, preserving the consumer robotics market’s high-concentration profile.
White-space opportunities emerged in niche eldercare, where therapeutic robots like Paro commanded USD 6,000-plus price tags. Vendors also eyed developing-world households with simplified feature sets stripping lidar for infrared, shaving 40% off costs. Failure to execute on affordability precipitated casualties: Xiaomi-backed Roidmi exited the market in 2024 after intense pricing wars.[4]KrASIA, “Roidmi Exits Market,” kr-asia.com Overall, sustained differentiation now hinges on in-house AI talent, robust patent arsenals, and vertically integrated service models.
Consumer Robotics Industry Leaders
iRobot Corporation
Roborock Technology Co., Ltd.
Ecovacs Robotics Co., Ltd.
DJI Technology Co., Ltd.
Xiaomi Corp.
- *Disclaimer: Major Players sorted in no particular order

Recent Industry Developments
- June 2025: Roborock announced plans for Hong Kong Stock Exchange listing, with 2024 overseas revenue of CNY 6.388 billion (USD 883 million) surpassing domestic sales.
- June 2025: Cybernetix Ventures began raising a USD 100 million fund dedicated to robotics and physical AI start-ups.
- April 2025: Apptronik raised USD 350 million in Series A to scale Apollo humanoid robot production.
- March 2025: iRobot launched eight Roomba models featuring lidar room mapping priced from USD 299 to USD 999.


Research Methodology Framework and Report Scope
Market Definitions and Key Coverage
Our study defines the consumer robotics market as revenues earned from robots sold for personal or domestic use, including floor-cleaning, lawn-mowing, pool-cleaning, social-companion, education, entertainment, personal mobility, and hobby drones that are marketed directly to households. Devices built purely for industrial, logistics, medical, or defense settings sit outside this value chain.
Scope Exclusion: commercial service robots deployed in warehouses, hospitals, security patrols, or food delivery are not counted.
Segmentation Overview
- By Level of Autonomy
- Autonomous
- Semi-Autonomous
- By Product Type
- Cleaning Robots
- Social and Companion Robots
- Entertainment and Gaming Robots
- Personal Mobility and Wearable Robots
- Consumer Drones
- By Application
- Household Cleaning and Maintenance
- Security and Surveillance
- Entertainment and Companion
- Personal Health and Wellness
- Educational and STEM Learning
- By Distribution Channel
- Online Retail
- Specialty Electronics Stores
- Mass Merchandisers
- Direct-to-Consumer
- Other Channels
- By Geography
- North America
- United States
- Canada
- Mexico
- South America
- Brazil
- Argentina
- Rest of South America
- Europe
- Germany
- France
- United Kingdom
- Italy
- Spain
- Russia
- Rest of Europe
- Asia-Pacific
- China
- Japan
- South Korea
- India
- Southeast Asia
- Rest of Asia-Pacific
- Middle East and Africa
- Middle East
- Saudi Arabia
- United Arab Emirates
- Turkey
- Rest of Middle East
- Africa
- South Africa
- Rest of Africa
- Middle East
- North America
Detailed Research Methodology and Data Validation
Primary Research
Interviews with component makers, robot OEMs, large electronics retailers, online marketplaces, and repair centers across North America, Europe, and Asia help us test adoption rates, average selling prices, and warranty replacement volumes, filling gaps that desk work leaves open.
Desk Research
We start with publicly available datasets such as the International Federation of Robotics annual shipment tables, US Census Bureau ICT spending, Eurostat PRODCOM production codes, Japan Robot Association shipment releases, and patent trends from Questel. Company filings, 10-Ks, trade press, and association whitepapers offer selling prices, channel mixes, and new-product timelines. Our analysts also pull financials from D&B Hoovers and news from Dow Jones Factiva for cross-checks. This list is illustrative, not exhaustive.
Market-Sizing & Forecasting
We reconstruct 2025 demand through a top-down model that aligns household penetration, average replacement cycles, and regional income cohorts; selective bottom-up checks (sampled ASPxunit roll-ups from leading brands) verify totals before adjustments. Key inputs include global robot vacuum shipments, smart-home broadband penetration, lithium-ion battery price trends, disposable personal income growth, and IFR unit forecasts. A multivariate regression, combined with scenario analysis on price elasticity, projects values to 2030; anomalies trigger re-runs.
Data Validation & Update Cycle
Outputs pass a two-step peer review, variance tests against external indicators, and management sign-off. The file refreshes every twelve months, with mid-cycle updates after material events; before release, an analyst re-checks all drivers.
Why Mordor's Consumer Robotics Baseline Commands Confidence
Published estimates often diverge because firms vary product baskets, price assumptions, and refresh rhythms. We clarify scope first and then let data steer the model.
Key gap drivers include whether educational kits and toy drones are included, how gray-market online sales are handled, and if semi-professional service robots creep into totals. Mordor sticks to end-consumer sales, uses rolling currency parity, and refreshes annually, which some peers do not.
Benchmark comparison
| Market Size | Anonymized source | Primary gap driver |
|---|---|---|
| USD 14.30 B (2025) | Mordor Intelligence | - |
| USD 13.16 B (2025) | Global Consultancy A | excludes hobby drones and companion bots |
| USD 18.44 B (2025) | Industry Data Provider B | folds warehouse service units into consumer totals |
These comparisons show that once product scope is harmonized, figures cluster more tightly, underscoring that Mordor's disciplined, clearly traced approach offers decision-makers a dependable baseline.


Key Questions Answered in the Report
What is the current size of the consumer robotics market?
The consumer robotics market was valued at USD 16.48 billion in 2026 and is forecast to reach USD 33.45 billion by 2031.
Which segment is growing fastest within consumer robotics?
Fully autonomous robots are expected to grow at a 24.23% CAGR, while social and companion robots show a 27.68% CAGR on the product side through 2031.
Why is Asia-Pacific the fastest-growing region?
Asia-Pacific benefits from large-scale component manufacturing, rapid aging demographics, and aggressive innovation cycles, yielding an 17.98% regional CAGR.
How are companies addressing high upfront costs in emerging markets?
Vendors are experimenting with Robotics-as-a-Service subscription models and exploring local assembly to cut prices and widen access.
What role does AI play in next-generation consumer robots?
Advances in on-device AI and visual SLAM allow robots to navigate complex homes, manipulate objects, and integrate deeply with smart-home ecosystems, expanding use cases.
Are privacy concerns slowing adoption?
Yes. Demonstrated hacking risks and stricter regulations like GDPR increase compliance costs and influence buying decisions, especially in Europe.
Page last updated on:


