UK Fixed Connectivity Market Size and Share
Market Overview
| Study Period | 2020 - 2031 |
|---|---|
| Forecast Data Period | 2026 - 2031 |
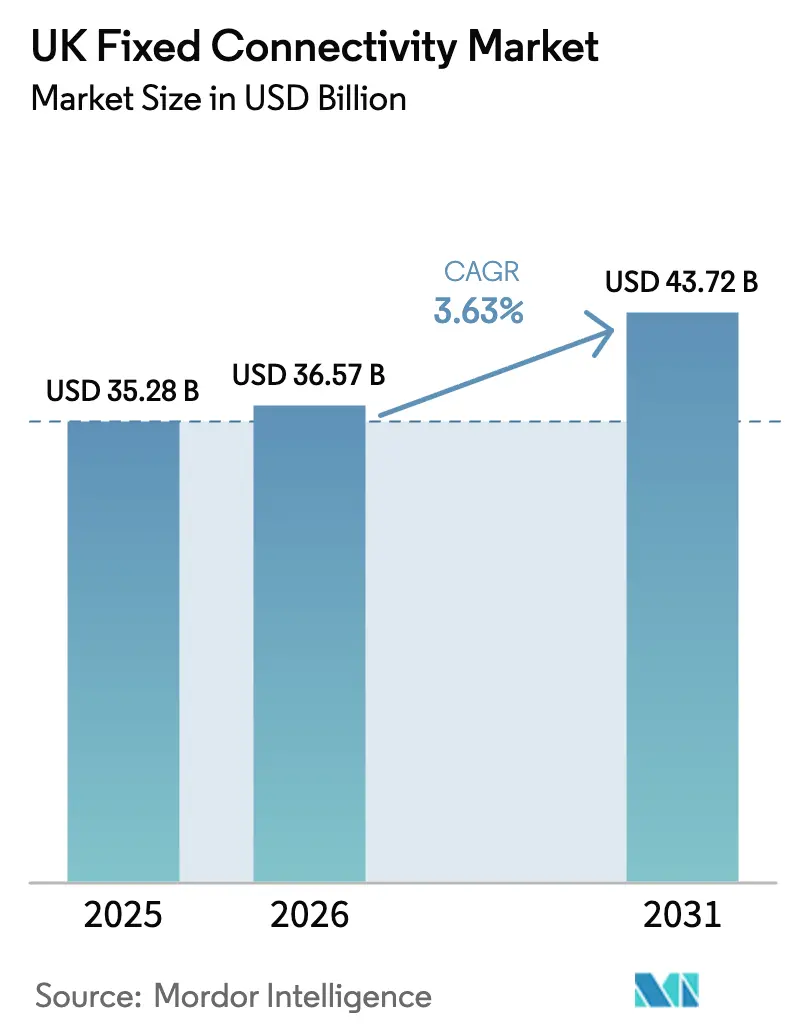
| Base Year Market Size (2025) | USD 35.28 Billion |
| Market Size (2026) | USD 36.57 Billion |
| Market Size (2031) | USD 43.72 Billion |
| Growth Rate (2026 - 2031) | 3.63% CAGR |
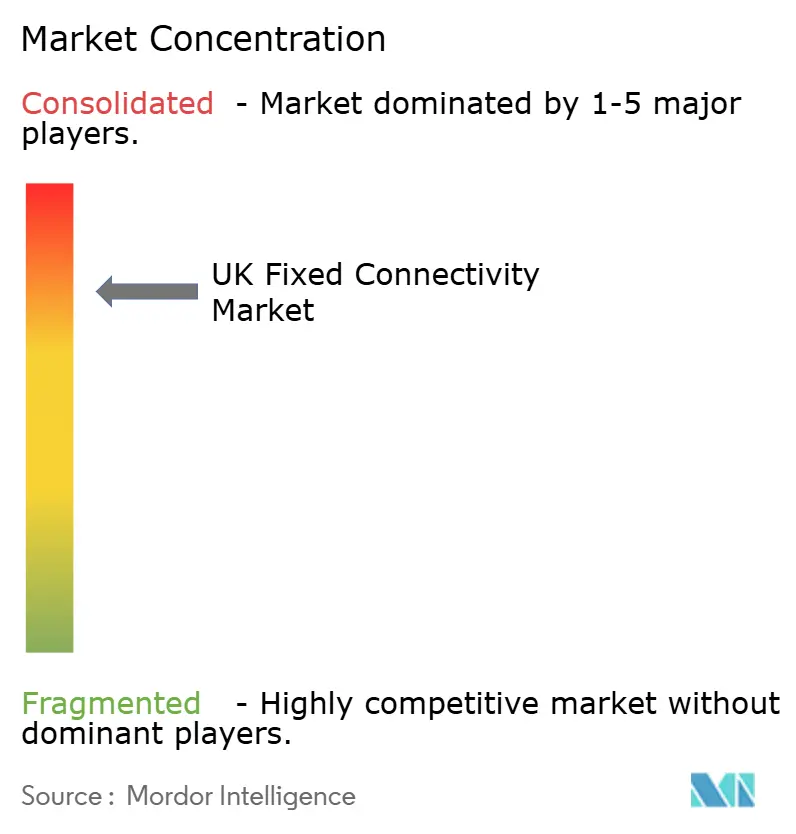
| Market Concentration | High |
Major Players *Disclaimer: Major Players sorted in no particular order Image © Mordor Intelligence. Reuse requires attribution under CC BY 4.0. | |
UK Fixed Connectivity Market Analysis by Mordor Intelligence
UK Fixed Connectivity Market size in 2026 is estimated at USD 36.57 billion, growing from 2025 value of USD 35.28 billion with 2031 projections showing USD 43.72 billion, growing at 3.63% CAGR over 2026-2031. The steady trajectory reflects sustained investment in full-fiber networks, a favorable regulatory push for gigabit speeds, and brisk competition from alternative network operators that now cover more than one-third of premises. Accelerated Fiber-to-the-Premises rollouts, stronger enterprise appetite for symmetrical gigabit lines, and the shift toward bundled multi-play services keep revenue momentum intact even as legacy copper products decline. Demand is further amplified by data-heavy streaming, cloud gaming, and hybrid working patterns that push the average household traffic to new records. On the supply side, operators are grappling with inflated build costs, wayleave bottlenecks, and a shortage of skilled engineers, which could temper near-term deployment speed.
Key Report Takeaways
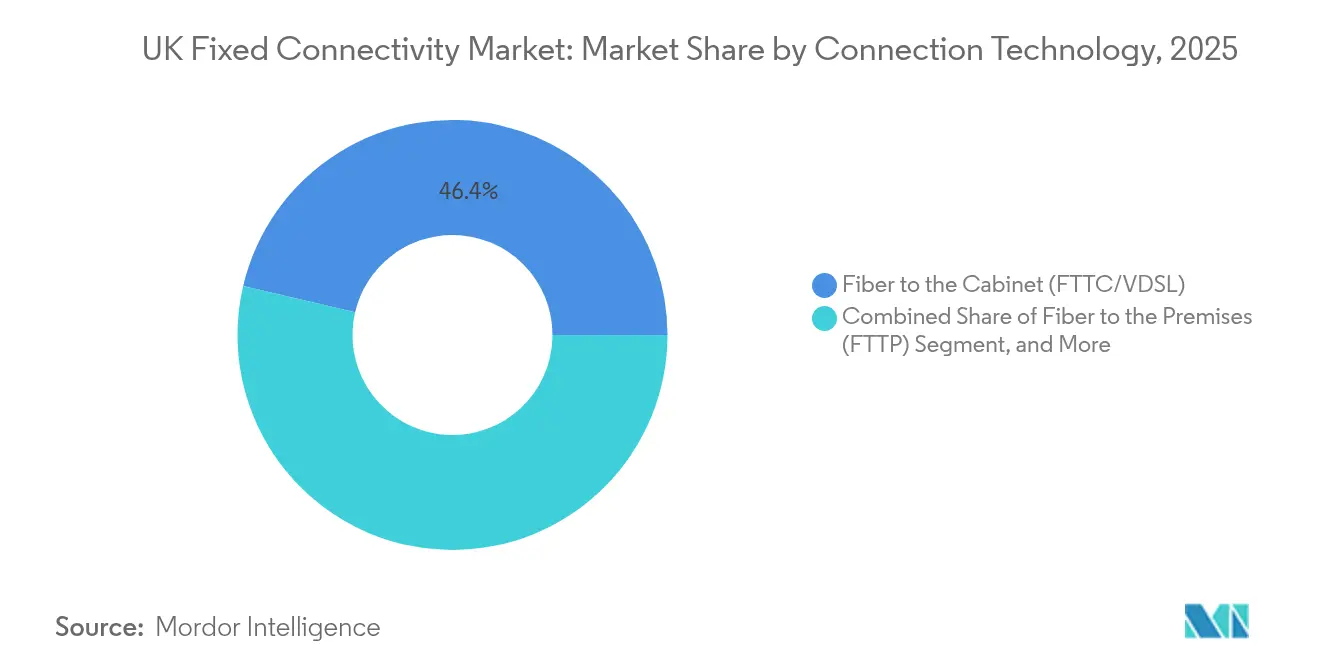
- By connection technology, FTTC/VDSL led the UK fixed connectivity market with 46.35% of the market share in 2025, while FTTP is expected to expand at a 10.82% CAGR through 2031.
- By service type, Fixed Data captured 93.05% of the UK fixed connectivity market's revenue in 2025; Bundled Triple-/Quad-Play is projected to grow at a 6.55% CAGR through 2031.
- By speed tier, 30-100 Mbps services commanded a 38.40% share of the UK fixed connectivity market size in 2025; however, offerings above 1 Gbps are growing at a 12.85% CAGR.
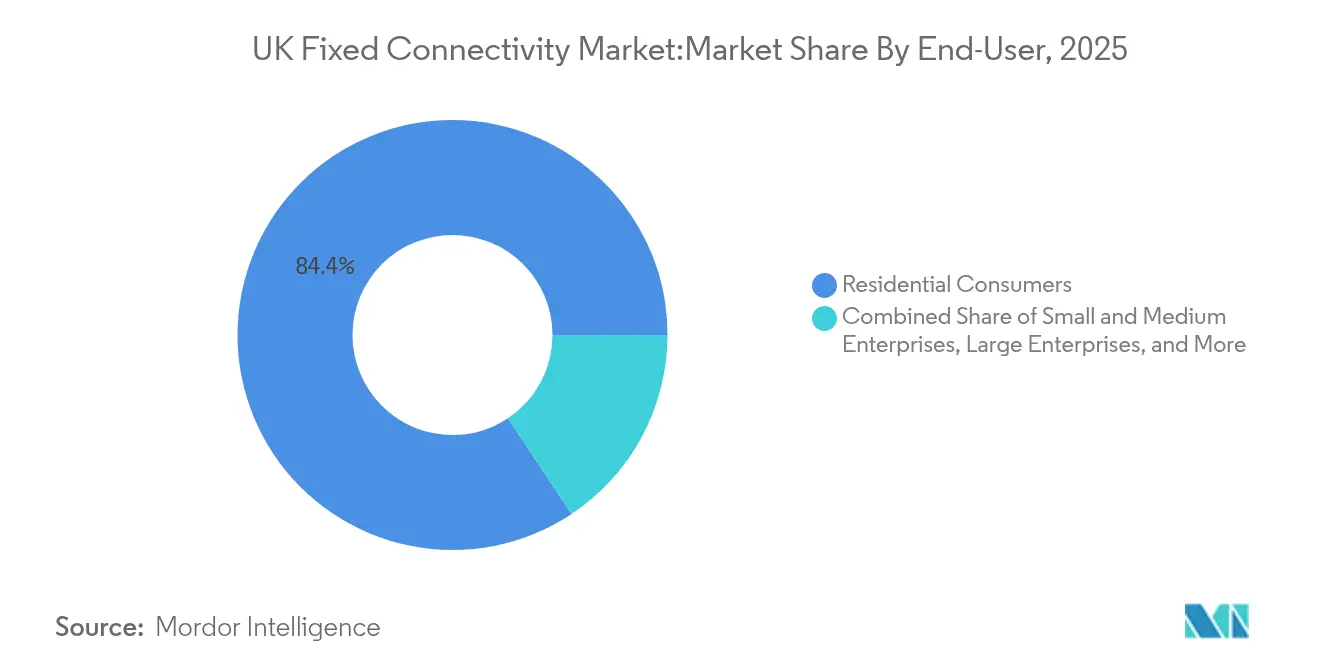
- By end-user, Residential customers accounted for 84.35% of the UK fixed connectivity market's revenue in 2025, while Small and Medium Enterprises are forecast to advance at a 9.60% CAGR to 2031.
- By industry vertical, IT and Telecom generated 23.70% of the UK fixed connectivity market's revenue in 2025; healthcare connectivity is rising at a 9.18% CAGR, driven by NHS digitalization programs.
Note: Market size and forecast figures in this report are generated using Mordor Intelligence’s proprietary estimation framework, updated with the latest available data and insights as of 2026.
UK Fixed Connectivity Market Trends and Insights
Drivers Impact Analysis*
| Driver | (~) % Impact on CAGR Forecast | Geographic Relevance | Impact Timeline |
|---|---|---|---|
| Rapid roll-out of FTTP altnets | +2.50% | National, strongest in competitive urban clusters | Short term (≤ 2 years) |
| Project Gigabit rural subsidies | +2.20% | National, concentrated in underserved rural regions | Medium term (2–4 years) |
| Data-heavy streaming and cloud gaming demand | +1.90% | Global, strongest in youth-heavy and urban markets | Short term (≤ 2 years) |
| Enterprise need for symmetrical gigabit lines | +1.70% | Global, concentrated in financial and tech districts | Medium term (2–4 years) |
| Open-access dark-fiber wholesale model | +1.40% | National, strongest in liberalized telecom markets | Long term (≥ 4 years) |
| Sustainability preference for fiber | +1.10% | Global, strongest in EU and progressive regulatory regions | Long term (≥ 4 years) |
| Source: Mordor Intelligence | |||
Rapid Roll-out of FTTP Altnets
Alternative operators expanded full-fiber coverage from 12.9 million premises in 2022 to 16.7 million by the end of 2024, a 57% leap that far outpaced historic incumbent build rates.[1]Mark Jackson, “Altnets Pass 12.9 Million UK Homes,” ispreview.co.uk CityFibre aims to pass 8 million premises by 2025, while Netomnia has introduced the first commercial 50 G PON platform in the United Kingdom. Aggressive pricing from altnets dominates entry-level packages and has compressed incumbent tariffs; yet, take-up averages only 16% versus Openreach’s 34%, which signals a customer acquisition gap. Sustained investor backing and supportive regulation continue to fuel this fiber land grab across metropolitan corridors. The surge in infrastructure overlap has nonetheless lifted street works congestion and intensified marketing costs for all players.
Project Gigabit Rural Subsidies
The GBP 5 billion Project Gigabit fund enabled 60,000 Scottish premises to gain fibre links by 2024 and underpinned a GBP 106 million contract that targets another 68,342 rural locations in North-East Scotland. Complementary Welsh awards push coverage toward 89-93% by 2026, while niche providers such as GoFibre now serve 100,000 premises in northern England and the Scottish Borders. The blend of public subsidies with private capital has turned previously uneconomic clusters into sustainable build cases. Rural households gain parity with urban peers on gigabit access, which narrows the digital divide and broadens the addressable base for ultrafast subscriptions. Operators note that a subsidy certainly also lowers financing costs, improving project viability.
Data-heavy Streaming and Cloud Gaming Demand
Virgin Media O2 recorded a 17% year-on-year increase in average download speeds to 368 Mbps in Q1 2024 as 4K video, real-time cloud gaming, and remote work tools lifted bandwidth needs. Above 1 Gbps subscriptions, the fastest growing speed tier, mirror this usage shift and now appeal to early adopters seeking latency-free entertainment and collaboration. Content platforms from Netflix, Amazon, and Microsoft demand continuous multi-hundred-megabit streams that stretch legacy DSL and coax networks. Full-fiber symmetry, therefore, becomes a key selling point and commands modest price premiums. Peak-time traffic curves stay elevated, reinforcing operators’ capex plans for higher-capacity transport and access equipment.
Enterprise Need for Symmetrical Gigabit Lines
The NHS requires stable, symmetric fibre to support telemedicine, cloud records and diagnostic imaging across 5,800 sites. Manufacturers are embedding IoT sensors and real-time analytics that depend on balanced upstream and downstream rates, while universities such as Bristol manage 300,000 concurrent device connections over campus Wi-Fi. SMEs, the fastest growing customer group, upgrade from entry broadband to dedicated circuits as they accelerate SaaS adoption. UK Telecoms Innovation Network estimates that advanced connectivity could inject GBP 6.3 billion into manufacturing output by 2030. Operators respond with bespoke gigabit tariffs that bundle service level guarantees and cybersecurity features.
Restraints Impact Analysis*
| Restraint | (~) % Impact on CAGR Forecast | Geographic Relevance | Impact Timeline |
|---|---|---|---|
| Wayleave and street-works permit delays | -2.60% | National, strongest in dense urban municipalities | Medium term (2–4 years) |
| Inflation-driven network build costs | -2.30% | Global, strongest in emerging and inflation-prone economies | Short term (≤ 2 years) |
| Consumer price-cap pressure on ARPU | -1.80% | National, strongest in regulated telecom markets | Long term (≥ 4 years) |
| Fiber-skilled labour shortage | -1.50% | Global, strongest in fast-scaling deployment regions | Medium term (2–4 years) |
| Source: Mordor Intelligence | |||
Wayleave and Street-works Permit Delays
Telecom builders report that securing permissions can extend fibre projects by 6-18 months in crowded city boroughs where many utilities vie for the same duct routes. Community backlash against new poles has prompted government reviews that may compel expensive underground digs. Local authority processing teams lack the capacity to handle simultaneous applications from multiple altnets, which produces scheduling clashes and idle engineering crews. Openreach has tightened compliance rules that call for 90% accurate whereabouts reporting from contractors, raising administrative overhead for smaller builders. These hurdles inflate working capital requirements and slow revenue capture, especially for investors chasing rapid build-and-sell timelines.
Fiber-skilled Labour Shortage
Six in ten fibre engineers are older than 50, and only 3% are under 35, which signals a looming talent cliff. Although operators have set up crash courses such as Ogi’s eight-week certification and Openreach’s five-day workshops, annual graduate throughput falls well below the 30,000 technicians forecasted for the next decade. Fusion splicing and optical testing call for precise skills that cannot be mastered overnight. Veriforce surveys show 86% of telecom executives rank workforce availability as a top risk, while Virgin Media O2 has pledged 200 entry-level roles to ease pressure. Persistent scarcity inflates contractor rates and stretches deployment schedules, particularly for capital-constrained altnets.
*Our forecasts treat driver/restraint impacts as directional, not additive. The impact forecasts reflect baseline growth, mix effects, and variable interactions.
Segment Analysis
By Connection Technology: FTTP Transformation Accelerates
FTTC/VDSL still held 46.35% of the UK fixed connectivity market share in 2025, yet growth has plateaued as copper phase-out plans progress. FTTP, the star performer, is expanding at an 10.82% CAGR through 2031 and is expected to cross the 50% adoption mark well before the forecast horizon, which will fundamentally reshape the UK fixed connectivity market. Cable operators are migrating from DOCSIS to XGS-PON, evidenced by Virgin Media O2’s deployment of 2 Gbps symmetric services in March 2025. Digital Subscriber Line (DSL) products continue to undergo a managed sunset as BT extends its landline switchover deadline to January 2027. Fixed Wireless Access enjoys policy support for rural gaps, and UKWISPA quantifies a possible GBP 4 billion dividend from wider adoption. Starlink’s low-earth-orbit satellites bolster backhaul options for mobile sites in the Highlands, which highlights a multi-technology roadmap. The interplay of fibre, upgraded cable, and wireless alternatives keeps the UK fixed connectivity market dynamic and competitive.
Operators are increasingly discussing converged network blueprints that combine fibre foundations with 5G Fixed Wireless Access to unlock nationwide coverage at a lower average cost. Such hybrids appeal to investors looking for diversified revenue streams across wholesale dark fiber, retail broadband, and enterprise leased lines. Equipment vendors are also pitching software-defined access networks that can flex between GPON, XGS-PON, and future 50 G standards, which future-proofs capex decisions.


By Service Type: Data Dominance Drives Bundling
Standalone broadband captured 93.05% of 2025 revenue, underscoring the centrality of internet access in household budgets. Converged bundles are on a 6.55% growth path as operators pair broadband with Pay-TV, mobile SIMs, and streaming add-ons to defend margins in the face of fierce price competition. The UK fixed connectivity market has seen an uptick in promotional quad-play offers that waive installation fees and lock in introductory rates for 18 months, which helps reduce churn. Voice traffic keeps sliding because consumers favour app-based calling on unlimited mobile plans. BT’s switch to IP telephony accelerates this voice erosion and frees up copper resources for recycling.
Bundling strategies also let providers cross-sell cybersecurity add-ons, cloud storage, and smart-home monitoring, which lifts average revenue per user without a large incremental network cost. Virgin Media O2 is piloting Pay-TV bundles that integrate premium sports packages and dynamic streaming quality management. At the same time, consumer advocacy groups warn that lengthy contract tie-ins may clash with rising demand for flexibility. Operators are therefore experimenting with contract-free broadband tiers that carry slightly higher monthly rates but satisfy a growing cohort of renters and young professionals. The balance between stickiness and freedom will shape the profitability rhythm of the UK fixed connectivity market during the forecast window.
By Speed Tier: Gigabit Adoption Accelerates
Connections between 30 Mbps and 100 Mbps still accounted for 38.40% of subscriptions in 2025, anchored by mainstream households balancing performance and price. Above 1 Gbps links enjoy the fastest expansion at 12.85% CAGR as enterprises and tech-savvy families migrate to ultra-fast offers that future-proof their workflow. The transition tier of 100-300 Mbps continues to serve users upgrading from ADSL, yet not ready to pay for gigabit. Sub-30 Mbps lines dwindle as copper switch-off deadlines approach, which nudges holdouts toward fibre or high-capacity 5G home routers.
Operators leverage high-speed tiers as differentiation tools in congested urban postcodes. Openreach trialled GBP 50 gift cards to stimulate FTTP take-up, and early evidence indicates a modest uplift among price-sensitive customers. The prevalence of UHD streaming and multiplayer cloud gaming compresses the time consumers take to consider an upgrade, which shortens product life cycles. Equipment makers respond with Wi-Fi 7 gateways that eliminate in-home bottlenecks and sustain the perceived advantage of gigabit access. Growth in the ultrafast strata, therefore, remains a central pillar for revenue expansion across the UK fixed connectivity market horizon
By End-User: SME Growth Outpaces Residential
Residential accounts for 84.35% of 2025 revenue, which cements its volume dominance even as penetration approaches saturation. Small and Medium-Sized Enterprises are growing at a 9.60% CAGR because post-pandemic business models increasingly rely on cloud applications, video meetings, and e-commerce storefronts. That trend opens up a lucrative opportunity for managed services, such as secure SD-WAN, remote monitoring, and backup connectivity. Large enterprises continue to demand fibre-based Ethernet and wavelengths that deliver deterministic performance, while public bodies, such as schools and hospitals, benefit from ring-fenced funding pots.NHS digitalization alone covers 5,800 sites under the Gigabit Pathways programme and is a key swing factor for healthcare bandwidth demand. Universities mirror this surge with campus-wide Wi-Fi upgrades that host hundreds of thousands of devices concurrently. The UK fixed connectivity industry, therefore, faces a dual mandate to keep consumer tariffs attractive while packaging enterprise-grade options that carry service-level agreement premiums. Success in that balancing act will determine revenue quality as growth tilts toward service-hungry SMEs and institutions.
By Industry Vertical: Healthcare Digitalization Leads Growth
IT and Telecom generated 23.70% of 2025 revenue due to its heavy reliance on data centers, cloud interconnects, and wholesale backbones. Healthcare is the fastest-growing sector at 9.18% CAGR, as electronic health records, teleconsultations, and imaging repositories increase throughput requirements across geographically dispersed facilities. Financial services continue to invest in low-latency fibre for trading and compliance, while education commits to high-density Wi-Fi infrastructure that supports blended learning models. Manufacturing firms plan to harness 5G and fibre backbones that could inject GBP 6.3 billion into sector output by 2030.Retailers make omnichannel experiences a core pillar, which translates into robust connectivity for point-of-sale, click-and-collect, and inventory analytics. Media and entertainment houses push huge upstream video files, driving demand for symmetric gigabit uplinks. Logistics and hospitality look to smart tracking and guest-experience apps that require always-on bandwidth. The breadth of vertical use cases amplifies the resiliency of the UK fixed connectivity market by diversifying revenue streams across cyclically different industries.
Geography Analysis
England remains the principal revenue engine for the UK fixed connectivity market, with dense corridors such as London, Manchester, Birmingham, and Leeds delivering rapid customer growth. Openreach’s GBP 15 billion build programme is on course for 25 million premises by December 2026, which allocates a significant share to English addresses. CityFibre and Community Fibre intensify the rivalry by offering cut-price gigabit packages that keep churn active and encourage frequent speed upgrades. Project Gigabit grants also carve out funds for rural villages in counties like Cumbria and Northumberland, which expands the addressable pool beyond metropolitan clusters.
Scotland posts the fastest relative growth thanks to the GBP 600 million R100 scheme that has already connected 60,000 premises and targets another 114,000 by 2028. The Scottish National Investment Bank invested GBP 10 million in rural fibre ventures, supporting local brands such as Highland Broadband. Edinburgh and Glasgow see parallel altnet deployments that spur price drops and loyalty perks which mirror English competitive dynamics. Continued public-private synergy places Scotland on a trajectory to narrow the coverage gap and increase the regional slice of the UK fixed connectivity market size.Wales and Northern Ireland form the third growth tier, backed by Project Gigabit contracts worth GBP 139.1 million and GBP 136.1 million respectively, which push Welsh gigabit coverage toward 90% by mid-2026. Openreach’s Welsh building has already passed 816,000 premises with take-up at 33.95% which bodes well for revenue conversion. Northern Ireland leverages cross-border coordination with the Republic of Ireland as well as targeted subsidy schemes for remote farming communities. Despite smaller populations, these devolved nations play a strategic role because they extend operator footprints into fresh demand pockets that lift overall penetration of the UK fixed connectivity market.
Competitive Landscape
The industry exhibits moderate concentration, with Openreach and Virgin Media O2 still dominating the majority of access. However, collective altnet footprints now cover 12.9 million premises, equivalent to 35% of homes. Openreach relies on wholesale scale and a nationwide engineering force, while Virgin Media O2 accelerates its XGS-PON overbuild to transition 16 million Hybrid Fibre Coax premises to full fibre by 2028. CityFibre plans to make up to five acquisitions within two years to reach 8 million premises and challenge the incumbent's breadth. Netomnia differentiates itself through the deployment of 50 G PON, which raises headroom for enterprise services.
Horizontal integration is gathering pace, as illustrated by the completion of the Vodafone-Three merger in June 2025, which created a GBP 16 billion carrier with 27 million customers and an ambitious 5G Fixed Wireless Access roadmap. Vertical integration also rises as Virgin Media O2 progresses its NetCo wholesale strategy that could rival Openreach in the rental market.[4]Light Reading, “Virgin Media O2 Considers NetCo Spin-out,” lightreading.com Rural specialists GoFibre and Highland Broadband secure subsidies that shield them from direct head-to-head price wars with metro players.
Technological competition pivots on symmetric gigabit offers. Operators are racing to deploy XGS-PON and trial 25G and 50G optics to protect the enterprise and premium household segments. Satellite challenger Starlink enters backhaul agreements for remote cell sites, underscoring a multi-layered connectivity landscape. Continued consolidation is likely because many altnets require scale to refinance debt once initial build milestones taper. The balance between infrastructure overlaps and rational capex will define margin evolution in the UK fixed connectivity market.
UK Fixed Connectivity Industry Leaders
TalkTalk Group plc
Vodafone Limited
BT Group plc
bOnline Limited
Virgin Media O2
- *Disclaimer: Major Players sorted in no particular order

Recent Industry Developments
- March 2025: Virgin Media O2 activated XGS-PON upgrades delivering 2 Gbps symmetric speeds in first pilot zones.
- February 2025: Netomnia-Brsk merger completed creating a 1.5 million-premise footprint and plans for 3 million by year-end.
- February 2025: Sky UK announced average price rises of 6.2% for broadband, phone and TV services effective April 2025
- January 2025: BT secured a GBP 26 million Project Gigabit contract to connect 650 rural primary schools with full fibre broadband.


Research Methodology Framework and Report Scope
Market Definitions and Key Coverage
Our study defines the United Kingdom fixed connectivity market as all revenue earned inside the country from wired or static last-mile services, fiber-to-the-premises, fiber-to-the-cabinet/VDSL, cable/DOCSIS, digital subscriber lines, enterprise leased lines, and fixed wireless access contracts that behave like land lines, sold to residential, public-sector, and business customers.
Scope exclusion: mobile-only data plans, customer-premise hardware sales, satellite retail subscriptions, and offshore network revenue are left outside this definition.
Segmentation Overview
- By Connection Technology
- Fiber to the Premises (FTTP)
- Fiber to the Cabinet (FTTC/VDSL)
- Cable (DOCSIS)
- Digital Subscriber Line (DSL/ADSL)
- Fixed Wireless Access (FWA)
- Satellite Broadband
- By Service Type
- Fixed Data (Broadband)
- Fixed Voice
- Bundled Triple-/Quad-Play
- By Speed Tier
- Sub-30 Mbps
- 30 - 100 Mbps
- 100 - 300 Mbps
- 300 - 1 Gbps
- Above 1 Gbps
- By End-User
- Residential Consumers
- Small and Medium Enterprises
- Large Enterprises
- Public Sector and Institutions
- By Industry Vertical
- IT and Telecom
- BFSI
- Healthcare
- Education
- Manufacturing
- Retail and E-commerce
- Media and Entertainment
- Others (Logistics, Hospitality)
Detailed Research Methodology and Data Validation
Primary Research
Mordor analysts conduct structured interviews with incumbent network planners, alternative-network CFOs, wholesale channel partners, and multisite enterprise IT buyers across England, Scotland, Wales, and Northern Ireland. Insights on uptake elasticity, speed-tier mix, and promotional discounting are used to validate assumptions and close data gaps.
Desk Research
We anchor the demand pool with non-paywalled tier-1 datasets such as Ofcom's Connected Nations coverage files, the Office for National Statistics telecom revenue tables, Eurostat household-penetration series, the OECD Broadband Portal, and periodic briefs from techUK. These quantify line counts, penetration, and pricing baselines. Annual and interim reports filed by listed operators, investor day decks, reputable trade journals, plus paid libraries that Mordor licenses, D&B Hoovers for segment financials and Dow Jones Factiva for tariff histories, supply granularity on average selling prices and wholesale rate shifts. The sources named illustrate our approach and are not exhaustive.
Market-Sizing & Forecasting
A top-down model converts Ofcom-reported active fixed lines and ASPs into 2025 revenue, then cross-checks totals with bottom-up roll-ups from operator disclosures. Five fingerprints, full-fiber premises passed, fixed-mobile substitution rate, downstream speed purchased, CPI-adjusted retail tariffs, and gigabit-voucher drawdown shape historical calibration and feed a multivariate regression that projects to 2030, with scenario analysis around subsidy policy shifts. Where operator splits are missing, sampled ASP-by-speed cohorts are applied to line counts to bridge gaps.
Data Validation & Update Cycle
Outputs face variance checks versus independent coverage, analyst peer review, and senior sign-off. Models refresh annually, while mid-cycle updates trigger if material tariff moves or regulatory rulings alter the baseline.
Why Mordor's Uk Fixed Connectivity Baseline Commands Reliability
Published estimates often differ because firms mix service baskets, convert currencies at varying dates, and refresh at uneven intervals.
Many external figures count only consumer broadband, some translate pound values to dollars at spot rates, and others assume every new fiber-passed premise immediately becomes a subscriber. Mordor, by triangulating subscriber take-up with ASP erosion and updating yearly, delivers a tempered, decision-ready view.
Benchmark comparison
| Market Size | Anonymized source | Primary gap driver |
|---|---|---|
| USD 35.28 bn (2025) | Mordor Intelligence | - |
| USD 34.01 bn (2024) | Regional Consultancy A | Omits leased-line and business voice revenue; earlier base year |
| GBP 34.02 bn (2025) | Global Consultancy B | Uses spot FX and equates premises-passed with immediate subscriptions |
The comparison shows values cluster tightly, yet Mordor's disciplined source mix, annual refresh, and transparent variables offer the most dependable baseline for strategic planning.


Key Questions Answered in the Report
What is the current value of the UK fixed connectivity market?
The market is valued at USD 36.57 billion in 2026 and is on track to hit USD 43.72 billion by 2031.
Which technology segment is growing the fastest?
Fiber-to-the-Premises leads with an 10.82% CAGR as operators phase out copper and upgrade cable to full fibre.
How much of the market still relies on FTTC/VDSL?
FTTC/VDSL held 46.35% of lines in 2025 but its share is expected to shrink as fibre coverage widens.
Why are gigabit subscriptions rising quickly?
Data-heavy streaming, cloud gaming and enterprise cloud adoption push consumers and businesses toward symmetrical 1 Gbps and above connections which show a 12.85% CAGR.
What role does government funding play in rural broadband?
The GBP 5 billion Project Gigabit and Scotland’s R100 programme subsidize fibre builds in hard-to-serve areas and have already connected tens of thousands of rural premises.
Are skilled labour shortages a serious threat to rollout targets?
Yes, 60% of fibre engineers are over 50 and current training pipelines meet only a fraction of the 30,000 technicians needed over the next decade which could slow future build plans.
Page last updated on:


