Fixed-Line Communications Market Size and Share
Market Overview
| Study Period | 2020 - 2031 |
|---|---|
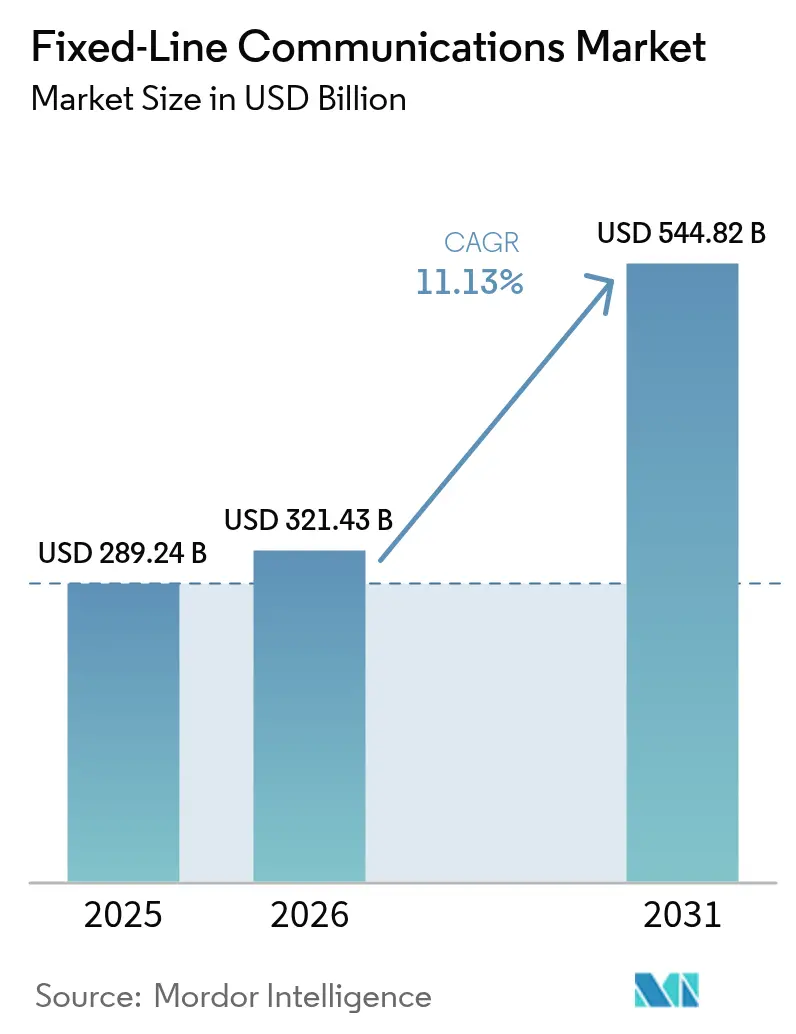
| Market Size (2026) | USD 321.43 Billion |
| Market Size (2031) | USD 544.82 Billion |
| Growth Rate (2026 - 2031) | 11.13% CAGR |
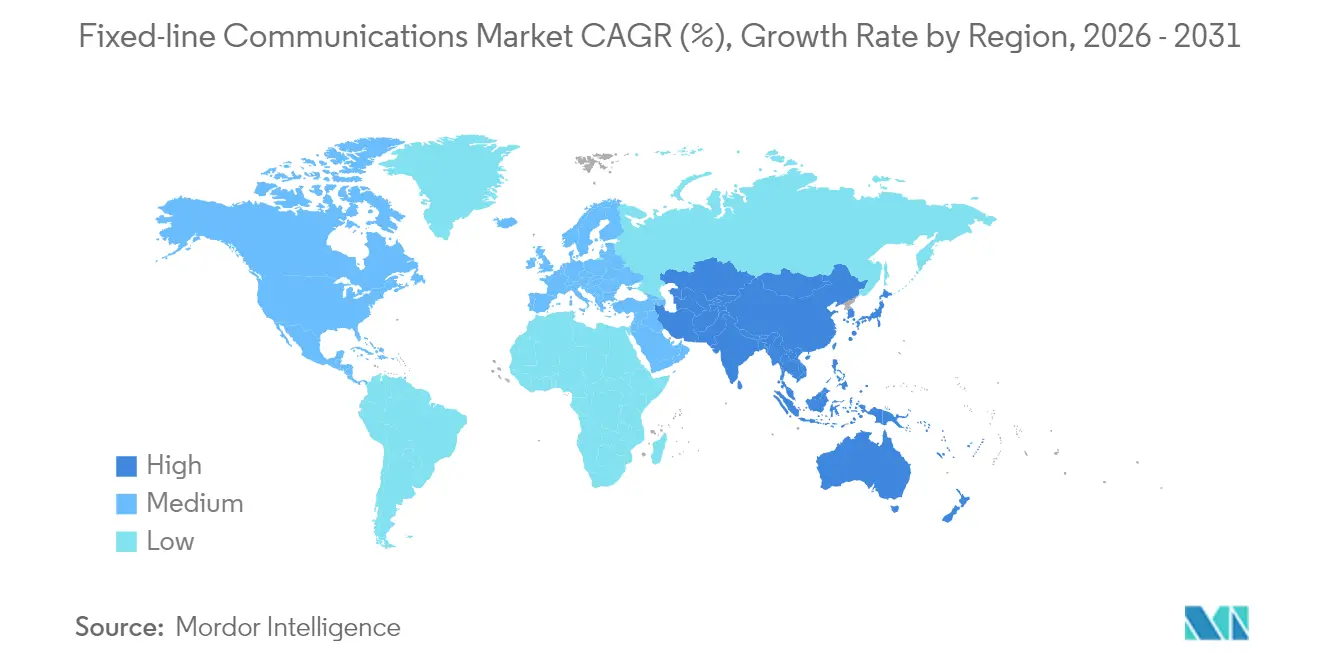
| Fastest Growing Market | Asia Pacific |
| Largest Market | Asia Pacific |
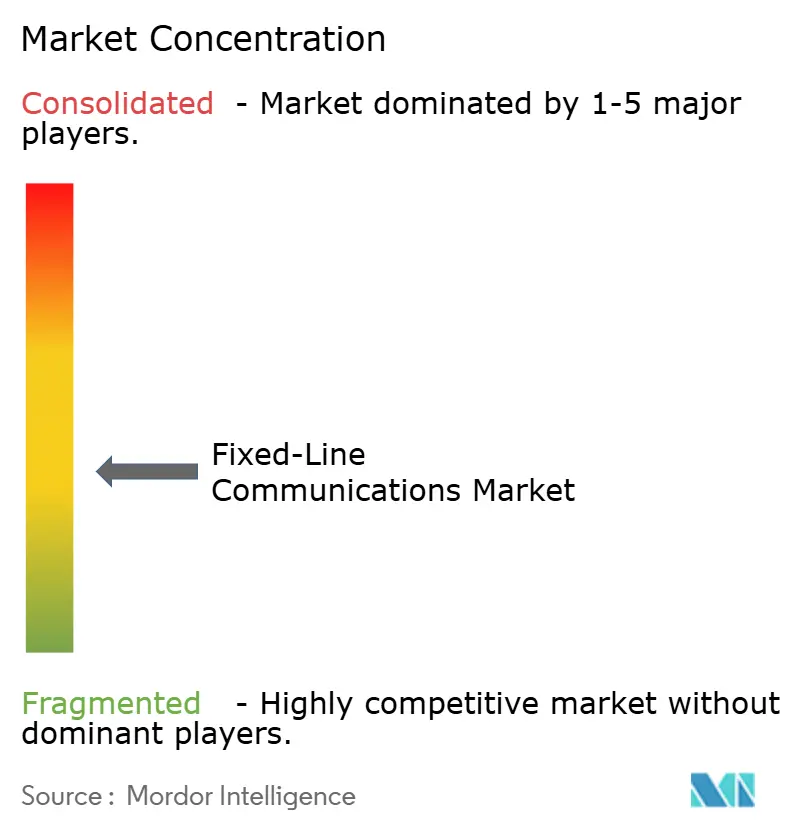
| Market Concentration | Medium |
Major Players *Disclaimer: Major Players sorted in no particular order Image © Mordor Intelligence. Reuse requires attribution under CC BY 4.0. | |
Fixed-Line Communications Market Analysis by Mordor Intelligence
Fixed-line communications market size in 2026 is estimated at USD 321.43 billion, growing from 2025 value of USD 289.24 billion with 2031 projections showing USD 544.82 billion, growing at 11.13% CAGR over 2026-2031. Sustained growth reflects how the fixed-line communications market underpins cloud computing, artificial intelligence workloads, and 5G back-haul requirements, cementing its role as foundational digital infrastructure.[1]European Commission, “Digital Decade Targets,” ec.europa.eu Symmetric gigabit targets adopted by the European Union, the United States, and multiple Asia-Pacific governments continue to accelerate fiber roll-outs, while data-sovereignty rules spur enterprises to keep latency-sensitive traffic on national networks. Rapid hyperscale data-center construction strains legacy backbones, pushing operators toward 800 G and terabit optical upgrades that lift equipment demand. In parallel, open-standards initiatives and software-defined networking shift competitive advantage from hardware features toward programmable platforms, creating opportunities for new vendors that can match low-latency service-level commitments. Mounting regulatory pressure to streamline right-of-way permits suggests that deployment speed, not end-user appetite, will determine how fast the fixed-line communications market captures its addressable demand.[2]Wireless Estimator, “Pole-Attachment Delays Could Cost Federal Broadband Billions,” wirelessestimator.com
Key Report Takeaways
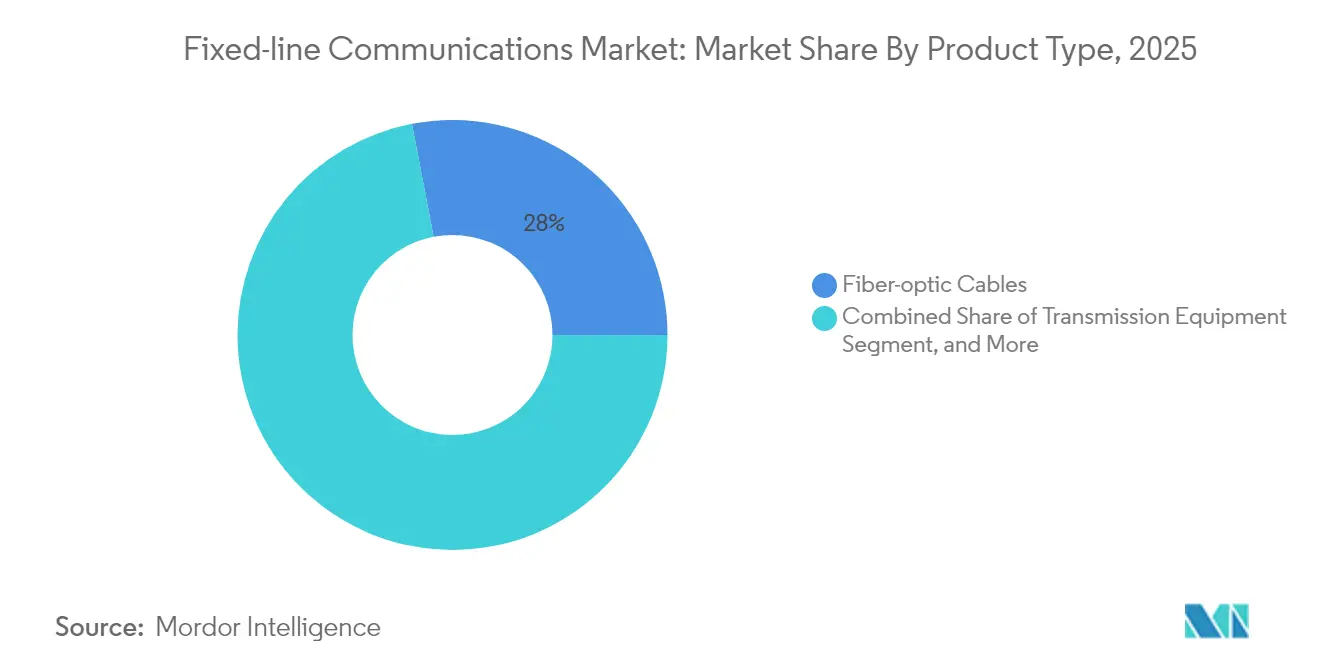
- By product category, fiber-optic cables led with 28.02% revenue share in 2025; access equipment is expanding at a 13.45% CAGR through 2031.
- By service type, fixed broadband data services held 68.45% of the 2025 revenue pool, while IPTV and other value-added services posted the fastest growth at 12.05% CAGR to 2031.
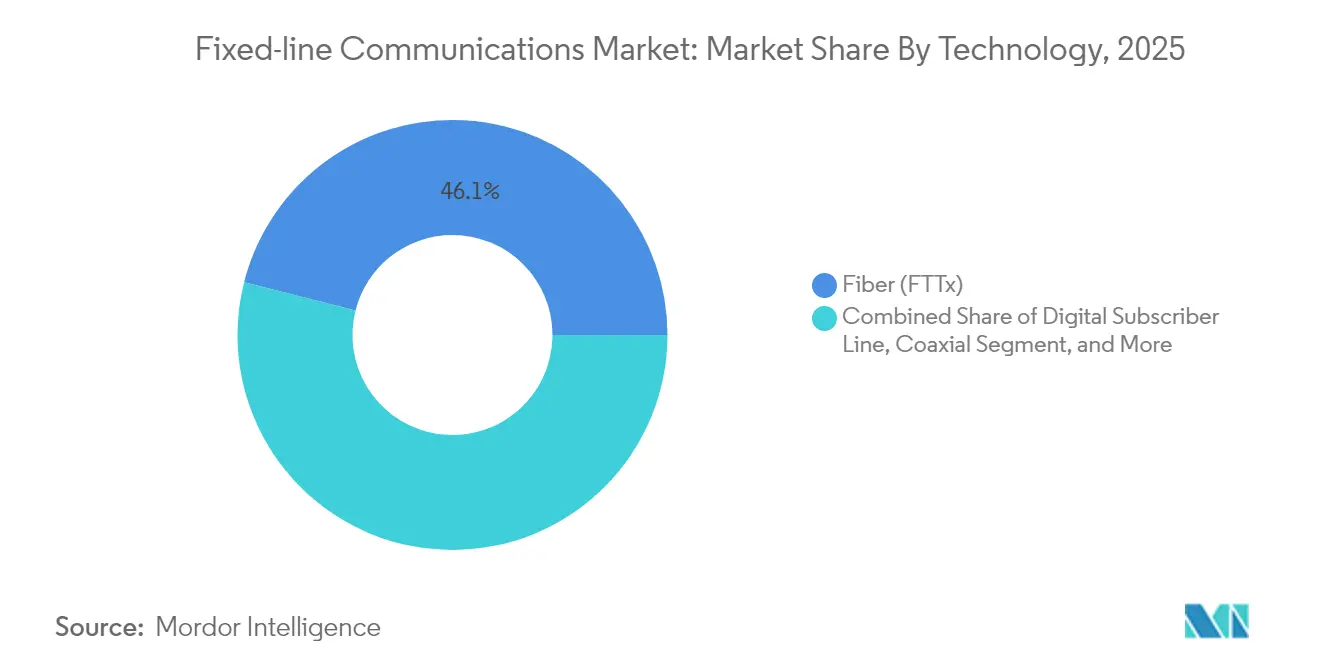
- By technology, fiber captured 46.05% fixed-line communications market share in 2025, and fiber-to-the-home deployments are projected to advance at an 18.22% CAGR.
- By end user, residential connections accounted for 55.25% revenue in 2025, whereas data-center demand is rising at a 14.25% CAGR through 2031.
- By geography, Asia Pacific commanded 38.45% of the total 2025 revenue and is projected to maintain an 11.18% CAGR to 2031.
Note: Market size and forecast figures in this report are generated using Mordor Intelligence’s proprietary estimation framework, updated with the latest available data and insights as of 2026.
Global Fixed-Line Communications Market Trends and Insights
Drivers Impact Analysis*
| Driver | (~) % Impact on CAGR Forecast | Geographic Relevance | Impact Timeline |
|---|---|---|---|
| Gigabit-speed broadband demand in dense cities | +2.8% | Global, markedly North America and EU | Medium term (2-4 years) |
| Large-scale FTTH programs by incumbents and altnets | +3.2% | Global; APAC shows largest build volumes | Long term (≥ 4 years) |
| Hyperscale data-center back-haul needs | +2.1% | Global, clustered in cloud regions | Short term (≤ 2 years) |
| Universal-service subsidies (BEAD, CEF-2, RDOF) | +1.9% | Primarily North America and EU | Medium term (2-4 years) |
| Re-use of legacy copper ducts to cut civil works | +1.4% | Mature telecom markets worldwide | Short term (≤ 2 years) |
| Edge-compute densification for low latency links | +1.6% | Urban and industrial zones globally | Medium term (2-4 years) |
| Source: Mordor Intelligence | |||
Rising demand for gigabit-speed broadband in urban clusters
- Remote work, multi-stream 4K video, and cloud gaming have made multi-gigabit service a baseline expectation in major cities. Operators can no longer rely on oversubscription rules that once kept capacity costs in check; instead, they push symmetric fiber deeper into apartment blocks to guarantee high-throughput paths. Enterprise tenants in mixed-use buildings additionally request guaranteed uplink speeds for cloud backup and video collaboration, allowing carriers to bundle premium SLAs at higher average revenue per user. Dense geography shortens fiber build paybacks, encouraging aggressive promotional pricing that locks in market share before 5G fixed-wireless alternatives gain traction. Municipal digital-equity policies further amplify adoption by underwriting low-income household connections, indirectly boosting take rates for premium tiers once the fiber is in place.
Massive fiber-to-the-home roll-outs by incumbents and altnets
Incumbent telcos have shifted from incremental copper upgrades to full-scale fiber replacement, as seen in AT&T’s pledge to pass 30 million premises with FTTH by 2026. Challenger altnets, backed by infrastructure funds, pick off pockets of under-served suburbs, forcing faster reactions from legacy operators eager to defend their base. Subsidy frameworks such as BEAD in the United States redirect billions toward rural builds, further tilting the cost equation in favor of deep fiber. The combination of faster deployment techniques (micro-trenching, connectorized drops) and duct re-use lowers capex per home, keeping internal rates of return attractive even in mid-density territories. Longer term, establishing a ubiquitous fiber platform positions carriers to upsell edge-compute hosting and private 5G services.
Cloud/hyperscale data-center back-haul requirements
Artificial-intelligence training clusters transmit multi-terabit data sets between facilities, stressing existing inter-data-center links. Cloud providers such as Google and Meta now lay their own long-haul dark fiber and subsea cables to guarantee predictable latency and bandwidth. Telecom operators that own contiguous metro and long-haul fiber can tap this demand by offering managed dark-fiber leases bundled with redundant routes. As hyperscalers push compute nodes closer to users, short-reach point-to-point fiber rings inside urban zones become essential, creating premium revenue slices for providers that can meet sub-millisecond targets.
Government universal-service and subsidy programs (BEAD, RDOF, EU CEF-2)
The USD 42.45 billion BEAD fund obliges recipients to build networks that deliver at least 100/20 Mbps while holding prices at “affordable” levels for a defined period. Comparable support from the European CEF-2 instrument prioritizes cross-border links that tighten digital-single-market integration. These subsidies de-risk rural deployments and create a pipeline of shovel-ready projects that keep labor crews employed for years. Procurement clauses that favor domestic sourcing reshape vendor landscapes, rewarding suppliers with certified local manufacture.
Restraints Impact Analysis*
| Restraint | (~) % Impact on CAGR Forecast | Geographic Relevance | Impact Timeline |
|---|---|---|---|
| High capex and long ROI on last-mile fiber | -1.7% | Global, hardest for small carriers | Long term (≥ 4 years) |
| Substitution risk from 5G fixed-wireless and satellite | -1.2% | Rural and suburban markets worldwide | Medium term (2-4 years) |
| Skilled-labor shortages for fiber splicing | -0.9% | North America and EU | Short term (≤ 2 years) |
| Municipal right-of-way and pole-access delays | -1.1% | North America and EU | Medium term (2-4 years) |
| Source: Mordor Intelligence | |||
High capex and long ROI cycles for last-mile fiber
Passing a single rural premise can cost more than USD 1,000, a figure that climbs sharply in rocky or mountainous terrain. Smaller carriers without scale economics shoulder significantly higher financing costs, and their debt covenants often dictate slower roll-out schedules. Where crews must attach fiber to utility poles, make-ready work and legal disputes over attachment fees add months of delay. Wage inflation for certified fiber splicers compounds the problem, with some markets offering signing bonuses that previously only mobile-network engineers received. Although government grants defray part of the build expense, restrictions on permissible vendors or technology can push total project cost back up, stretching payback periods beyond typical investor horizons.
Substitution risk from 5G fixed-wireless and satellite broadband
Verizon has already amassed more than 4.8 million fixed-wireless subscribers using 5G mid-band spectrum, validating demand for “quick-install” home broadband that bypasses trenching delays. Similarly, Starlink’s low-earth-orbit constellation provides 100 Mbps-plus speeds in regions where fiber returns are marginal. While neither option currently matches fiber’s scalability, both meet baseline definitions of broadband and can lock in early customers before a fiber crew reaches the area. Operators therefore face a race: build fiber first or risk a permanent share penalty, especially in thinly populated counties.
*Our forecasts treat driver/restraint impacts as directional, not additive. The impact forecasts reflect baseline growth, mix effects, and variable interactions.
Segment Analysis
By Product Type: Fiber infrastructure anchors equipment demand
Fiber-optic cables generated 28.02% of revenue in 2025, cementing their position as the volume backbone of the fixed-line communications market. Intensifying demand for 800 G coherent transmission pushes operators to accelerate outside-plant upgrades, while associated optical line terminals and passive splitters lift access-equipment spend at a 13.45% CAGR. Transmission-equipment vendors benefit as carriers swap legacy 100 G optics for pluggables that halve power per bit, enhancing total network efficiency. Switching gear revenue expands in tandem because software-defined control planes require high-performance leaf-spine fabrics inside central offices.
Customer-premises equipment continues to ride the multi-gigabit wave as households adopt Wi-Fi 7 routers and mesh nodes. Vendors now bundle managed Wi-Fi analytics that let carriers troubleshoot in-home performance remotely, reducing truck rolls. Meanwhile, fixed-wireless CPE shipments overtook DOCSIS modems in 2024, showing that wireless substitution can capture specific deployment scenarios even as the fixed-line communications market size for fiber remains dominant.


By Service Type: Data eclipses voice revenues
Fixed broadband data services accounted for 68.45% of total 2025 revenue, confirming the irreversible pivot from minutes-based billing to bandwidth monetization. IPTV and other value-added platforms follow with a 12.05% CAGR, reflecting how carriers translate sunk fiber investments into recurring content and cloud-gaming revenue. Traditional fixed voice continues its secular slide as enterprises migrate to cloud PBX offerings and households rely exclusively on mobile.
Managed service bundles that merge connectivity with cybersecurity and edge-compute orchestration gain favor, especially among mid-sized enterprises lacking in-house IT teams. Enhanced video analytics powered by on-network AI engines enable ultra-targeted advertising, adding incremental margins without additional capex.
By Technology: Fiber accelerates legacy migration
Fiber solutions held 46.05% revenue in 2025, while FTTH alone is on course for an 18.22% CAGR through 2031, confirming that symmetrical gigabit is now table stakes rather than a luxury. The fixed-line communications market size tied to legacy DSL shrinks each quarter as operators set firm copper switch-off dates to free maintenance budgets for all-fiber builds. Cable MSOs deploy DOCSIS 4.0 to stay competitive, yet still roadmap eventual all-fiber overlays to escape RF noise ceilings.
China’s early adoption of 50 G-PON frames global component roadmaps, pushing optics vendors to lower cost curves faster. In Europe, regulators condition wholesale-only models on accelerated copper decommissioning, causing incumbents to announce city-by-city fiber migrations that protect EBITDA while satisfying policy mandates.
By End User: Data centers reshape enterprise mix
Residential customers supplied 55.25% of 2025 revenue, but data-center demand is the fastest riser at a 14.25% CAGR. Hyperscalers contract long-term dark-fiber IRUs that guarantee 40-year access, providing carriers with stable cash flows but raising network availability standards to “five nines” or better. Small- and medium-enterprise customers leverage new open-access wholesale regimes to price-shop, forcing retail providers to add value via managed network security and IoT integration.
Large enterprises increasingly seek hybrid-cloud architectures that loop branch offices into regional edge-compute nodes over private 10 G links. Government agencies extend zero-trust policies to transport layers, prompting carriers to certify end-to-end encryption that meets sovereign data-residency requirements.
Geography Analysis
Asia Pacific retained 38.45% of 2025 revenue and is projected to expand at an 11.18% CAGR, cementing its position as the largest fixed-line communications market. China’s mandate for 10 G city networks drives nationwide fiber deployment, while India’s Digital Bharat program triggers public–private joint ventures that add more than 0.5 million route-kilometers annually. Japanese and Korean operators upgrade to 25 G and 50 G PON to support immersive media and industrial automation.
North America leverages the BEAD program to close rural gaps. Tier-1 carriers accelerate urban builds, racing satellite broadband players to lock in long-term subscribers. Verizon’s fixed-wireless subscriber gains highlight substitution risk, yet fiber build counts hit new quarterly highs as pole-attachment reforms shorten permitting queues. Canadian open-access rules compel incumbents to wholesale fiber loops, fostering retail competition that stimulates take-rates without eroding network-owner economics.
Europe’s Gigabit Infrastructure Act streamlines trenching approvals and enforces “dig-once” coordination, cutting civil-works costs by double digits. France and Spain now post FTTH take-up rates above 75%, proving demand elasticity once ubiquitous gigabit service is available. Germany’s late start accelerates on the back of private-equity-funded altnets, while the United Kingdom’s Project Gigabit auctions extend coverage to hard-to-reach hamlets.

Regulatory Landscape
Regulation continues to affect build pace, competitive structure, and equipment compliance across fixed-line markets. In Canada, the Canadian Radio-television and Telecommunications Commission (CRTC) moved wholesale broadband pricing toward final, cost-based frameworks in 2026, including Telecom Order 2026-77 on wholesale fibre-to-the-premises access rates and subsequent actions that set final aggregated wholesale HSA rates effective 24 April 2026, reinforcing wholesale access as a lever for retail competition.
Equipment and standards compliance is also tightening. India notified the Telecommunications (Framework to Notify Standards, Conformity Assessment and Certification) Rules, 2025, and the Telecommunication Engineering Centre (TEC) continued publishing and updating government-notified technical standards in 2026 for network elements such as LAN switches and 5G core requirements, expanding the role of mandatory testing and certification in procurement and vendor qualification. At the global level, ITU-T supplements published in October 2025 for G-series recommendations point to continued standardization around fibre-in-premises evolution for home and SME deployments, aligning vendor roadmaps with higher-speed in-building fiber architectures.
Value Chain Analysis
The fixed-line communications value chain covers upstream raw materials and components (glass preforms, fiber draw capacity, semiconductors, optics, and electronic assemblies), midstream manufacturing and integration (fiber-optic cables, OLT/ONT and access platforms, IP routing and switching systems, coherent optical transport and transceivers), and downstream engineering, construction, and operations (civil works, permitting, pole attachment, splicing/testing, installation, and managed operations for residential and enterprise services). Large operators and hyperscalers influence demand signals through long-horizon capacity planning for metro, long-haul, and data-center interconnect, while subsidy frameworks add procurement and reporting requirements that shape supplier selection.
Supply constraints are also affecting delivery. Trade and industry sources flag tightness across fiber and optics as AI-driven data-center buildouts compete with broadband roll-outs. The Fiber Broadband Association highlighted supply-chain pressure points in 2025, including longer lead times for critical components, stretching from typical 8 to 12 weeks up to as long as one year in some 2025-2026 cases, while commentary from industry participants such as Incab America pointed to emerging fiber shortages tied to data-center demand. Compliance requirements linked to US BEAD funding, including Build America, Buy America provisions, add complexity for operators managing multi-vendor sourcing, domestic content rules, and deployment schedules across access equipment, CPE, and outside-plant materials.
Competitive Landscape
The fixed-line communications market displays moderate concentration. Huawei, Nokia, and Cisco defend installed bases with full-stack portfolios that combine optical transport, IP routing, and network-automation software. Nokia’s USD 2.3 billion acquisition of Infinera adds high-capacity coherent optics, extending the company’s reach-of-fiber proposition into ultra-long-haul routes.
Hyperscale cloud providers emerge as quasi-competitors by building private global backbones, yet they also act as anchor tenants for wholesale dark fiber, driving steady revenue for carriers with extensive footprints. Meanwhile, open-standards bodies such as the Telecom Infra Project lower switching costs, enabling tier-2 operators to diversify supplier rosters. Vendors respond by releasing disaggregated chassis that integrate white-box hardware with hardened NOS software.
Artificial-intelligence-driven network operations platforms become a key differentiator. Ericsson’s partnership with GCI in Alaska illustrates how predictive analytics cuts mean-time-to-repair in harsh climates.[4]Ericsson, “GCI Selects Ericsson Cloud-Native 5G Core,” ericsson.com HPE’s planned USD 14 billion purchase of Juniper Networks signals a broader convergence between enterprise IT and carrier networking, promising integrated solutions that blur traditional demarcation lines.
Fixed-Line Communications Industry Leaders
Arris International PLC
Broadcom Inc.
Arista Networks Inc.
Huawei Technologies Co. Ltd
Nokia Corp.
- *Disclaimer: Major Players sorted in no particular order

Market Opportunities and Future Outlook
Network modernization programs and long-haul backbone builds are creating defined whitespace for optical transport upgrades, higher-speed PON access, and automation-centric operations. In Europe, Proximus initiated a four-year modernization of its optical (DWDM) network in July 2026, covering 700 nodes using Ekinops technology, which reflects an active replacement cycle for metro and backbone photonics as operators target higher capacity and improved energy efficiency. Similar investment themes extend across carrier and wholesale-fiber footprints linking regional markets to compute clusters, including Uniti Group starting a 1,100-route-mile fiber expansion across the South-Central United States in January 2026 to connect Tier-1 markets with AI data-center hubs.
In emerging and capacity-constrained corridors, each incremental increase in backbone kilometers and platform upgrades opens opportunities for transmission vendors, systems integrators, and construction-focused partners, while also drawing through demand for access and aggregation equipment. NEC reported in February 2026 on Eletronet expanding Brazil's fiber backbone by 8,000 km across 23 states using Nokia 1830 platforms, underscoring carrier-grade optical transport as an enabler of national-scale backbone densification. In Australia, Vocus announced the Australian Digital Infrastructure Platform and a $500 million ducted long-haul fiber route between Sydney and Melbourne in June 2026, pointing to new-build projects that expand addressable demand for cables, ducting, optical line systems, and route engineering, alongside the operational tooling needed to deliver low-latency services for enterprise, public sector, and data-center end users.
Recent Industry Developments
- July 2026: Nokia was selected by Orange Belgium as the sole supplier for a multi-year fixed and mobile transport network modernization using the Nokia 1830 Photonic Service Switch (PSS) platform. The project supports converged transport and higher-capacity optical backhaul, strengthening Nokia's position in carrier photonic switching while accelerating operator refresh cycles for metro and backbone networks.
- June 2026: Vocus announced the Australian Digital Infrastructure Platform and a $500 million ducted long-haul fiber route between Sydney and Melbourne, signaling a major push to expand national fiber connectivity. The initiative expands addressable demand for cables, ducting, optical line systems, and route engineering, while enabling low-latency services for enterprise, public sector, and data-center end users.
- May 2026: Broadcom launched the BCM68850 end-to-end 50G ITU-PON home gateway SoC with an integrated neural processing unit, targeting next-generation multi-gigabit fiber access gateways. By pushing more functionality into silicon for ONT and gateway designs, the release supports higher-speed PON upgrades and lowers power and cost in access CPE.


Research Methodology Framework and Report Scope
Market Definition and Coverage
This market covers revenues tied to fixed line communications delivered over wired access, including fixed voice, fixed broadband, and IPTV-related connectivity where service is provided through copper, coax, or fiber networks.
Scope exclusions: We exclude purely mobile and satellite access services and also exclude wholesale dark fiber sold as unlit capacity.
Segmentation Overview
- By Product Type
- Transmission Equipment
- Switching Equipment
- Access Equipment (DSLAM, OLT, etc.)
- Customer-Premises Equipment (Routers, STB, ONT)
- Fiber-optic Cables
- Others
- By Service Type
- Fixed Voice
- Fixed Broadband Data
- IPTV / Value-added Services
- By Technology
- Digital Subscriber Line
- Coaxial (Docsis)
- Fiber (FTTx/FTTH)
- Hybrid Fiber-Coax
- By End User
- Residential
- Small and Medium Enterprises
- Large Enterprises
- Government and Public Sector
- Data Centers
- By Geography
- North America
- United States
- Canada
- Mexico
- South America
- Brazil
- Argentina
- Rest of South America
- Europe
- Germany
- United Kingdom
- France
- Russia
- Rest of Europe
- Asia Pacific
- China
- India
- Japan
- South Korea
- ASEAN
- Rest of Asia Pacific
- Middle East and Africa
- Middle East
- Saudi Arabia
- United Arab Emirates
- Turkey
- Rest of Middle East
- Africa
- South Africa
- Nigeria
- Rest of Africa
- Middle East
- North America
Data Sources, Market Sizing, and Validation
Desk Research
Desk work starts by building a clean fact base on fixed broadband and fixed voice connections, network build-outs, and operator revenue trends. Public sources such as the ITU, the World Bank, national telecom regulators, OECD broadband statistics, and telecom standards bodies help anchor definitions and support consistent time series.
We then add operator and vendor disclosures such as annual reports, investor presentations, and earnings call transcripts, which help indicate ARPU direction, fiber passings, and capex intensity. For countries where visibility is lower, we also use paid subscriptions for company financials and intelligence, and we cross-check shipment and trade signals using an import-export shipment-level database when relevant. The examples listed above are not exhaustive, and other public and paid sources were used across data collection, validation, and research clarification.
Primary Interviews and Surveys
Primary work is used to confirm how operators and ecosystem participants recognize fixed line revenue buckets, and how they treat items like IPTV, leased lines, and enterprise access in reporting. We speak with a mix of network operators, infrastructure providers, equipment makers, and channel partners across APAC, EMEA, and the Americas, so model assumptions can be checked across mature and emerging fiber markets.
Distribution of primary research fieldwork respondents
| Company type | Respondent position | Region |
|---|---|---|
| Top tier: 28% | CXOs: 12% | APAC: 49% |
| Mid tier: 55% | Functional/Unit leaders: 38% | EMEA: 33% |
| Smaller Players: 17% | Managers: 50% | Americas: 18% |
Market-Sizing & Forecasting
Sizing is built by reconstructing the demand pool from connection and traffic realities, and then translating that into service revenues by applying observed ARPU ranges and mix shifts by technology. A top-down approach is used by starting from country level fixed broadband and fixed voice subscription bases, fiber household coverage, and reported telecom service revenues, which are then filtered to fixed line only and normalized to USD using consistent exchange-rate timing.
Once the first pass is ready, we corroborate it with selective bottom-up approximations such as sampled operator revenue splits, channel checks on enterprise leased-line pricing, and sanity checks using subscriber additions times typical revenue per user. Key inputs in this market include fiber passings and take-up rates, DSL to fiber migration pace, enterprise leased line adoption, regulatory price pressure in mature markets, and bundling intensity (voice plus broadband plus TV). Forecasting uses scenario analysis supported by regression-style relationships between broadband penetration, fiber coverage growth, and ARPU movement, and then is adjusted using expert views on competitive pricing and network rollout timing. Where country disclosures are incomplete, gaps are handled through peer-market proxies, which are later rechecked using interview feedback and the latest regulator releases.
Data Validation & Update Cycle
Validation is done through multiple checks before numbers are finalized, including variance tests versus independent metrics such as broadband subscription totals, operator fixed-service revenue trends, and fiber rollout indicators. If outputs drift away from these signals, we recheck assumptions, revisit currency conversion timing, and in some cases re-contact sources to confirm what is counted under fixed line reporting.
A multi-step analyst review is followed so that definition, math, and logic are challenged internally before sign-off. Reports are refreshed annually, and interim updates are added when material events occur, such as major pricing resets, regulation changes, or step-changes in fiber build plans. Before delivery, a fresh pass is completed so clients receive the latest updated view.
Mordor Intelligence's Fixed Line Communication Market Size Compared Against Other Published Estimates
Published numbers for fixed line communication can look close at first glance, but they still spread because each publisher draws the boundary of what counts as fixed line revenue in a different way. Differences also come from how currency is converted, which year is treated as the base, and whether forecasts assume steady ARPU decline or allow for fiber-led upgrades.
Subscriber totals, operator-reported fixed service revenue splits, and fiber coverage rollouts are used to keep Mordor Intelligence tied to a repeatable demand pool that includes fixed voice, fixed broadband, and IPTV-related connectivity, rather than only one service line. When these evidence points are not used consistently, estimates can drift due to over-reliance on a single service type, static price assumptions, or slower refresh cycles after major policy or pricing changes.
Benchmark comparison
| Source | Market Size | Gaps in Research Methodology |
|---|---|---|
| Mordor Intelligence | USD 289.24 B (2025) | |
| Industry Publisher A | USD 289.56 B (2024) | Uses 2024 as the base year and frames the market through technology and service buckets that can exclude IPTV-adjacent fixed connectivity in some operator disclosures, which shifts totals even when growth rates look similar. |
| Industry Publisher B | USD 291.09 B (2024) | Applies a low-growth path that implicitly assumes limited ARPU uplift from fiber upgrades and may understate mix shift benefits from higher-speed plans, which affects how the demand pool converts into revenue. |
Overall, the spread is small in the near term, but it points to real scoping and pricing-choice differences that compound over time. By keeping the scope rules explicit and tying the model to subscriptions, revenue splits, and fiber rollout progress, our estimate stays traceable to inputs that can be rechecked and updated as new country data is released.


Key Questions Answered in the Report
What is the current value of the fixed-line communications market?
The fixed-line communications market size stands at USD 321.43 billion in 2026.
How fast is the fixed-line communications market projected to grow?
The sector is forecast to post an 11.13% CAGR, reaching USD 544.82 billion by 2031.
Which region leads the fixed-line communications market today?
Asia Pacific holds 38.45% of 2025 revenue and is also the fastest-growing major region with an 11.18% CAGR.
Why is fiber-to-the-home expanding so quickly?
FTTH growth, projected at an 18.22% CAGR, reflects rising demand for symmetric gigabit service, regulatory copper switch-off deadlines, and government broadband subsidies.
What segments are growing fastest within the market?
Access equipment revenues are increasing at a 13.45% CAGR, IPTV and value-added services at 12.05% CAGR, and data-center connectivity demand at 14.25% CAGR.
Which factors restrain market expansion?
High capex for last-mile fiber, skilled-labor shortages, and competition from 5G fixed-wireless and satellite broadband services are the chief hurdles.
Page last updated on:


