Sports Analytics Market Size and Share
Market Overview
| Study Period | 2020 - 2031 |
|---|---|
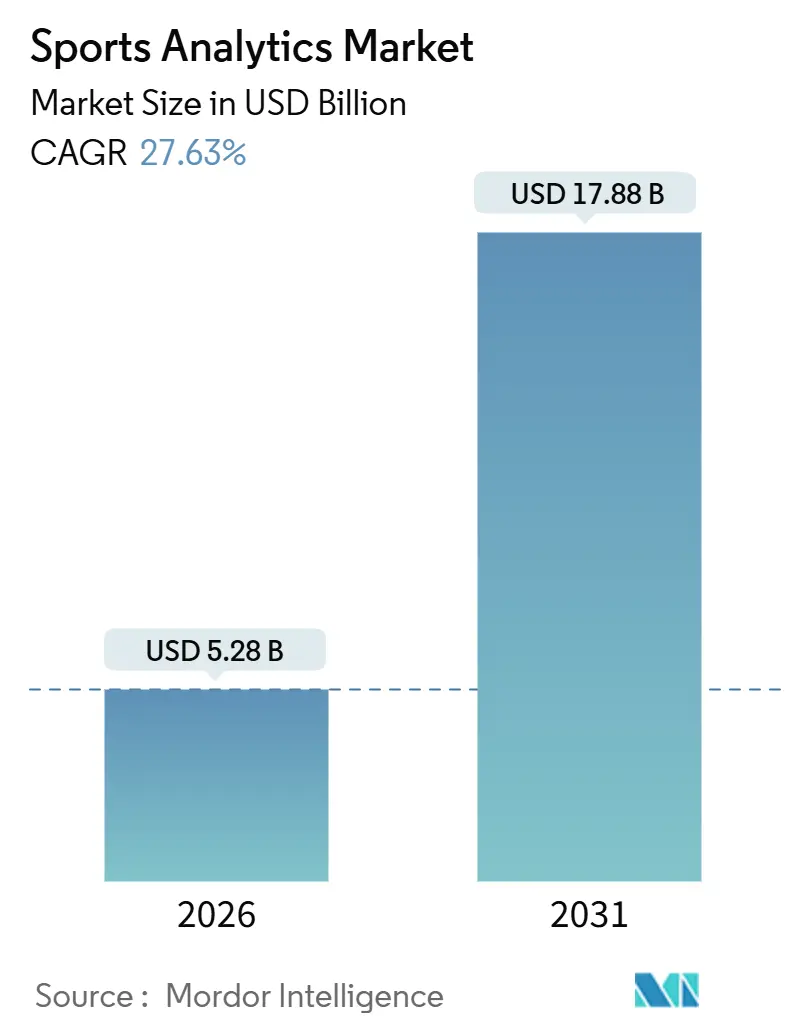
| Market Size (2026) | USD 5.28 Billion |
| Market Size (2031) | USD 17.88 Billion |
| Growth Rate (2026 - 2031) | 27.63% CAGR |
| Fastest Growing Market | Asia Pacific |
| Largest Market | North America |
| Market Concentration | Low |
Major Players *Disclaimer: Major Players sorted in no particular order Image © Mordor Intelligence. Reuse requires attribution under CC BY 4.0. | |
Sports Analytics Market Analysis by Mordor Intelligence
The sports analytics market size stood at USD 5.28 billion in 2026 and is forecast to reach USD 17.88 billion by 2031, corresponding to a 27.63% CAGR over the period. Momentum is coming from three structural shifts: leagues now treat live performance data as a monetizable media asset, betting operators pay premiums for official feeds that settle wagers in milliseconds, and cloud platforms have replaced proprietary servers for 72.33% of deployments in 2025. Services are expanding faster than software because clubs need integration, data governance, and model-tuning expertise to stitch sensor, video, and fan data into coherent pipelines. North America’s early adoption of Internet-of-Things (IoT) sensors and legalized sports wagering supplies scale, yet Asia Pacific’s cricket-led franchise model is advancing even faster. Vendor competition is intensifying as hardware firms acquire software specialists to offer end-to-end stacks, as illustrated by Sony’s 2024 acquisition of KinaTrax and 2025 acquisition of STATSports.
Key Report Takeaways
- By component, software platforms captured 64.89% revenue in 2025, while services are expanding at a 28.11% CAGR through 2031.
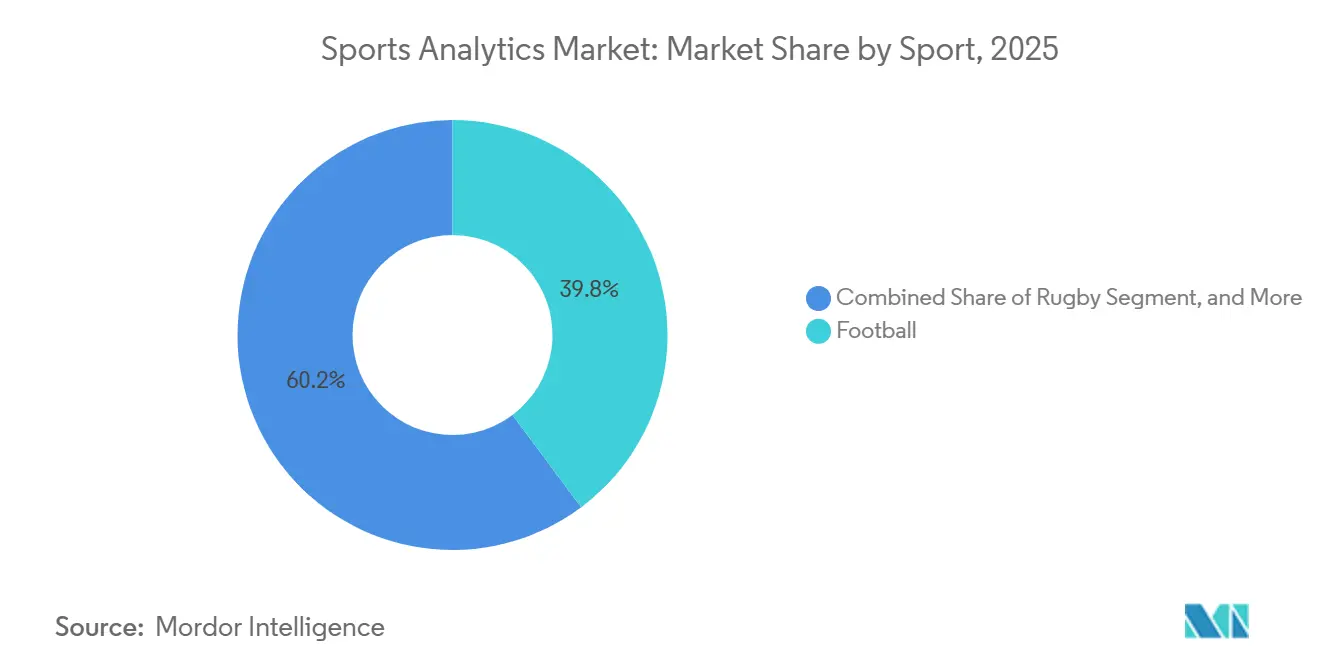
- By sport, football led with 39.78% revenue share in 2025, whereas rugby is projected to post the quickest 29.23% CAGR through 2031.
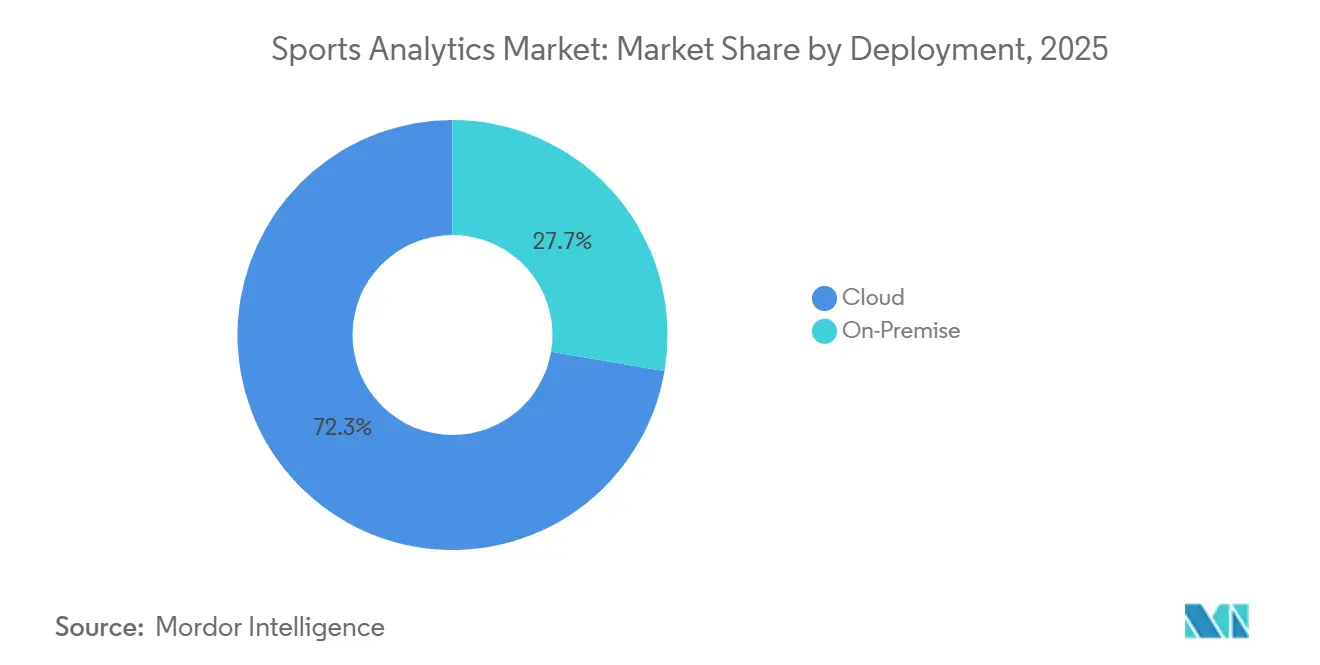
- By deployment, cloud models accounted for 72.33% of the sports analytics market share in 2025 and are increasing at a 28.06% CAGR toward 2031.
- By end user, sports teams and clubs accounted for 43.83% of revenue in 2025, while sports betting operators are expected to grow at a 28.61% CAGR between 2026 and 2031.
- By geography, North America accounted for 42.76% of the revenue share in 2025, yet Asia Pacific is anticipated to register the fastest 28.69% CAGR over the forecast period.
Note: Market size and forecast figures in this report are generated using Mordor Intelligence’s proprietary estimation framework, updated with the latest available data and insights as of January 2026.
Global Sports Analytics Market Trends and Insights
Drivers Impact Analysis*
| Driver | (~) % Impact on CAGR Forecast | Geographic Relevance | Impact Timeline |
|---|---|---|---|
| Real-time tracking enabled by IoT sensors in North American professional leagues | +5.2% | North America with spillover to Europe and Asia Pacific | Medium term (2-4 years) |
| Centralised data-warehousing mandates from European football clubs for transfer valuation | +4.8% | Europe, South America, Middle East | Long term (≥4 years) |
| Sports betting data partnerships post-legalization in the United States | +6.1% | North America, expanding to Asia Pacific and Europe | Short term (≤2 years) |
| Franchise-driven analytics adoption in Indian and Australian cricket leagues | +3.9% | Asia Pacific, Middle East and Africa | Medium term (2-4 years) |
| AI-powered injury prediction models reducing player downtime | +4.3% | Global | Medium term (2-4 years) |
| Integration of esports performance data with traditional sports analytics | +2.9% | Global, concentrated in Asia Pacific and North America | Long term (≥4 years) |
| Source: Mordor Intelligence | |||
Real-Time Tracking Enabled by IoT Sensors in North American Professional Leagues
Zebra RFID chips in NFL shoulder pads and optical cameras in NBA arenas generate millions of coordinates each game, compressing the analysis loop from hours to seconds. Microsoft’s Copilot-enabled sideline application, rolled out league-wide in August 2025, converts those streams into fourth-down probabilities and fatigue alerts that coaches can act on instantly.[1]Microsoft, “NFL expands partnership to bring AI to the sideline,” microsoft.com Edge gateways and low-latency cloud zones are therefore replacing fixed data centers because teams cannot tolerate 5-10 second round-trip delays. The model is already diffusing to the English Premier League, which signed its own five-year AI partnership with Microsoft in July 2025.
Centralised Data-Warehousing Mandates from European Football Clubs for Transfer Valuation
Premier League and continental clubs increasingly treat multi-season performance archives as capital assets that justify eight-figure transfer fees. Oracle’s Match Insights platform, first launched in 2021, collates video, positional, and biometric records so recruitment teams can benchmark prospects against historical comparables. Academy programs follow suit: Kitman Labs now underpins longitudinal tracking across every Premier League youth setup, giving sellers data-backed leverage in negotiations. As a result, buyers must counter with equally rich datasets or risk overpaying.
Sports Betting Data Partnerships Post-Legalization in the United States
Tri-exclusive NBA agreements with Sportradar and Genius Sports, MLB’s equity-linked 2032 renewal with Sportradar, and the NCAA’s January 2025 data deal formalize a closed-loop market in which leagues profit from every in-game wager.[2]Sportradar, “MLB and Sportradar extend partnership through 2032,” sportradar.com Operators receive authenticated feeds that update sub-second odds on mobile apps, while broadcasters gain predictive graphics that boost engagement. The short-term revenue jolt is U.S.-centric, but regulators in Europe and the Asia Pacific are now drafting copycat rules that prize “official” data.
Franchise-Driven Analytics Adoption in Indian and Australian Cricket Leagues
Hawk-Eye ball-tracking, Catapult GPS vests, and proprietary auction databases have turned Indian Premier League franchises into data laboratories. Player-level fatigue curves and pitch-condition models help owners maximize returns within tight roster budgets. The template is travelling: Big Bash League clubs apply the same stack, and Saudi Arabia’s Vision 2030 program is funding analytics pilots in domestic leagues. This pull from Asia Pacific explains why regional growth is set to eclipse North America by the early 2030s.
Restraints Impact Analysis*
| Restraint | (~) % Impact on CAGR Forecast | Geographic Relevance | Impact Timeline |
|---|---|---|---|
| Limited technology budgets of tier-2 clubs in South America and Africa | -3.7% | South America and Africa with pockets in Asia Pacific | Long term (≥4 years) |
| GDPR and CCPA constraints on biometric data collection | -4.2% | Europe and North America with global compliance spillover | Medium term (2-4 years) |
| Data ownership disputes between leagues and betting operators | -2.8% | North America and Europe | Short term (≤2 years) |
| Lack of standardised performance metrics across women’s sports | -1.9% | Global | Long term (≥4 years) |
| Source: Mordor Intelligence | |||
Limited Technology Budgets of Tier-2 Clubs in South America and Africa
Many second-division football organizations operate on annual budgets under USD 10 million and must choose salaries over data pipelines. Patchy fiber backhaul further hampers live uploads, forcing coaches to rely on manual tagging rather than automated sensor feeds. The gap risks locking in a two-tier global talent market where data-rich clubs monetize undervalued prospects, while cash-strapped peers fall behind.
GDPR and CCPA Constraints on Biometric Data Collection
Wearable outputs are Article 9 “special-category” data in the European Union, demanding explicit athlete consent and strict purpose limitation.[3]European Commission, “General Data Protection Regulation (GDPR) text,” europa.eu California’s CCPA offers similar opt-out rights, and recent NOYB complaints have already triggered league policy reviews. Vendors now incorporate on-device encryption and federated learning architectures so algorithms can train without exporting raw biometrics, but compliance overhead slows rollouts and inflates the cost of ownership.
*Our forecasts treat driver/restraint impacts as directional, not additive. The impact forecasts reflect baseline growth, mix effects, and variable interactions.
Segment Analysis
By Sport: Rugby’s Smart Ball Accelerates Adoption
Football generated 39.78% revenue in 2025, yet rugby is expanding fastest at a 29.23% CAGR through 2031 as Sportable’s sensor-embedded Gilbert ball delivers 20 positional updates per second for officiating and broadcast overlays. This data-rich object verifies lineouts and forward passes in real time, satisfying both referees and broadcasters. Cricket retains the second-largest slice, propelled by Hawk-Eye dominance in India and Australia, while basketball’s spatial-tracking partnerships fortify its analytics baseline.
Rugby’s momentum demonstrates that sports confronting officiating ambiguity adopt embedded sensors sooner than those with established replay systems. Successful trials at the 2023 Under-20 World Championship convinced Six Nations organizers to roll out smart balls through 2029, guaranteeing a steady uptick in hardware and software demand. The sports analytics market, therefore, benefits when technology solves officiating pain points and enriches fan storytelling.


By Component: Services Growth Outpaces Software
Software licenses still accounted for 64.89% of value in 2025, but integration, data quality, and model-training services are expanding at a 28.11% CAGR. Deloitte’s Converge for Sports bundles a fan data lake, loyalty functions, and real-time dashboards into a single managed service, underscoring why clubs prefer outcome-based contracts over toolkits. Consulting arms also mediate between proprietary wearables and public-cloud APIs, ensuring privacy controls and single-sign-on function across the stack.
The premium on services reflects rising architectural complexity. Modern deployments connect optical cameras, RFID chips, ticketing logs, and betting feeds inside a cloud warehouse. Without integration partners, clubs struggle to harmonize schemas or deploy machine-learning models safely. Vendors that pair product licenses with advisory programs have a cross-sell edge, and private equity investors reward those with steady services annuities.
By Deployment: Cloud Architecture Gains Momentum
Cloud deployments accounted for 72.33% of expenditure in 2025 and are advancing at a 28.06% CAGR, driven by compute-heavy workloads such as win-probability simulations that refresh every second. Oracle Cloud’s ability to run 100,000 match simulations per Premier League fixture validates its scale advantage over on-premises GPU clusters. Amazon Web Services provides a similar backbone for Six Nations Rugby match graphics, underscoring the broadcast dependency on elastic resources.
Pure on-premise remains viable for federations with data-sovereignty rules, but hybrid topologies now dominate new tenders. Sensitive biometrics stay behind the firewall, while aggregate metrics and fan-facing content move to the cloud. The switch is also encouraged by the rise of generative AI engines, which teams can tap on demand rather than funding their own GPU inventories.
By End User: Betting Operators Accelerate Adoption
Sports teams and clubs spent the most in 2025, yet betting operators are scaling fastest at a 28.61% CAGR as they embed scouting tools directly into league infrastructure. Sportradar’s equity-linked renewal with Major League Baseball exemplifies vertical integration: the vendor now supplies analytics to both clubs and sportsbooks, guaranteeing exclusive feed rights. Genius Sports applies the same logic to English football under its Football DataCo extension.
This shift toward multi-sided data platforms means the same telemetry underpins roster decisions, fan engagement, and micro-bets. As operators finance technology build-outs in exchange for rights exclusivity, they indirectly subsidize clubs and leagues, accelerating overall analytics penetration. Individual-athlete subscriptions, although niche, indicate a future in which players monetize their own biometrics in parallel.
Geography Analysis
North America controlled 42.76% of revenue in 2025, aided by the NFL’s league-wide IoT stack and widespread legal wagering that values sub-second data feeds. Major League Baseball’s 2032 renewal with Sportradar, including an equity component, illustrates how long-term data contracts anchor cash flows for both rights holders and vendors. Mature broadband infrastructure, large media rights, and a culture of quantitative decision-making sustain spending momentum.
Europe ranked second, propelled by unified football data strategies and Oracle-powered broadcast overlays. Growth remains healthy but sits beneath global averages because GDPR introduces consent hurdles for biometric capture. Nevertheless, the July 2025 Premier League–Microsoft pact shows clubs will invest heavily once compliance workflows are standardized. The Middle East acts as an extension market: Saudi Arabia channels Vision 2030 capital into analytics pilots across cricket and football, while the United Arab Emirates recruits startups to its free zones.
Asia Pacific is advancing fastest at a 28.69% CAGR through 2031, led by cricket’s franchise economics and a booming esports sector that shares data infrastructure. The Indian Premier League forces every club to maintain Hawk-Eye and Catapult systems, locking in recurrent software upgrades each season. China, South Korea, and Japan fuse traditional sports data with esports telemetry to build hybrid dashboards that coaches and shout-casters both rely on. By the early 2030s, cumulative spend is on track to match, then surpass, North America.
South America and Africa remain double-digit growth regions despite smaller bases. Budget limitations among tier-2 clubs slow adoption, but elite sides in São Paulo, Buenos Aires, and Johannesburg are already deploying wearables and cloud analytics on par with European counterparts. Infrastructure investments tied to 2030 World Cup bids and regional broadcasting deals are expected to gradually narrow the gap.


Regulatory Landscape
Sports analytics deployments are increasingly shaped by privacy, AI governance, and sports betting integrity rules, since the same telemetry is used for athlete evaluation and for settling in-play wagers. In the European Union, the EU AI Act (Regulation (EU) 2024/1689) introduces risk-management, technical documentation, and human-oversight obligations for certain sports-related AI use cases tied to human performance or athlete assessment, which raises expectations for model transparency and data governance alongside GDPR treatment of biometrics as special-category data.
On the wagering side, regulators are tightening technical controls around official data feeds and operator reporting. Brazil's Ministry of Finance issued Ordinance No. 722/2024 requiring betting operators to localize databases in Brazil and provide regulatory access, while the Tennessee Sports Wagering Council rules regulate sports data feeds and require integrity monitoring arrangements. In the United Kingdom, the Gambling Commission's 2025 to 2026 strategic focus explicitly highlights the use of data and analytics in oversight, supported by structured operator-data programs (including the publication of operator data through March 2026). That approach increases the need for auditable, real-time reporting pipelines across sportsbooks and their data partners.
Value Chain Analysis
The value chain begins with primary data capture and rights, as leagues, federations, teams, and event organizers generate and control access to optical tracking, wearables, and official scoring or metadata. They then license these feeds to data distributors and downstream users. Capture hardware and systems include on-body sensors (for example, GPS/RFID wearables) and in-venue camera systems, while software layers clean, label, and time-synchronize data for coaching workflows, broadcast graphics, and betting markets. Distribution and monetization are concentrated in official-data pathways for betting and media, where vendors such as Sportradar and Genius Sports package official feeds, integrity tooling, and APIs for operators, broadcasters, and digital platforms.
Activation follows through cloud infrastructure, analytics applications, and services: hyperscale or cloud data warehouses and MLOps toolchains support low-latency inference, and integrators and managed-service providers implement identity, consent, and governance controls across sensor, video, ticketing, and fan data. For advanced AI workloads, compute availability is a key upstream constraint, since 2026-era AI infrastructure bottlenecks (including long lead times for advanced semiconductor packaging capacity and other infrastructure inputs) can extend procurement cycles for teams and vendors running compute-heavy video and simulation workloads. This dynamic reinforces the move toward cloud-based capacity and vendor-managed environments.
Competitive Landscape
The sports analytics market is moderately fragmented. Enterprise software giants such as Microsoft, Oracle, and SAP sell horizontal cloud and database layers, while specialists like Stats Perform, Catapult, Sportradar, and Genius Sports provide sport-specific capture and modeling tools. Startups, including Zone7, Kitman Labs, and Orreco, address niche use cases such as injury prediction and athlete wellness, frequently partnering with cloud hyperscalers for back-end scale.
Consolidation is picking up. Sony purchased KinaTrax in October 2024 and STATSports in October 2025, marrying optical tracking with on-body sensors into a single telemetry pipeline. Hudl took a different tack, buying StatsBomb in 2024 for football event data and Balltime in 2025 for volleyball video, signaling a sport-by-sport roll-up. Teamworks’ September 2024 acquisition of Zelus Analytics integrates roster-optimization algorithms into its operations suite, underscoring cross-functional expansion.
Strategic white space lies in privacy-preserving data architectures and cross-sport standardization. Vendors that can encrypt on-device, federate learning, and still monetize aggregated insights will satisfy regulators while preserving revenue. Equally, platforms that normalise metrics across football, basketball, and rugby enable scouts to evaluate multi-sport prospects, which is an advantage as clubs diversify their talent pipelines. Competitive differentiation is therefore shifting from raw data volume to model accuracy and regulatory compliance.
Sports Analytics Industry Leaders
IBM Corporation
SAP SE
SAS Institute Inc.
Oracle Corporation
Microsoft Corporation
- *Disclaimer: Major Players sorted in no particular order

Market Opportunities and Future Outlook
Monetization is widening beyond coaching use cases into fan-facing experiences and software-defined production, creating room for platforms that unify performance, content, and commercial data under a single governance model. Large-event workflows show how this can translate into product opportunity: the 2026 FIFA World Cup used software-defined broadcast architectures (with COTS servers and private-cloud processing) and remote-production hubs to deliver multi-market feeds. That setup increases the volume of structured, time-synced live metadata that can be repackaged into interactive overlays, personalized highlights, and real-time engagement features across OTT, social, and second-screen channels.
M&A and investment activity is also pulling analytics deeper into media and consumer products, supporting opportunities for vendors that can package simulation, telemetry, and personalization as scalable services. Versant Media Group's agreement to acquire Full Swing in July 2026 highlights strategic interest in combining performance data and simulation software with sports media properties, while BGF's GBP 20 million investment into Urban Zoo (July 2026) points to continued funding for sports-technology platforms that can scale internationally. Alongside these shifts, compliance-driven opportunities are expanding for privacy-preserving analytics, including on-device encryption, federated learning, and audit-ready model documentation, as AI governance and betting-technology rules increasingly specify data controls, reporting, and integrity monitoring across jurisdictions.
Recent Industry Developments
- June 2026: The All England Lawn Tennis Club and IBM introduced new AI-powered fan experiences and modernized digital platforms for The Championships 2026 at Wimbledon. The release expanded real-time engagement features built on IBM watsonx and tournament data, reinforcing the shift from back-office analytics toward consumer-facing, personalized sports experiences at scale.
- April 2026: SAP expanded its co-innovation work with Bundesliga club TSG Hoffenheim to test AI-assisted scouting summaries and scene-finding capabilities within SAP Sports One. The collaboration strengthens SAP's positioning in workflow-integrated analytics where video, performance data, and scouting notes are converted into decision-ready outputs for clubs.
- October 2024: Sony acquired KinaTrax, adding optical tracking and biomechanics capabilities to its sports technology portfolio. The deal supported end-to-end telemetry offerings by combining capture and analysis layers, a consolidation pattern that lowers integration friction for teams and broadcasters adopting multi-source analytics stacks.


Research Methodology Framework and Report Scope
Market Definition and Coverage
For this methodology, the sports analytics market is treated as the revenue earned from analytics software and related services used to turn sports data into insights for performance, tactics, health, and fan or commercial decisions across professional and organized sports.
Scope exclusions: We do not count standalone hardware, connectivity, or ticketing tools unless an analytics layer is delivered and monetized with the solution.
Segmentation Overview
- By Sport
- Football
- Cricket
- Basketball
- Hockey
- American Football
- Baseball
- Rugby
- Other Sports
- By Component
- Software
- Services
- By Deployment
- On-Premise
- Cloud
- By End User
- Sports Teams/Clubs
- Leagues and Federations
- Individual Athletes
- Sports Betting Operators
- Other End Users
- By Geography
- North America
- United States
- Canada
- Mexico
- Europe
- Germany
- United Kingdom
- France
- Russia
- Rest of Europe
- Asia-Pacific
- China
- Japan
- India
- South Korea
- Australia
- Rest of Asia-Pacific
- Middle East and Africa
- Middle East
- Saudi Arabia
- United Arab Emirates
- Rest of Middle East
- Africa
- South Africa
- Egypt
- Rest of Africa
- Middle East
- South America
- Brazil
- Argentina
- Rest of South America
- North America
Data Sources, Market Sizing, and Validation
Desk Research
Desk research is used to set the guardrails for the model, so that the later interview inputs can be applied to a realistic demand pool. We mainly rely on public sports bodies and official statistics to understand the size of the organized sports ecosystem and the pace of digital adoption, such as federation and league publications, government sports participation and labor statistics, and education athletics updates where relevant.
We also review sources such as company annual reports, investor presentations, product documentation, reputable press coverage, and peer reviewed research on wearables, computer vision, and athlete monitoring. Patent databases are used to sanity check the direction of innovation (for example, tracking and video analytics). In a few cases, our paid subscriptions for company financials and news intelligence are used to confirm revenue disclosures and contract signals that are not fully visible in press releases. These desk sources are not exhaustive, and other public references are used for data collection, cross-checking, and clarification.
Primary Interviews and Surveys
Primary work is run to pressure-test the desk assumptions and then to pin down practical items like pricing, deployment mix, and how analytics is packaged in real buying cycles. We interview and survey a mix of solution providers, system integrators, teams and leagues, and sports-adjacent buyers such as media and betting stakeholders, with coverage spread across major regions so the global totals do not get anchored to one geography.
Interview feedback is then used to confirm the split between software and services, typical contract lengths, and what is actually counted as analytics revenue versus adjacent tools, which helps close gaps left by public reporting.
Distribution of primary research fieldwork respondents
| Company type | Respondent position | Region |
|---|---|---|
| Top tier: 34% | CXOs: 13% | APAC: 43% |
| Mid tier: 49% | Functional/Unit leaders: 34% | EMEA: 30% |
| Smaller Players: 17% | Managers: 53% | Americas: 27% |
Market-Sizing & Forecasting
Sizing starts from a top-down build where the addressable demand pool is reconstructed using organized sports activity, digitization intensity, and the measurable penetration of data-driven workflows inside teams, leagues, media, and betting ecosystems. The totals are then checked through selective bottom-up approximations, such as sampled vendor pricing ranges multiplied by adoption counts by sport and region, followed by channel checks on typical deal sizes for clubs and leagues.
Inputs that materially move the model include the installed base growth of wearable and tracking usage, the share of cloud versus on-premise deployments, the pace of video and optical tracking adoption, the ratio of services to software in early-stage deployments, and the typical annual contract value progression for renewals and expansions. When a bottom-up check has gaps, we use conservative ranges that are agreed in calls and then tighten them only after cross-verifying with more than one respondent group.
For forecasting, scenario analysis is used so that adoption curves can be adjusted based on factors like budget cycles in teams, regulatory or integrity-related changes affecting betting analytics, and the speed at which leagues standardize data collection. Scenario outputs are then aligned to interview-led expectations for pricing and usage expansion, which keeps the forecast realistic and explainable.
Data Validation & Update Cycle
Numbers are validated through several checks before they are finalized, including cross-adding by region, comparing implied revenue per buyer against interview ranges, and reviewing outliers that do not match known adoption patterns. When a variance is large, assumptions are revisited, followed by targeted re-contacts with respondents to confirm what changed, such as packaging shifts from services into subscription bundles.
Each report goes through multi-step analyst review so the logic and math are consistent across the model, narrative, and exhibits. The study is refreshed annually, and interim updates are made when material events can change growth paths. Before delivery, a final pass is done so clients receive the latest adjusted view rather than an older snapshot.
Mordor Intelligence's Sports Analytics Market Sizing Compared With Other Published Estimates
Published market numbers for sports analytics can look far apart because authors do not always count the same revenue streams, and the timing of the base year can be different. In our work, the aim is to keep the definition practical, then to explain the steps so users can see how each assumption moves the total.
Contract value signals, disclosed software and services revenue cues, and adoption markers like tracking and wearable usage are the evidence that keeps Mordor Intelligence's estimate tied to monetized analytics outputs, instead of adjacent hardware or generic sports technology spend.
Benchmark comparison
| Source | Market Size | Gaps in Research Methodology |
|---|---|---|
| Mordor Intelligence | USD 5.28 B (2026) | |
| Global Consultancy A | USD 7.03 B (2026) | This figure appears to use a broader boundary that can fold in nearby sports technology spend, and it may treat hardware-linked solutions as analytics even when software revenue is not separated clearly. |
| Regional Consultancy B | USD 5.68 B (2025) | The base year is earlier and can carry partial-year pricing and adoption assumptions, and the scope description leans toward performance and injury use cases, which can undercount off-field analytics linked to commercial and fan-side workflows. |
Across the three values, the spread is mainly explained by what gets counted as analytics revenue, the base year used, and how pricing is stepped up over time. By keeping the scope tied to monetized analytics software and related services and then checking it against observable demand and deal signals, the final number stays traceable to clear inputs that can be repeated in future updates.


Key Questions Answered in the Report
How large is the sports analytics market in 2026?
It reached USD 5.28 billion in 2026 and is projected to grow to USD 17.88 billion by 2031 at a 27.63% CAGR.
Which sport is expanding fastest in analytics adoption?
Rugby leads with a forecast 29.23% CAGR, powered by Sportable’s smart-ball technology and broadcast demand for verified officiating data.
Why are cloud deployments dominating new projects?
Real-time workloads and AI model training demand elastic GPU resources, making cloud architectures more cost-effective than on-premise clusters.
What factors are driving betting operators to invest in analytics?
Exclusive data rights, legalized wagering in 36 U.S. states, and the need for sub-second odds calculations push operators toward integrated analytics stacks.
How do privacy regulations affect biometric data collection?
GDPR and CCPA designate biometrics as sensitive data, requiring explicit athlete consent and forcing vendors to adopt encryption and federated-learning methods.
Which region is expected to overtake North America by the early 2030s?
Asia Pacific, fueled by cricket franchises and esports-analytics convergence, is on track to surpass North America’s spending early in the next decade.
Page last updated on:


