Travel And Expense Management Market Size and Share
Market Overview
| Study Period | 2020 - 2031 |
|---|---|
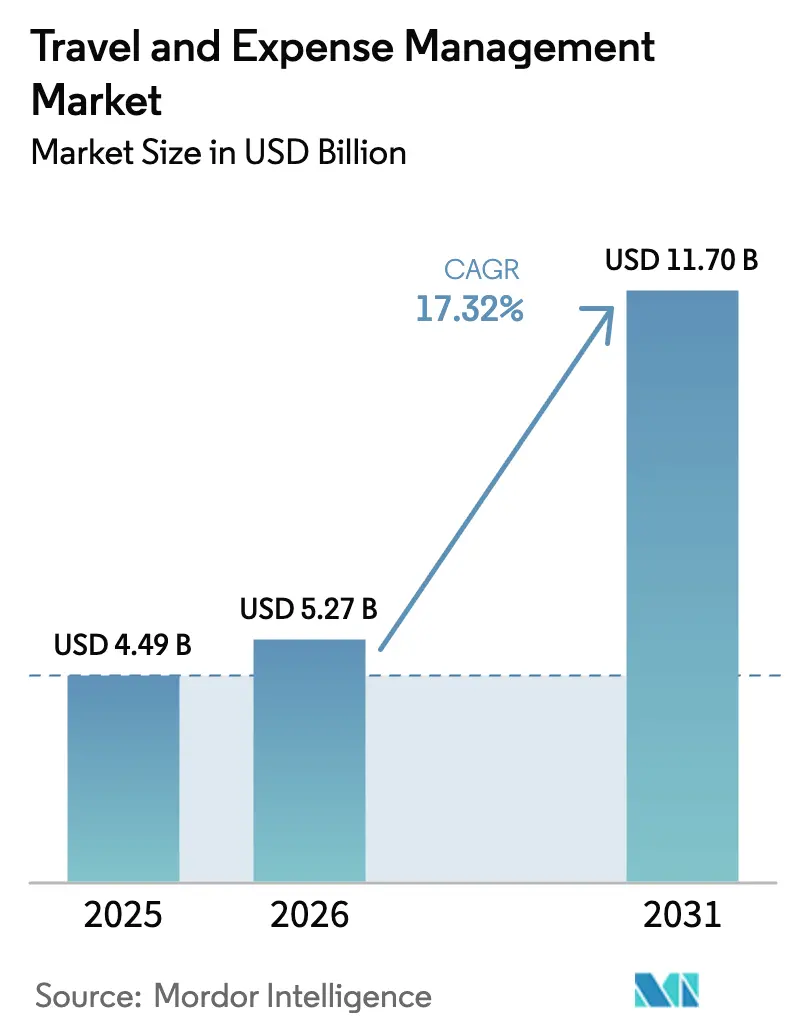
| Market Size (2026) | USD 5.27 Billion |
| Market Size (2031) | USD 11.7 Billion |
| Growth Rate (2026 - 2031) | 17.32% CAGR |
| Fastest Growing Market | Asia Pacific |
| Largest Market | North America |
| Market Concentration | Medium |
Major Players *Disclaimer: Major Players sorted in no particular order Image © Mordor Intelligence. Reuse requires attribution under CC BY 4.0. | |
Travel And Expense Management Market Analysis by Mordor Intelligence
travel and expense management market size in 2026 is estimated at USD 5.27 billion, growing from 2025 value of USD 4.49 billion with 2031 projections showing USD 11.7 billion, growing at 17.32% CAGR over 2026-2031. Adoption is accelerating as rising business-travel costs and compliance mandates push finance leaders to digitize reimbursement workflows, integrate artificial intelligence into fraud control, and link embedded finance tools with real-time corporate spend analytics. Vendor competition remains moderate, as established enterprise platforms face pressure from fintech entrants that bundle corporate cards, mobile apps, and automated expense coding into a single subscription. Cloud-first deployments already account for 73.4% of the travel and expense management market, signaling an irreversible shift away from on-premise systems. Large enterprises still generate 60.1% of revenue, yet fast-growing SMB demand is eroding that lead and signaling broader democratization of modern spend-control tools.
Key Report Takeaways
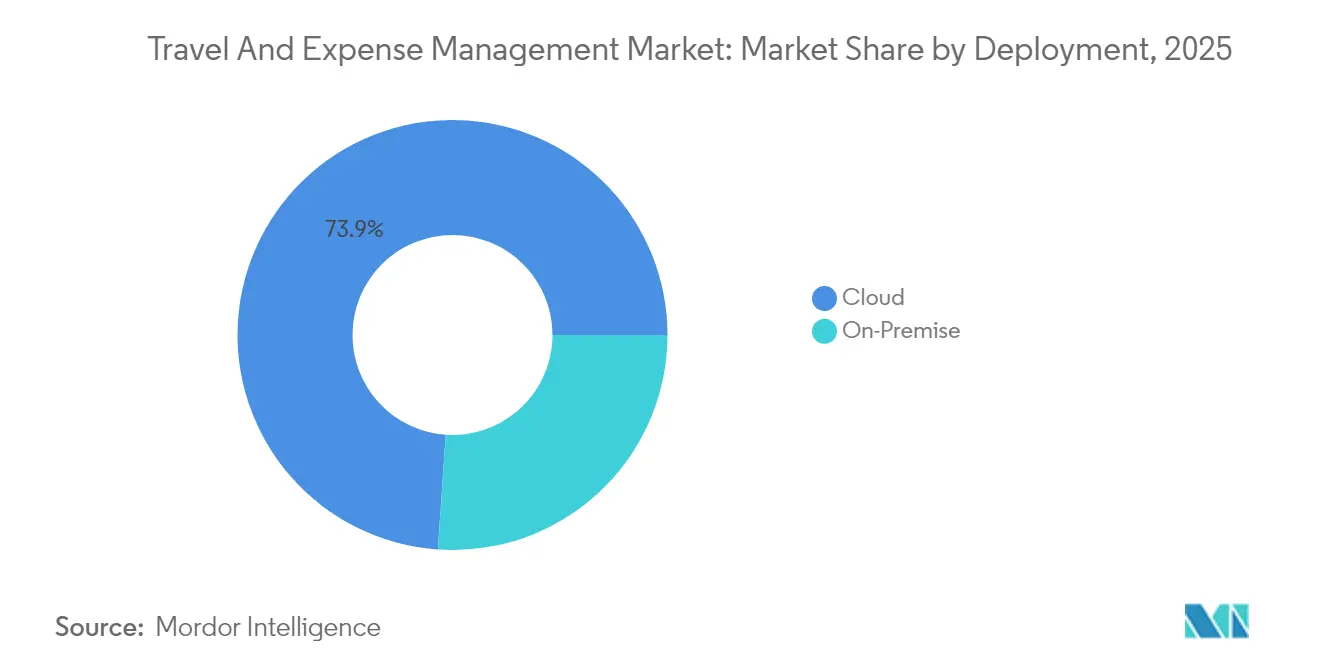
- By deployment, cloud captured 73.92% of the travel and expense management market share in 2025; on-premise is shrinking as cloud grows at a 21.02% CAGR to 2031.
- By offering, software held 65.02% of the 2025 travel and expense management market size, while services are set to expand at an 17.82% CAGR through 2031.
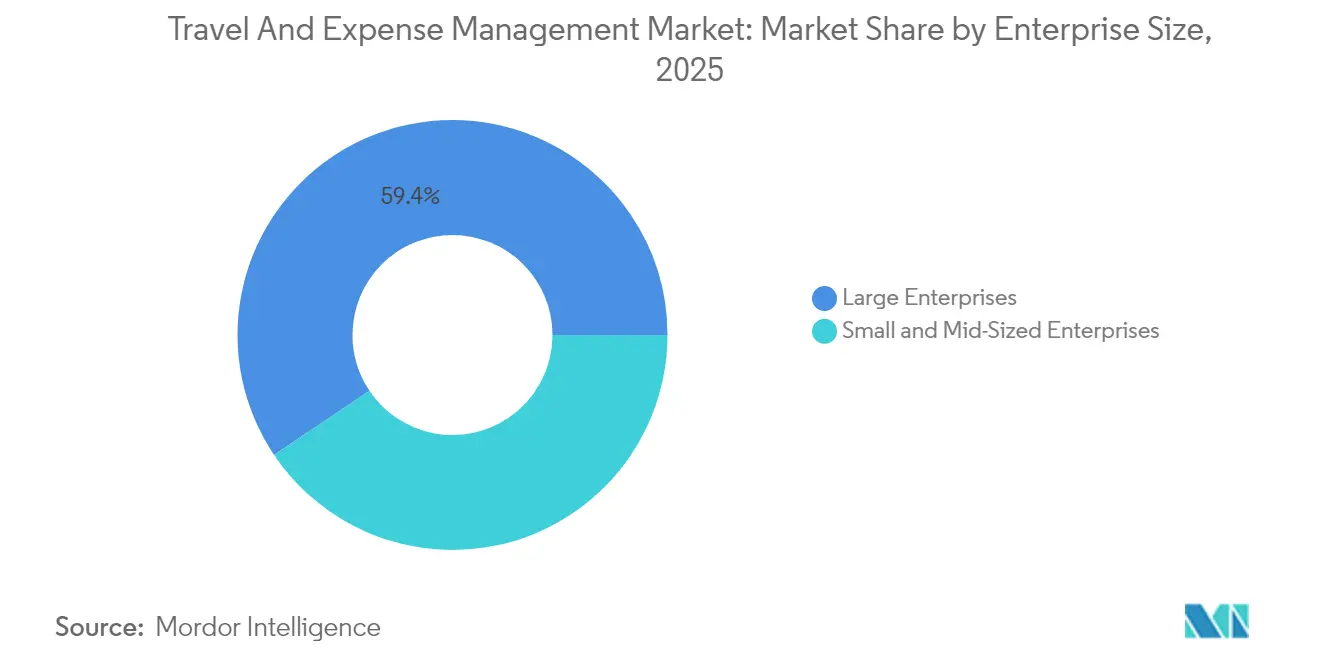
- By enterprise size, large enterprises commanded 59.42% of the travel and expense management market share in 2025, whereas the SME segment is advancing at a 23.46% CAGR.
- By end-user industry, IT and Telecom led the travel and expense management market with a 24.31% revenue share in 2025; Healthcare is the fastest riser, with a 21.98% CAGR from 2025 to 2031.
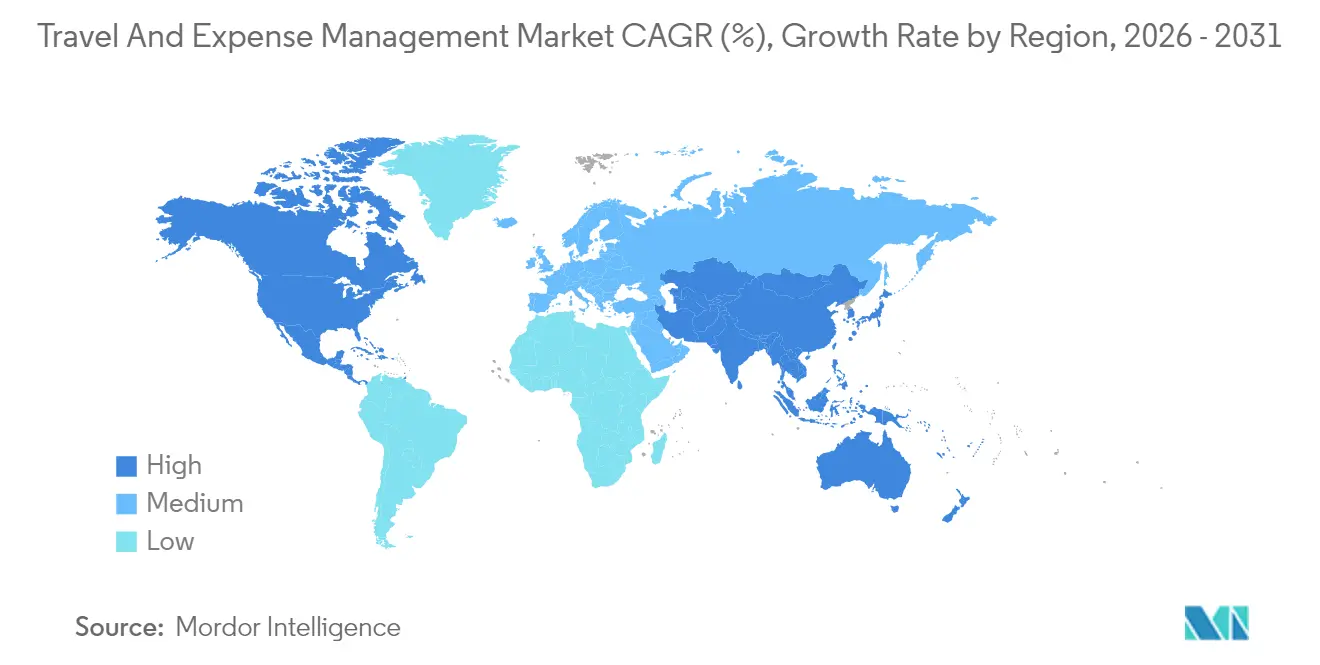
- By geography, North America dominated the travel and expense management market with a 37.12% revenue share in 2025; however, the Asia Pacific is expected to accelerate at a 19.05% CAGR through 2031.
Note: Market size and forecast figures in this report are generated using Mordor Intelligence’s proprietary estimation framework, updated with the latest available data and insights as of 2026.
Global Travel And Expense Management Market Trends and Insights
Drivers Impact Analysis*
| Driver | (~) % Impact on CAGR Forecast | Geographic Relevance | Impact Timeline |
|---|---|---|---|
| Automation and digitalization of business processes | +3.2% | Global, stronger in Asia-Pacific and Europe | Medium term (2-4 years) |
| Growing adoption of cloud-based solutions | +2.8% | North America and EU lead, Asia-Pacific catching up | Short term (≤2 years) |
| Integration of AI-driven spend analytics and fraud detection | +2.1% | Global, most visible in large enterprises | Medium term (2-4 years) |
| Embedded finance and corporate cards for real-time spend control | +1.9% | North America core, expanding to Asia-Pacific | Short term (≤2 years) |
| Expansion of travel sustainability reporting requirements | +1.4% | EU ahead, North America following | Long term (≥4 years) |
| Rise of unified travel and expense platforms in SMB segment | +2.3% | Global, strongest in developed markets | Medium term (2-4 years) |
| Source: Mordor Intelligence | |||
Automation and digitalization of business processes
Organizations are replacing manual claims with AI-enabled workflows that reduce processing time by up to 4,250 hours each year, while maintaining accuracy above 95%[1].Brex, “Brex Empower Platform,” brex.com Machine learning extracts receipt data, assigns cost codes, and flags violations in real-time, which frees finance teams to focus on advisory tasks. Predictive models now forecast cost overruns and suggest policy updates before budget issues surface. Remote work also widens the gap between paper-based systems and digital platforms, deepening demand for automated solutions across the travel and expense management market.
Growing adoption of cloud-based solutions
Cloud platforms cut IT overhead by 30–40%, synchronize travel and spend data in real time, and scale easily for seasonal peaks. SMBs gain enterprise-grade controls without dedicated infrastructure, while large multinationals use multi-tenant architectures for global consistency. Integration with SAP, Oracle, and NetSuite APIs has improved, lowering the biggest barrier that once favored on-premise deployment.
Integration of AI-driven spend analytics and fraud detection
Deep-learning engines benchmark millions of transactions to flag anomalies such as duplicate invoices or altered receipts that rule-based filters often miss. Oversight’s global risk models help finance teams detect sophisticated schemes and quantify savings, proving AI’s strategic value in the travel and expense management market.[2]Emburse, “AI for Expense Management,” emburse.com
Embedded finance and corporate cards for real-time spend control
Fintechs issue virtual cards with dynamic limits tied to project codes. Transactions flow instantly into expense reports, shrinking reimbursement cycles and feeding AI with richer data. Platforms such as Brex combine card issuance, automated categorizations, and approval workflows to give managers proactive control over every dollar spent.[3]Oversight, “Spend Audit and Fraud Prevention Overview,” oversight.com
Restraints Impact Analysis*
| Restraint | (~)% Impact on CAGR Forecast | Geographic Relevance | Impact Timeline |
|---|---|---|---|
| Complexity of integration with legacy ERP systems | -2.1% | Global, most acute in large enterprises | Medium term (2-4 years) |
| Data security and privacy concerns in multi-tenant cloud | -1.8% | EU and North America lead, Asia-Pacific following | Short term (≤2 years) |
| Rising vendor lock-in and switching costs | -1.3% | Global, concentrated in enterprise tier | Long term (≥4 years) |
| Talent shortage in finance-automation implementation | -0.9% | Developed markets | Medium term (2-4 years) |
| Source: Mordor Intelligence | |||
Complexity of integration with legacy ERP systems
Many global organizations run customized SAP or Oracle workflows that lack modern APIs, forcing middleware builds and data-mapping programs during migration. Integration missteps delay ROI and extend parallel-run phases that strain teams.
Data security and privacy concerns in multi-tenant clouds
GDPR, HIPAA, and industry regulations push European and North American firms to demand in-region data residency, granular access controls, and continuous audits. Finance leaders fear co-located data exposure and potential cross-border transfer violations, especially in healthcare and banking.
*Our forecasts treat driver/restraint impacts as directional, not additive. The impact forecasts reflect baseline growth, mix effects, and variable interactions.
Segment Analysis
By Deployment: Cloud Dominance Accelerates
The cloud slice of the travel and expense management market reached 73.92% in 2025 and is projected to grow at a 21.02% CAGR through 2031. Cloud deployment eliminates the maintenance burden, offers on-demand scalability, and enables mobile access for distributed teams. On-premise persists in defense, aerospace, and public-sector agencies that require strict data sovereignty, yet hybrid configurations are bridging those gaps. The U.S. General Services Administration’s decision to use IBM for a next-generation federal travel platform highlights that even risk-averse agencies now trust modern cloud security frameworks.
As multi-tenant architectures become more secure, vendors are positioning end-to-end API catalogs that synchronize master data with existing finance systems and travel booking engines. This momentum propels the travel and expense management market, as cloud players bundle AI, embedded payments, and sustainability dashboards into a single login for both travelers and auditors.


By Offering: Services Growth Outpaces Software
Software licenses and SaaS subscriptions accounted for 65.02% of revenue in 2025, underscoring their foundational role in the travel and expense management market. Yet, services ranging from integration to managed analytics are scaling at an 17.82% CAGR because platforms now integrate with ERP, HRIS, card networks, and tax engines. Mid-market customers lean on external consultants to avoid hiring specialized staff, while global enterprises engage system integrators for change-management programs that drive user compliance.
Consultancies bundle best-practice policy design, ROI calculators, and ongoing platform tuning. This adds a recurring revenue layer that stabilizes vendor earnings and deepens customer lock-in. Managed services also absorb repetitive tasks, such as reimbursements, freeing finance leaders to focus on cash-flow forecasting.
By Enterprise Size: SME Growth Challenges Large Enterprise Dominance
Large enterprises retained 59.42% revenue share in 2025 thanks to complex approval chains and higher travel volumes that demand sophisticated analytics. However, SMEs will post a 23.46% CAGR to 2031, trimming that gap. Cloud cost structures, plug-and-play integrations, and card-linked automation attract firms with fewer than 500 employees that once relied on spreadsheets. Fintech upstarts design mobile-first UX and automated billing cycles that minimize administrator time, giving SMEs a faster path to value.
Conversely, large multinationals will keep investing in advanced AI, multi-currency settlement, and sustainability disclosures. Vendors therefore maintain dual go-to-market playbooks: self-service freemium paths for SMBs and configurable enterprise suites for Fortune 1000 clientele.
By End-User Industry: Healthcare Leads Growth Amid IT Sector Maturity
IT and Telecom accounted for 24.31% of 2025 revenue, reflecting its early-adopter status and high travel intensity. Growth now shifts to Healthcare, which is expected to compound at 21.98% through 2031. Hospitals and care networks automate expenses to redirect staff hours to clinical tasks while ensuring auditability of grant-funded travel. Manufacturing pursues granular visibility into project-specific travel costs, whereas BFSI institutions prioritize robust audit trails and policy engines that align with regulatory frameworks.
Public-sector demand is increasing as agencies strive to meet transparency mandates. Each vertical requires configured tax logic, localized per-diem rates, and specialized compliance reporting, prompting vendors to incorporate industry templates into their core product roadmaps.
Geography Analysis
North America commanded a 37.12% market share in the travel and expense management market in 2025, reflecting decades of SaaS maturity and deep corporate card penetration. Ongoing platform upgrades and embedded-finance rollouts are expected to maintain regional growth in the mid-single-digit range as enterprises modernize their reimbursement workflows. The Asia-Pacific region is the clear growth engine: the travel and expense management market size in the region is projected to advance at a 19.05% CAGR through 2031, as China, India, and Japan invest in cloud infrastructure and digital payments. Local vendors that integrate indigenous payment rails and electronic tax receipts are gaining traction alongside established global suites. Government incentives for digital transformation further accelerate adoption among mid-market companies across major Asian economies.
Europe maintains steady demand, driven by GDPR-aligned data-residency requirements that reward providers offering in-region data centers and granular privacy controls. Enterprises across Germany, France, and the Nordics prioritize solutions with automated VAT reclamation, fueling incremental platform spending. Japanese corporations are increasingly rolling out AI-enabled expensing tools that synchronize with national railway e-ticket systems, streamlining high-frequency domestic trips. In India, fintech-backed platforms bundle virtual cards with automated policy checks, appealing to fast-scaling technology and services firms that need real-time cost visibility.
South America, the Middle East, and Africa currently contribute smaller revenue pools but present rising opportunities as multinational companies expand their footprints and seek unified global spend controls. Brazilian firms favor solutions that automate local tax compliance and integrate with domestic boleto-based payment methods, which vendors now incorporate through open-API catalogs. Gulf Cooperation Council states are embedding travel sustainability tracking into procurement mandates, prompting public-sector pilots of cloud-native expense management suites. Across these emerging regions, mobile-first deployments and subscription pricing lower entry barriers for small businesses, thereby widening the overall addressable base of the travel and expense management market.

Competitive Landscape
The travel and expense management market remains moderately concentrated, with SAP Concur, Oracle, and Emburse securing large-enterprise accounts, while fintech challengers such as Brex, Ramp, and TravelPerk offer aggressive card-centric bundles. Price competition is limited; instead, vendors differentiate themselves through the breadth of their ecosystems, which unify booking, payments, and analytics within a single login. API openness has become a critical selling point, because buyers insist that spend data flow seamlessly into ERP, HRIS, and tax-compliance engines. Growing SME adoption is widening the addressable base, allowing smaller regional specialists, particularly in the Asia-Pacific, to secure a share without directly confronting global leaders. These dynamics produce a stable core, surrounded by fast-moving edge players that innovate through niche industry templates and regional payment integrations.
Strategic moves exemplify this shift toward ecosystem-scale upstarts. American Express acquired Center in February 2025 to blend real-time expense controls with its global corporate-card rails. TravelPerk followed in March 2025 by purchasing Yokoy and closing a USD 200 million Series E round to accelerate AI road-mapping and cross-sell travel booking with automated expensing. SAP Concur embedded the Joule generative-AI copilot the same month, signaling incumbents’ intent to match fintech-style usability while defending enterprise depth. Regional leaders in Japan, India, and Brazil are also partnering with local payment networks to secure compliance with country-specific e-invoice mandates and domestic card schemes.
Technology differentiation now centers on embedded finance, predictive AI, and zero-touch reconciliation. Platforms automatically issue virtual cards with dynamic spend ceilings, stream expense data into machine-learning risk engines, and post approved entries back to general ledgers without manual intervention. Sustainability add-ons that calculate trip-level carbon footprints and feed ESG dashboards are emerging as a tie-breaker in European public-sector bids. Vendors that can offer full-stack journeys from pre-trip approval to final tax reclaim are advantaged over point solutions, especially when global customers want one contract, one SLA, and consolidated analytics. As a result, partnerships with travel-management companies, payroll processors, and banking networks are expected to intensify over the next three years.
Travel And Expense Management Industry Leaders
SAP SE
Coupa Software Inc.
Oracle Corporation
Emburse
Navan
- *Disclaimer: Major Players sorted in no particular order

Recent Industry Developments
- March 2025: SAP Concur added generative-AI copilot Joule for conversational expense capture.
- March 2025: TravelPerk acquired Yokoy after securing USD 200 million Series E funding.
- February 2025: American Express acquired Center to embed expense automation within its corporate-card stack.
- December 2024: Rakus outlined an AI roadmap for its Rakuraku Seisan platform, including automated receipt OCR.


Research Methodology Framework and Report Scope
Market Definitions and Key Coverage
Our study defines the travel and expense (T&E) management market as all cloud-hosted or on-premise software and associated services that help organizations plan, capture, control, and reimburse employee business-trip costs, together with the subscription and implementation fees paid for such platforms. Revenue from adjacent spend-management suites is counted only when those modules are marketed primarily for T&E oversight.
Scope exclusion: stand-alone corporate card interchange, general ledger systems, and outsourced travel-agency commissions are left outside the boundary.
Segmentation Overview
- By Deployment
- Hosted / Cloud
- On-Premise
- By Offering
- Software
- Services
- By Enterprise Size
- Small and Mid-Sized Enterprises
- Large Enterprises
- By End-User Industry
- IT and Telecom
- BFSI
- Manufacturing
- Public Sector
- Healthcare
- Others
- By Geography
- North America
- United States
- Canada
- Mexico
- South America
- Brazil
- Argentina
- Rest of South America
- Europe
- United Kingdom
- Germany
- France
- Italy
- Spain
- Nordics
- Rest of Europe
- Middle East and Africa
- GCC
- Israel
- South Africa
- Rest of Middle East and Africa
- Asia-Pacific
- China
- India
- Japan
- South Korea
- Australia
- New Zealand
- Rest of Asia-Pacific
- North America
Detailed Research Methodology and Data Validation
Primary Research
Mordor analysts complemented desk findings with interviews and structured surveys of finance leaders, travel-program managers, software integrators, and regional resellers across North America, Europe, Asia-Pacific, and the Middle East and Africa. These conversations tested adoption triggers, price dispersion, and upcoming regulatory shifts, enabling us to cross-check model assumptions and close data gaps.
Desk Research
We began by collating public data from recognized bodies such as the U.S. Bureau of Transportation Statistics, Eurostat air-passenger files, and the UNWTO's business-travel indicators, which outline the potential transaction pool. Industry associations, including GBTA and ACTE, provided policy and reimbursement benchmarks that shape software demand. Company 10-Ks, investor decks, and reputable press coverage offered adoption rates, average contract values, and merger updates. Paid databases that Mordor Intelligence licenses, D&B Hoovers for vendor financials and Dow Jones Factiva for deal flow, helped fill revenue splits across regions. The sources listed illustrate, not exhaust, the literature screened during secondary research.
Market-Sizing and Forecasting
A hybrid top-down build, starting with 2024 corporate travel spending, trip frequency, and automated-expense penetration by region, is balanced with selective bottom-up checks such as supplier roll-ups and sampled average selling price times active seats. Key variables inside the model include (i) annual business air-trip volume, (ii) cloud-SaaS adoption ratio within finance software, (iii) mobile workforce growth, (iv) corporate card penetration, and (v) inflation-adjusted per-trip booking cost. Multivariate regression then projects each driver through 2030, guided by consensus expectations gathered during primary research. Where supplier-level estimates are incomplete in emerging markets, interpolation from comparable economies is applied before final triangulation.
Data Validation and Update Cycle
Outputs pass a multi-step review: analysts run variance checks against outlier deal values, managers re-test assumptions, and models are reopened whenever currency swings or material M&A events move the baseline. Reports refresh annually, and a final quick scan occurs just before publication so clients receive our latest view.
Why Our Travel and Expense Management Baseline Commands Reliability
Published market values often differ because firms take varied views on what revenues belong, how fast post-pandemic travel rebounds, and which price curves to assume for cloud subscriptions.
Key gap drivers include narrower software-only scopes, constant 2023 ASPs, or slower recovery scenarios adopted by other publishers, whereas Mordor applies a wider yet clearly documented scope, price skating linked to inflation and seat expansion, and a shorter eighteen-month refresh cadence that captures rapid fintech entry.
Benchmark comparison
| Market Size | Anonymized source | Primary gap driver |
|---|---|---|
| USD 4.49 billion (2025) | Mordor Intelligence | - |
| USD 4.20 billion (2024) | Global Consultancy A | Omits managed-service revenue; freezes 2023 ASP for forecast years |
| USD 3.60 billion (2024) | Trade Journal B | Counts software only; models conservative travel-recovery curve |
These contrasts show that, by aligning scope, dynamic pricing, and current recovery data, Mordor delivers a dependable, transparent baseline that decision-makers can replicate and stress-test with limited effort.


Key Questions Answered in the Report
How big is the travel and expense management software market in 2026?
The travel and expense management software market size stands at USD 5.27 billion in 2026 and is projected to grow to USD 11.7 billion by 2031.
Which deployment model leads the market?
Cloud deployment dominates with a 73.92% share in 2025 and is forecast to rise further as enterprises replace on-premise systems with scalable SaaS platforms.
Which region is expanding the fastest?
Asia-Pacific shows the highest growth, with a 19.05% CAGR through 2031, driven by digital transformation initiatives in China, India, and Japan.
What segment is growing quickest by industry?
Healthcare is the fastest-growing vertical, expected to register a 21.98% CAGR as hospitals automate reimbursements to control inflationary operating costs.
What technology trends are reshaping vendor strategies?
Embedded finance with virtual corporate cards, AI-driven fraud analytics, and cloud-native APIs that simplify ERP integration are central to competitive positioning.
Are data-privacy rules slowing cloud adoption?
Yes, especially in Europe and North America where GDPR and industry regulations require in-region data residency and rigorous security certifications, slightly tempering adoption rates among highly regulated enterprises.
Page last updated on:


