Freight Transport Management Market Size and Share
Market Overview
| Study Period | 2020 - 2031 |
|---|---|
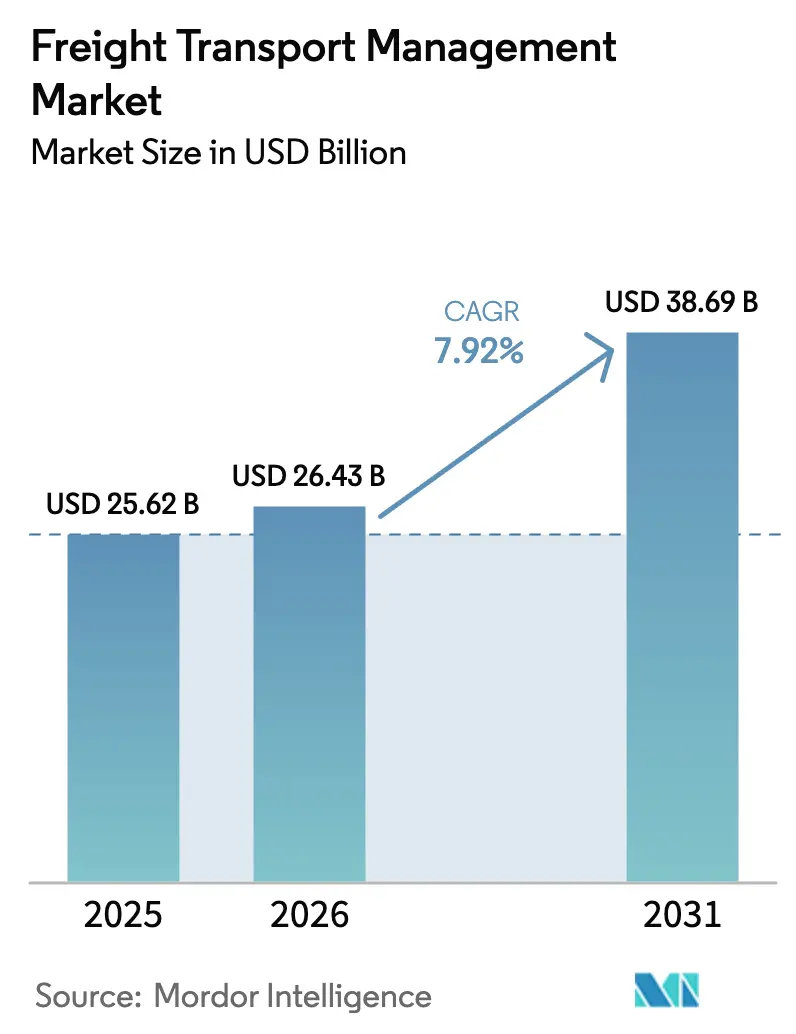
| Market Size (2026) | USD 26.43 Billion |
| Market Size (2031) | USD 38.69 Billion |
| Growth Rate (2026 - 2031) | 7.92% CAGR |
| Fastest Growing Market | Asia Pacific |
| Largest Market | North America |
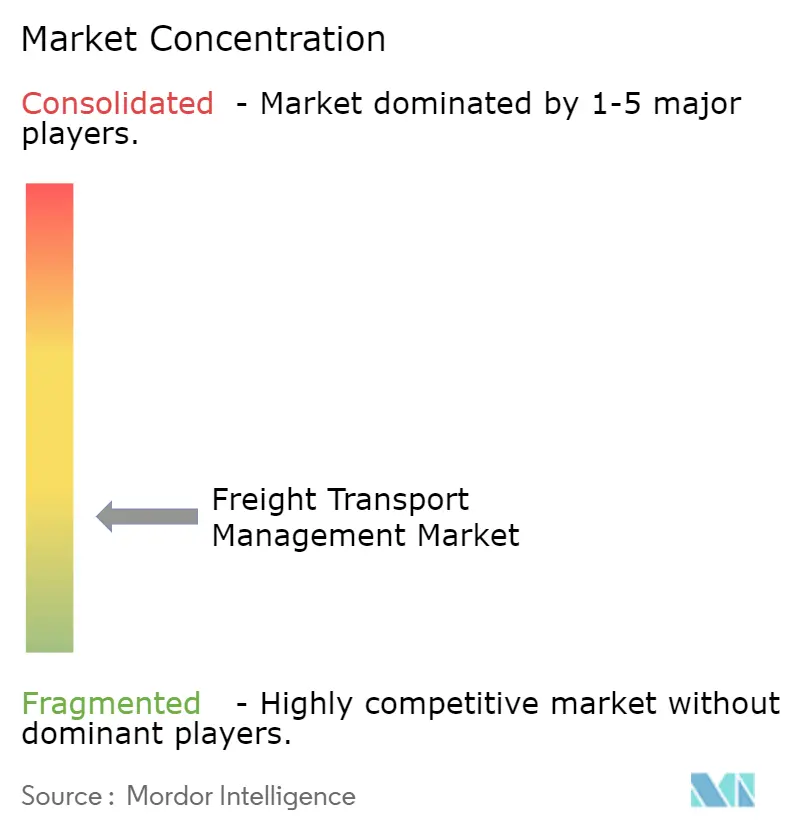
| Market Concentration | Low |
Major Players *Disclaimer: Major Players sorted in no particular order Image © Mordor Intelligence. Reuse requires attribution under CC BY 4.0. | |
Freight Transport Management Market Analysis by Mordor Intelligence
The Freight Transport Management Market size is expeceted to grow from USD 25.62 billion in 2025 to USD 26.43 billion in 2026 and is projected to expand to USD 38.69 billion by 2031 at 7.92% CAGR over 2026-2031. This acceleration mirrors a decisive shift away from stand-alone execution tools toward integrated, cloud-native platforms that orchestrate multi-modal loads in near real time. Rising cross-border e-commerce volumes, government-backed green-corridor funding, and maritime capacity expansion under the Belt and Road Initiative are altering routing decisions, cost structures, and competitive positioning. At the same time, wide-scale 5G and IoT rollouts are democratizing shipment visibility for mid-size shippers, while AI-powered dynamic routing engines drive down empty-mile ratios and fuel spend. Vendors are racing to hard-wire cybersecurity safeguards into their offerings as data-breach costs in transportation exceeded USD 5.13 million per event in 2025.
Key Report Takeaways
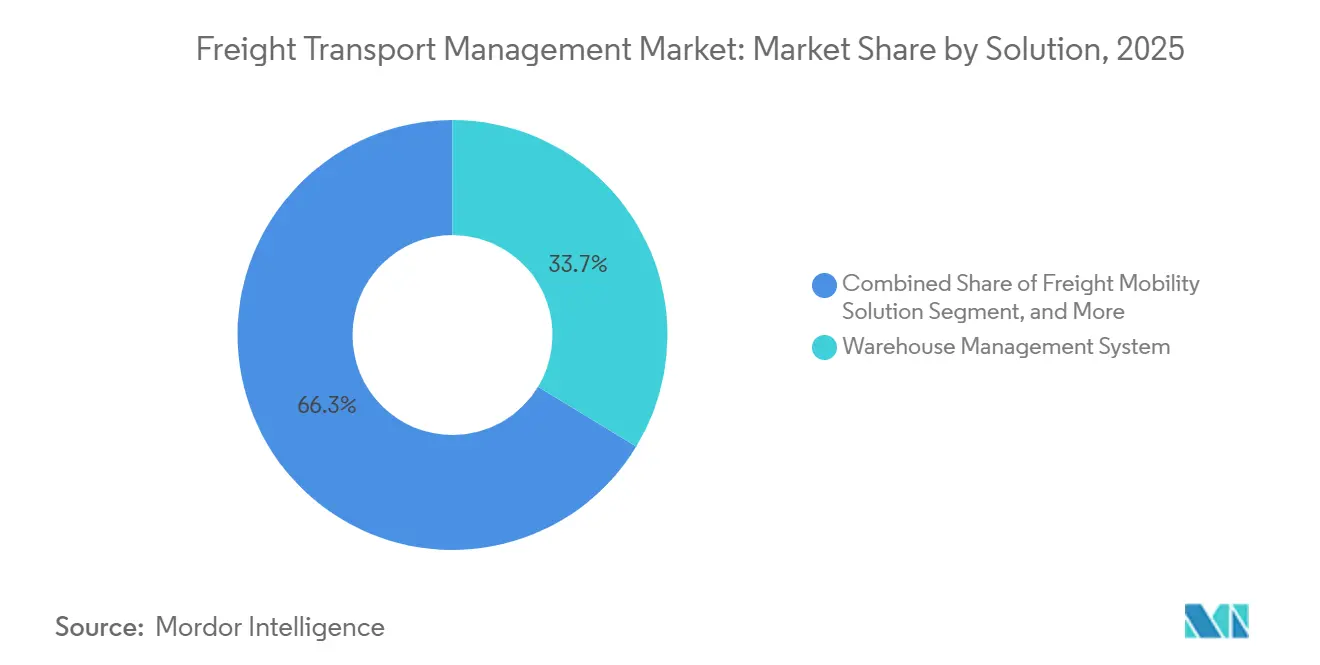
- By solution, warehouse management systems led with 33.68% of the Freight Transport Management market share in 2025, while freight mobility solutions are projected to record the fastest 8.22% CAGR through 2031.
- By deployment, cloud delivery held a 58.25% share of the Freight Transport Management market in 2025 and is set to expand at a 9.62% CAGR through 2031.
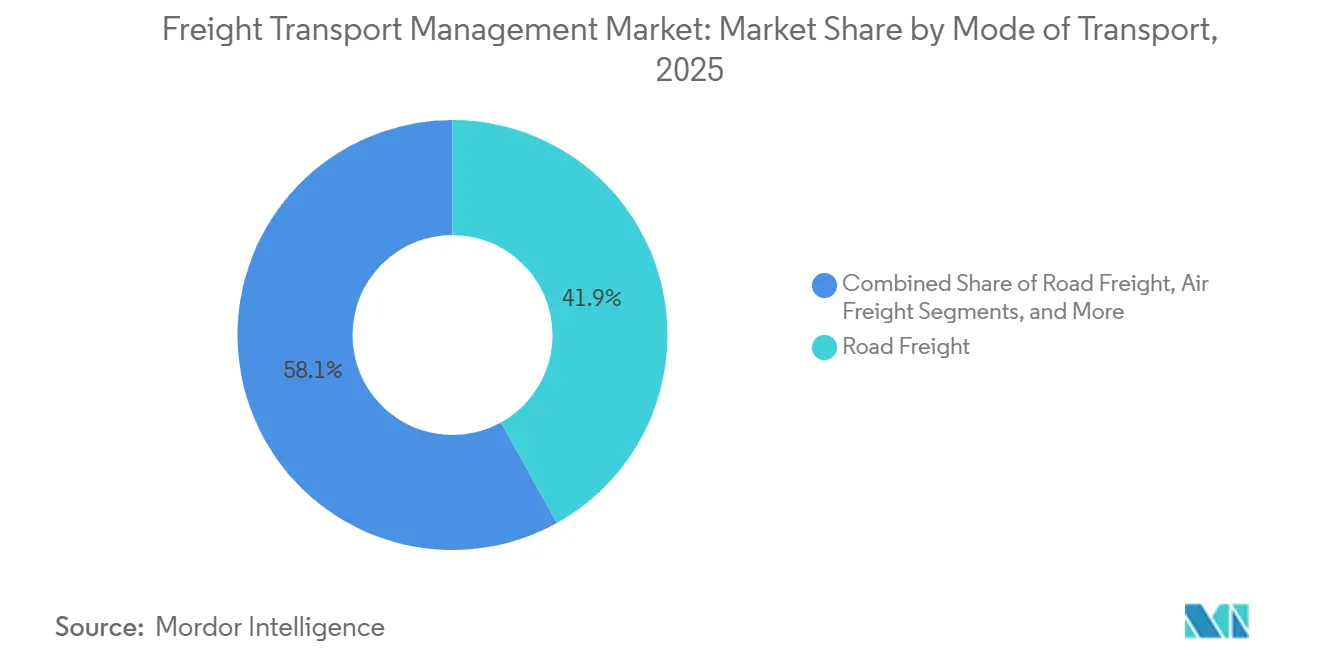
- By mode, road freight commanded 41.92% share in 2025, yet air freight is advancing at an 8.07% CAGR on the back of express e-commerce lanes.
- By end-user, consumer and retail accounted for 25.18% of demand in 2025; the segment is forecast to see a 9.11% CAGR through 2031.
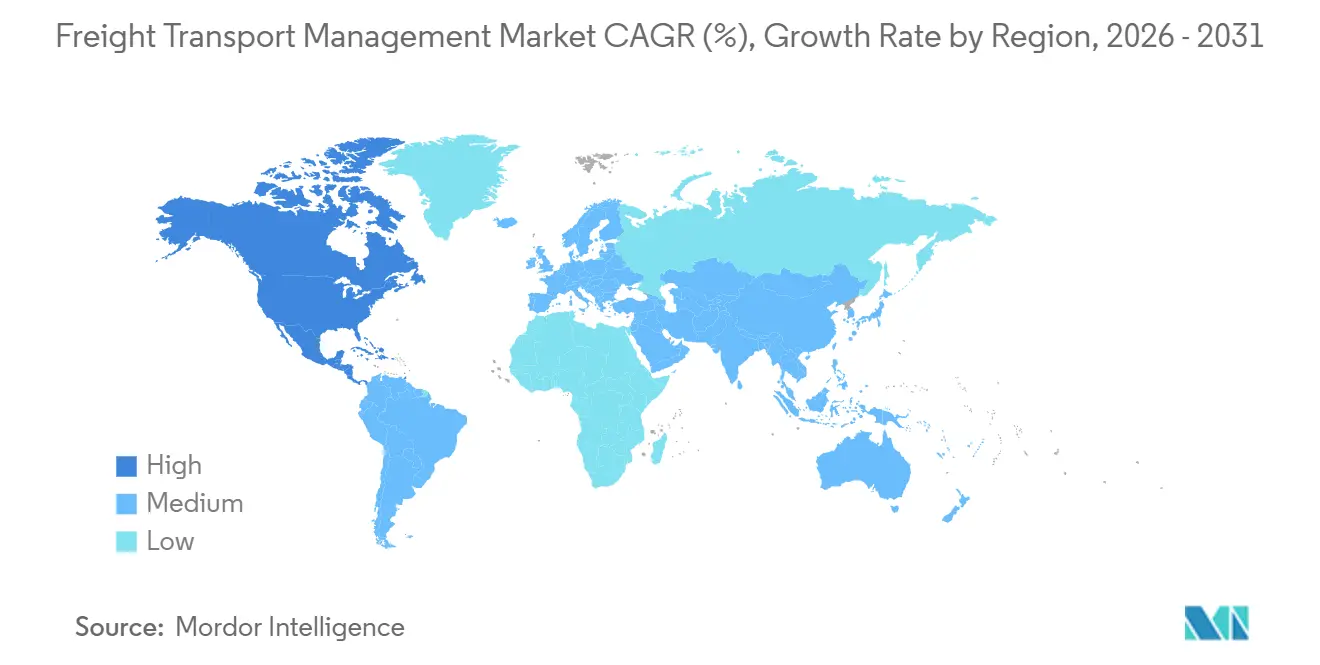
- By geography, North America dominated with 38.11% revenue share in 2025, while Asia Pacific represents the fastest-growing region at a 10.09% CAGR to 2031.
Note: Market size and forecast figures in this report are generated using Mordor Intelligence’s proprietary estimation framework, updated with the latest available data and insights as of January 2026.
Market Trends and Insights
Drivers Impact Analysis of Freight Transport Management Market*
| Driver | (~)% Impact on CAGR Forecast | Geographic Relevance | Impact Timeline |
|---|---|---|---|
| Surge in Cross-border E-commerce Parcels | +1.8% | Global, with concentration in North America, Europe, and Asia Pacific | Medium term (2-4 years) |
| Integration of AI-driven Dynamic Routing Engines | +1.5% | North America and Europe, expanding to Asia Pacific | Short term (≤ 2 years) |
| Accelerated Rollout of 5G-enabled IoT Tracking | +1.3% | Asia Pacific core, spillover to North America and Middle East | Medium term (2-4 years) |
| Maritime Capacity Expansion Under Belt-and-Road Parts | +1.0% | Asia Pacific, Middle East, and Africa trade corridors | Long term (≥ 4 years) |
| Government Incentives for Green Freight Corridors | +0.9% | Europe and North America, emerging in China and India | Long term (≥ 4 years) |
| Rising Freight Volumes from Near-shoring in North America | +0.7% | North America, particularly U.S.-Mexico-Canada corridor | Medium term (2-4 years) |
| Source: Mordor Intelligence | |||
Surge in Cross-border E-commerce Parcels
Cross-border parcel shipments surpassed 9.3 billion units in 2025, forcing carriers and shippers alike to embrace predictive capacity-planning algorithms that reserve container and aircraft space weeks ahead of peak shopping events. Same-day fulfillment footprints expanded sharply; for instance, one U.S. online retailer extended same-day service to 90 metropolitan areas in 2025, setting a performance bar that regional players must meet to retain market share. As global merchandise trade intensity rose to 52.3% of GDP in 2025, real-time freight orchestration has become a core competency rather than a back-office task.[1]DHL, “Global Connectedness Tracker 2025,” dhl.com
Integration of AI-driven Dynamic Routing Engines
AI platforms processed more than a billion shipment data points in 2025 to resequence stops on the fly as traffic, weather, or dock-door availability changed. A leading 3PL automated rate negotiations for 15% of its North American truckload volume, trimming procurement cycle time by 40% and freeing brokers to handle exceptions. A global parcel carrier reported that its route-optimization engine saved 100 million road miles annually, translating into 10 million gallons of fuel and USD 400 million in direct cost avoidance.[2]United Parcel Service, “ORION Route Optimization Savings,” ups.com
Accelerated Rollout of 5G-enabled IoT Tracking
More than 2.5 million commercial vehicles featured 5G-IoT sensors in 2025, delivering sub-second positional updates and cargo-condition alerts. A major ocean carrier outfitted 350,000 refrigerated containers with IoT modules, enabling pharmaceutical shippers to receive alerts when temperatures drift beyond two degrees Celsius for more than 10 minutes. In retail, battery-free Bluetooth tags transmitted ambient-grocery data without the expense of cellular plans, lowering ownership costs by 60% and widening the technology’s addressable market.
Government Incentives for Green Freight Corridors
The European Union earmarked EUR 1 trillion (USD 1.13 trillion) to decarbonize transport infrastructure under the Green Deal, while the United States Inflation Reduction Act set aside USD 369 billion for clean-energy projects, including credits of up to USD 40,000 per battery-electric Class 8 truck. China extended new-energy vehicle subsidies to 2027 with a 50% urban-fleet penetration target by 2030. Freight management platforms capable of calculating shipment-level carbon intensity are now essential to bid compliance as more shippers request granular emissions data.
Restraints Impact Analysis of Freight Transport Management Market*
| Restraint | (~)% Impact on CAGR Forecast | Geographic Relevance | Impact Timeline |
|---|---|---|---|
| Cyber-security Vulnerabilities in TMS Platforms | -0.8% | Global, with heightened risk in North America and Europe | Short term (≤ 2 years) |
| High Capex for End-to-end Visibility Digitization | -0.6% | Emerging markets in Asia Pacific, Africa, and South America | Medium term (2-4 years) |
| Congestion and Labour Shortages at Major Trans-shipment Hubs | -0.5% | North America West Coast, European gateway ports, Asia Pacific | Short term (≤ 2 years) |
| Volatility of Bunker Fuel and Aviation Turbine Fuel Prices | -0.4% | Global, with acute impact on air and ocean freight | Short term (≤ 2 years) |
| Source: Mordor Intelligence | |||
Cyber-security Vulnerabilities in TMS Platforms
Average breach costs in transportation climbed to USD 5.13 million in 2025, outpacing the multi-sector mean and reflecting the strategic value of shipment data. A 72-hour outage at a European logistics software provider disrupted 120,000 container moves, prompting shippers to demand ISO 27001 attestations and cyber-insurance coverage before integrating enterprise systems with external TMS platforms. The strategic risk extends beyond immediate recovery costs, shippers are increasingly requiring third-party security audits and cyber-insurance attestations before integrating their enterprise resource planning systems with external transportation management platforms, lengthening sales cycles and raising customer-acquisition costs for software vendors that lack ISO 27001 certification or SOC 2 Type II compliance.
High Capex for End-to-end Visibility Digitization
Comprehensive multi-modal visibility programs require USD 2 million-15 million in upfront spending, covering sensors, cloud infrastructure, and change-management services, putting the model out of reach for many SMEs. A regional survey in 2025 found that 62% of Southeast Asian logistics SMEs cited capital constraints as the primary digitization barrier, despite evidence that real-time tracking can improve asset utilization by up to 20%.
*Our forecasts treat driver/restraint impacts as directional, not additive. The impact forecasts reflect baseline growth, mix effects, and variable interactions.
Freight Transport Management Market Segment Analysis
By Solution:
Warehouse Systems Anchor Revenue, Mobility Platforms AccelerateWarehouse management systems captured 33.68% of 2025 revenue as shippers synchronized inbound freight arrivals with order-picking workflows. A leading vendor noted 28% annual growth in cloud WMS deployments, reflecting the need to eliminate 48-hour data latency inherent in legacy batch updates. Freight mobility solutions are advancing at an 8.22% CAGR through 2031 on the strength of analytics modules that forecast port congestion seven days ahead, allowing shippers to divert containers and avoid dwell fees. Freight audit tools, meanwhile, benefit from dynamic fuel surcharges that demand automated invoice verification. Freight security and monitoring is gaining ground along high-theft corridors where insurers now require GPS-enabled immobilizers. Investment in 3PL control-tower platforms continues as venture-backed entrants consolidate marketplace liquidity and visibility under single dashboards.
The Freight Transport Management market size for warehouse-focused suites remains the largest, yet mobile-first platforms are expanding fastest by layering predictive analytics on top of real-time location data. This shift underscores a broader pivot from reactive to anticipatory freight orchestration. With incumbents integrating AI co-pilots into existing products, mid-tier vendors target the white space between high-end enterprise suites and basic load-board apps, offering modular visibility at subscription price points.


By Deployment:
Cloud Dominates as SaaS Economics Reshape ProcurementCloud models held 58.25% of Freight Transport Management market share in 2025, supported by a 9.62% CAGR outlook. Subscription pricing converts capex to opex and delivers elastic compute for shippers with seasonal peaks. One major ERP provider achieved 99.95% uptime across 18 data centers in 2025, a reliability benchmark difficult to match on-premise without parallel hardware. The Freight Transport Management market size for cloud platforms is also widening as public-sector agencies adopt FedRAMP-certified services, softening earlier data-sovereignty objections.
On-premise installations retained 41.75% share in regulated verticals that mandate air-gapped operations, but hybrid designs are emerging. A telematics supplier introduced a “cloud-adjacent” option in 2025 that processes sensitive data behind the firewall while pushing anonymized performance metrics to the cloud for benchmarking. This architecture points to a gradual migration path as regulatory clarity improves.
By Mode of Transport:
Road Leads, Air Surges on E-commerce ExpressRoad freight represented 41.92% of 2025 modal revenue, supported by ubiquitous last-mile coverage and new compliance requirements such as the U.S. electronic logging device mandate, which achieved 98% adherence in 2025. The mandate accelerated telematics adoption within transportation management suites, ensuring that routes comply with driver-hour limits. Air freight is projected to post an 8.07% CAGR through 2031 as express networks accommodate sub-24-hour delivery promises; one integrator added 12 wide-body freighters in 2025 to serve trans-Pacific lanes.[3]FedEx Corporation, “Annual Report 2025,” investors.fedex.com
Waterborne freight, with a mid-20s share, benefits from blockchain documentation pilots that cut paperwork from 36 forms to digital tokens, trimming clearance times from days to hours. Rail freight gains from intermodal programs linked to near-shoring into Mexico, with intermodal carloads rising 4.2% in 2025. The Freight Transport Management market size across modes remains fluid as carbon-pricing schemes alter relative economics, intensifying the need for software that calculates landed cost inclusive of emissions fees.
By End-User:
Consumer Retail Dominates, Quick Commerce Reshapes DeliveryConsumer and retail held 25.18% of demand in 2025 and are advancing at a 9.11% CAGR. Same-day grocery and fashion fulfillment obliges retailers to adopt AI-powered route engines capable of iterating thousands of delivery permutations within seconds. Automotive shippers maintain a mid-teens share, driven by just-in-time assembly lines that require steady inbound flows of semiconductors and battery packs. The Freight Transport Management market, linked to aerospace, oil and gas, and utilities, accounted for approximately 30% in 2025, leveraging blockchain-based part provenance and hazardous-material compliance features.
Across smaller verticals- pharmaceuticals, chemicals, industrial machinery, demand clusters around temperature-controlled visibility and driver-safety compliance. Quick-commerce models promising 10-minute delivery in dense urban areas are creating entirely new load profiles characterized by high volume, low weight, and hyper-compressed delivery windows, reshaping routing logic and capacity planning.
Geography Analysis
North America Freight Transport Management Market
North America retained 38.11% of 2025 revenue as widespread SaaS adoption and advanced e-commerce fulfillment networks set a high digital baseline. U.S.-Mexico truck crossings increased 23% from 2020 to 2025 under the USMCA framework, boosting demand for TMS modules that manage bilingual customs-clearance workflows.[4]U.S. Department of Transportation, “USMCA Cross-Border Freight Statistics 2025,” transportation.gov Canada’s National Trade Corridors Fund, worth CAD 4.2 billion (USD 3.1 billion), is upgrading port and rail links and spurring shippers to implement intermodal optimization features.
APAC Freight Transport Management Market
Asia Pacific registers the highest CAGR of 10.09%. India’s logistics sector is on course to double from USD 215 billion in 2024 to USD 435 billion by 2027, catalyzing cloud TMS adoption among 3PLs scaling to support online retail growth. China’s Belt and Road Initiative elevated container throughput at participating ports by 47.6% year on year in 2025. The Association of Southeast Asian Nations’ digital customs framework reduced clearance times from 72 hours to 12 hours, drawing attention to platforms that auto-populate harmonized codes and certificates. Japan’s mandate for electronic proof of delivery for loads above 500 kg, effective in 2025, extends digitization to the last mile.
EMEA and South America Freight Transport Management Market
Europe holds a mid-20s revenue share. Mobility Package reforms limiting cabotage and tightening driver rest periods removed 8-10% of truck capacity in 2025, intensifying demand for consolidation algorithms. The European Green Deal’s corridor funding, coupled with the extension of the Emissions Trading System to maritime transport in 2024, requires shippers to calculate route-level carbon impacts. The Middle East is building trans-shipment gateways; DP World’s USD 3 billion Jebel Ali expansion added 4 million TEU capacity and reduced truck gate times to 25 minutes. South America and Africa remain nascent but could leapfrog legacy systems through mobile-first TMS apps that avoid heavy desktop requirements.

Regulatory Landscape
Regulation is increasingly shaping freight transport management platforms around digital, machine-readable documentation and interoperable data exchange. In the European Union, Regulation (EU) 2020/1056 on electronic freight transport information (eFTI) requires competent authorities to accept electronic freight data, while implementing acts including Implementing Regulation (EU) 2024/1942 and Regulation (EU) 2025/2243 set functional and technical specifications that eFTI platforms must meet to be certified. As a result, shippers, carriers, and logistics software providers are pushed to support standardized data elements, secure identity and audit trails, and cross-border interoperability across road, rail, and multimodal flows.
Outside the EU, policy activity is converging on cross-border digital trade facilitation and common data standards. In May 2026, APEC Trade Ministers adopted the Suzhou Declaration, which prioritized building an Asia-Pacific cross-border electronic bill of lading (eBL) technical interoperability framework, reinforcing momentum for digital ocean-freight documentation and platform-to-platform exchange. In rail, the EU advanced interoperability via Regulation (EU) 2026/253 on the rail telematics subsystem (TEL TSI) and Regulation (EU) 2026/1184 to improve capacity and traffic management using interoperable digital tools. This adds compliance pull for TMS and visibility providers serving rail and intermodal operators.
Value Chain Analysis
The value chain for freight transport management spans shippers and cargo owners, carriers across road, rail, ocean, and air, and logistics intermediaries (3PLs, freight forwarders, brokers) that coordinate capacity and exceptions. Technology inputs include cloud infrastructure, integration layers (APIs, EDI), telematics and IoT devices for tracking and condition monitoring, and data networks that aggregate location, capacity, and compliance signals. Platform vendors deliver core TMS capabilities (planning, execution, settlement, auditability) along with adjacent modules such as visibility, yard and warehouse integration, and carbon data capture. Implementation partners and systems integrators configure workflows and connect ERPs and customs systems.
Recent moves show tighter coupling between execution platforms and shared data ecosystems. In April 2026, Altana and Maersk partnered to build a digital trade network that embeds product-level visibility and trade compliance into Maersk workflows. In July 2026, Lufthansa Cargo, WiseTech Global, and IBS Software completed a live production implementation of IATA ONE Record for end-to-end air cargo data exchange, strengthening interoperability among airlines, forwarders, and software providers. The downstream go-to-market motion is also shifting toward embedded intelligence inside operational tools, reflected in the May 2026 expansion of FedEx and ServiceNow collaboration to bring FedEx logistics intelligence into enterprise workflows. Separately, in July 2026 project44s split created an AI-native agent and API infrastructure business (LSP44) tailored to 3PL and broker integration needs.
Competitive Landscape
The Freight Transport Management market exhibits moderate fragmentation; the top 10 players controlled roughly 40-45% of 2025 revenue. Traditional 3PLs such as C.H. Robinson, Kuehne + Nagel, and DB Schenker deepened digital capabilities by acquiring freight-tech startups and embedding AI into brokerage workflows. C.H. Robinson’s generative-AI agents automated 15% of 2025 North American truckload negotiations, trimming cycle times by nearly half. Venture-funded entrants Flexport and project44 raised a combined USD 2.3 billion through 2025, signaling investor confidence in predictive analytics models that emphasize exception management over transactional execution.
ERP giants Oracle and SAP exploit their customer bases to bundle TMS modules at marginal cost, forcing pure-play vendors to specialize by vertical or user experience. WiseTech Global’s CargoWise platform processed USD 85 billion in freight transactions in 2025, underscoring the network effect in digital freight networks. Patent filings in AI route optimization and blockchain authentication increased 34% year on year in 2025, showing the strategic importance of intellectual-property moats.
Cybersecurity hardening is emerging as a competitive differentiator following several high-profile ransomware attacks. Vendors that can provide ISO 27001 certification and SOC 2 Type II audits shorten procurement cycles and secure larger enterprise deals. Meanwhile, smaller regional specialists gain traction by localizing compliance modules for customs regimes in Southeast Asia, Africa, and Latin America, areas underserved by global suites.
Freight Transport Management Industry Leaders
Accenture PLC
Descartes Systems Group Inc.
Manhattan Associates Inc.
CTSI-Global LLC
Blue Yonder Group, Inc.
- *Disclaimer: Major Players sorted in no particular order
Freight Transport Management Market Companies Covered in this Report
- Accenture plc
- Manhattan Associates Inc.
- Blue Yonder Group, Inc.
- CTSI-Global LLC
- Descartes Systems Group Inc.
- DSV A/S
- Korber Supply Chain Software GmbH (HighJump)
- CEVA Logistics SA
- Schenker AG (DB Schenker)
- GEODIS SA
- Oracle Corporation
- SAP SE
- Trimble Inc.
- C.H. Robinson Worldwide, Inc.
- Kuehne + Nagel International AG
- XPO Logistics, Inc.
- Deutsche Post DHL Group (DHL Global Forwarding)
- FedEx Corporation
- United Parcel Service, Inc.
- DPDgroup (GeoPost SA)
- Flexport Inc.
- WiseTech Global Limited
- FourKites Inc.
- project44 Inc.
- Transporeon GmbH
- Honeywell International Inc.
- Shippeo

Market Opportunities and Future Outlook
Digitization mandates and public programs are creating near-term whitespace for certified, interoperable document and compliance workflows inside freight platforms. The EU eFTI framework (Regulation (EU) 2020/1056 with Implementing Regulation (EU) 2024/1942 and Regulation (EU) 2025/2243) is a concrete catalyst for platforms that can package certified eFTI data exchange, auditability, and identity controls as configurable capabilities across road, rail, and multimodal operations. At the same time, a parallel opportunity is forming in cross-border ocean documentation and trade facilitation as APECs May 2026 Suzhou Declaration elevates eBL technical interoperability. This favors TMS, forwarder operating systems, and visibility networks that can normalize data elements and orchestrate multi-party workflows.
AI-native decisioning and agent frameworks are becoming a competitive battleground and a monetizable upgrade path for shippers and LSPs that want fewer manual touches across planning, tendering, and exception management. Evidence from 2026 includes C.H. Robinsons release of Lean AI Engineer (June 2026) to surface network inefficiencies quickly, UPSs real-time digital twin initiative updating every 10 minutes (June 2026) to support control-tower actions, and project44s July 2026 launch of LSP44 to embed agent and API infrastructure directly into logistics service provider products. At the same time, national and corridor-level digitization platforms are opening regional entry points for vendors and integrators: TRUXXs Qawafel pilot (January 2026) positions the UAE around structured digital governance and pricing visibility for land freight, while the U.S. Department of Transportation issued a March 2026 RFI toward a National Strategy for Transportation Digital Infrastructure. This supports demand for standardized, multi-modal data layers that can be operationalized within TMS and related execution systems.
Recent Industry Developments in Freight Transport Management Market
- July 2026: Descartes Systems Group acquired Drivin, a Latin American last-mile delivery management provider, for about USD 30 million upfront. The deal extends Descartes reach into last-mile execution and complements freight workflows where delivery appointments, proof-of-delivery events, and carrier performance data feed upstream planning.
- June 2026: Descartes Systems Group launched AuditLog within MyCarrierPortal to help brokers and shippers create auditable, standardized carrier-selection records. The capability strengthens governance and compliance readiness in procurement workflows and supports TMS users facing tighter scrutiny around carrier onboarding and selection consistency.
- December 2025: Kuehne + Nagel partnered with Microsoft to roll out Azure OpenAI-powered booking assistants aimed at reducing manual data entry and accelerating quote turnaround. Embedding generative AI into booking and pricing workflows increases competitive pressure on TMS and forwarder platforms to add similar co-pilot features and tighter enterprise integration.


Freight Transport Management Market Report Scope and Research Methodology
Market Definition and Coverage
For this study, the freight transport management market covers software and related services used to plan, execute, and monitor freight moves across modes. This includes cost control, security, visibility, and coordination workflows.
Scope exclusions: We do not count the freight transportation revenue itself (carrier haulage charges) as part of this market value.
Segments Covered in This Report
- By Solution
- Freight Transportation Cost Management
- Freight Security and Monitoring System
- Freight Mobility Solution
- Warehouse Management System
- Freight 3PL Solutions
- Other Solutions
- By Deployment
- Cloud
- On-Premise
- By Mode of Transport
- Rail Freight
- Road Freight
- Waterborne Freight
- Air Freight
- By End-User
- Aerospace and Defense
- Automotive
- Oil and Gas
- Consumer and Retail
- Energy and Power
- Other End-Users
- By Geography
- North America
- United States
- Canada
- Mexico
- South America
- Brazil
- Argentina
- Rest of South America
- Europe
- Germany
- United Kingdom
- France
- Italy
- Spain
- Rest of Europe
- Asia-Pacific
- China
- Japan
- India
- South Korea
- ASEAN
- Rest of Asia-Pacific
- Middle East
- Saudi Arabia
- United Arab Emirates
- Rest of Middle East
- Africa
- South Africa
- Nigeria
- Rest of Africa
- North America
Data Sources, Market Sizing, and Validation
Desk Research
Desk research was used to set the outer boundaries of demand and to anchor the model to observable freight activity. We leaned on public series such as US Bureau of Transportation Statistics releases, Eurostat transport and trade tables, World Bank logistics indicators, UN Comtrade trade flows, and OECD transport statistics (as examples) to understand shipment intensity, trade direction, and modal mix.
We also reviewed company annual reports, investor presentations, press coverage, and association publications to map solution categories and typical buying patterns. Where needed, paid subscriptions for company financials and news intelligence, plus shipment-level import and export records and patent databases, helped validate whether revenue and product positioning stayed aligned with the market scope. These sources are illustrative and not exhaustive, and many other references were used to collect data, cross-check assumptions, and clarify specific points during the work.
Primary Interviews and Surveys
Primary work focused on interviews and surveys with solution providers, logistics service firms, shippers, and channel partners who influence purchasing and deployment decisions. Respondent input helped tighten adoption rate assumptions, confirm the direction of cloud versus on-premise mix, and refine how pricing behaves across freight cycles. This was collected across key regions, and the resulting ranges were used to lock the final assumptions.
Distribution of primary research fieldwork respondents
| Company type | Respondent position | Region |
|---|---|---|
| Top tier: 38% | CXOs: 15% | APAC: 44% |
| Mid tier: 46% | Functional/Unit leaders: 30% | EMEA: 30% |
| Smaller Players: 16% | Managers: 55% | Americas: 26% |
Market-Sizing & Forecasting
The core build uses a top-down approach, where freight activity indicators are translated into an addressable spend pool for freight transport management solutions and services. We start from the active freight base by region and mode, apply adoption and usage intensity, and then use an ASP logic that separates subscription fees, service bundles, and deployment differences.
To keep outputs realistic, totals are cross-checked using selective bottom-up approximations, such as sampled supplier revenue splits, channel checks, and typical ASP times estimated customer volumes for core solutions. When disclosures do not separate freight transport management cleanly, we use conservative allocation keys based on product mix statements and customer references. The assumptions are then re-tested in follow-up calls.
Key inputs that shaped the model (illustrative) include modal freight mix (road, rail, waterborne, air), the share of shipments handled through digital planning and visibility tools, cloud penetration by buyer type, implementation and integration attach rates, and average contract duration with renewal behavior. For forecasting, we used scenario analysis supported by a light multivariate regression overlay. Changes in trade flows, manufacturing output direction, and logistics cost pressure were used to guide year-by-year adoption and pricing progression that experts considered most plausible.
Data Validation & Update Cycle
Outputs are triangulated across independent signals, then reviewed for variance against expected ranges by region, mode, and deployment mix. When a number looks out of line, we trace it back to the specific input driver and run follow-up outreach if the variance cannot be explained using public data.
Before sign-off, the model and narrative go through multiple analyst checks to keep assumptions, currency handling, and growth math consistent across sections. Reports are refreshed annually, and interim adjustments are made when material events shift adoption, pricing, or freight activity. Right before delivery, a final review pass is completed so clients receive the latest updated view available at the time.
Mordor Intelligence's Freight Transport Management Market Size Compared With Other Published Estimates
It is normal to see different market-size values for freight transport management because sources may pick different boundaries, base years, and pricing assumptions. Differences also show up when one publisher emphasizes software only while another includes broader service layers, and when exchange rates and inflation assumptions are applied at different points in time.
The biggest gap drivers here are usually refresh cadence and currency timing. The next factor is how ASPs are treated for cloud subscriptions versus on-premise plus integration. When adoption rates are re-checked against freight-cycle indicators and pricing is normalized to the same currency window close to publication, the 2026 total lands differently. This is one reason the final value in Mordor Intelligence can separate a software-led demand pool from service-heavy totals that were locked earlier.
Benchmark comparison
| Source | Market Size | Gaps in Research Methodology |
|---|---|---|
| Mordor Intelligence | USD 26.43 B (2026) | |
| Industry Publisher A | USD 32.60 B (2025) | Uses a 2025 anchor year and a longer-range outlook, and its scope messaging suggests a broader inclusion of solution plus services, which can lift the near-term value when service-heavy contracts are counted at higher shares. |
| Research Publisher B | USD 20.17 B (2024) | Anchors sizing to a 2024 base year with a slower growth profile, which can understate the current market if cloud adoption and ASP progression are not refreshed using newer freight-cycle and pricing checkpoints. |
Taken together, the spread is mainly explained by different base years and how pricing and services are recognized, rather than a disagreement that demand exists. By keeping the scope tied to freight management solutions and applying repeatable adoption and ASP steps that are rechecked near release, the final value stays easier to trace back to clear drivers.


Key Questions Answered in the Report
What is the current size and growth trajectory of the Freight Transport Management Market?
The market reached USD 26.43 billion in 2026 and is projected to grow to USD 38.69 billion by 2031 at a CAGR of 7.92%.
Which solution type holds the largest market share?
Warehouse management systems commanded 33.68% of solution-type revenue in 2025, while freight mobility solutions are growing fastest at 8.22% CAGR through 2031.
What is driving cloud deployment adoption in freight management?
Cloud-based models captured 58.25% share in 2025 and are growing at 9.62% CAGR, driven by subscription pricing that eliminates upfront capital expenditure and delivers 99.95% uptime across global data centers.
Which is the fastest growing region in Freight Transport Management Market?
Asia Pacific is expanding at 10.09% CAGR through 2031.
Which mode of transport is experiencing the fastest growth?
Air freight is expanding at 8.07% CAGR through 2031, driven by e-commerce parcels that reached 33% of FedEx's air cargo volume in 2024, up from 22% in 2020.
Which end-user segment drives the most demand?
Consumer and retail captured 25.18% of demand in 2025 and are growing at 9.11% CAGR.
Page last updated on:


