Market Overview
| Study Period | 2021 - 2031 |
|---|---|
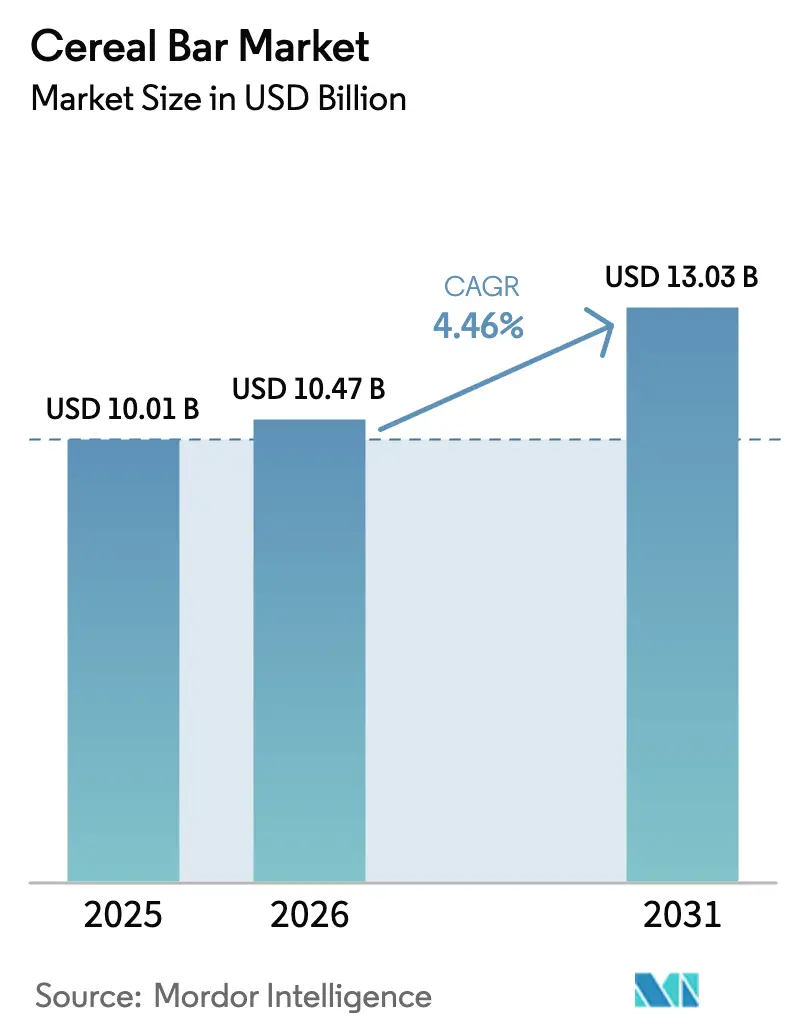
| Market Size (2026) | USD 10.47 Billion |
| Market Size (2031) | USD 13.03 Billion |
| Growth Rate (2026 - 2031) | 4.46% CAGR |
| Fastest Growing Market | Asia Pacific |
| Largest Market | North America |
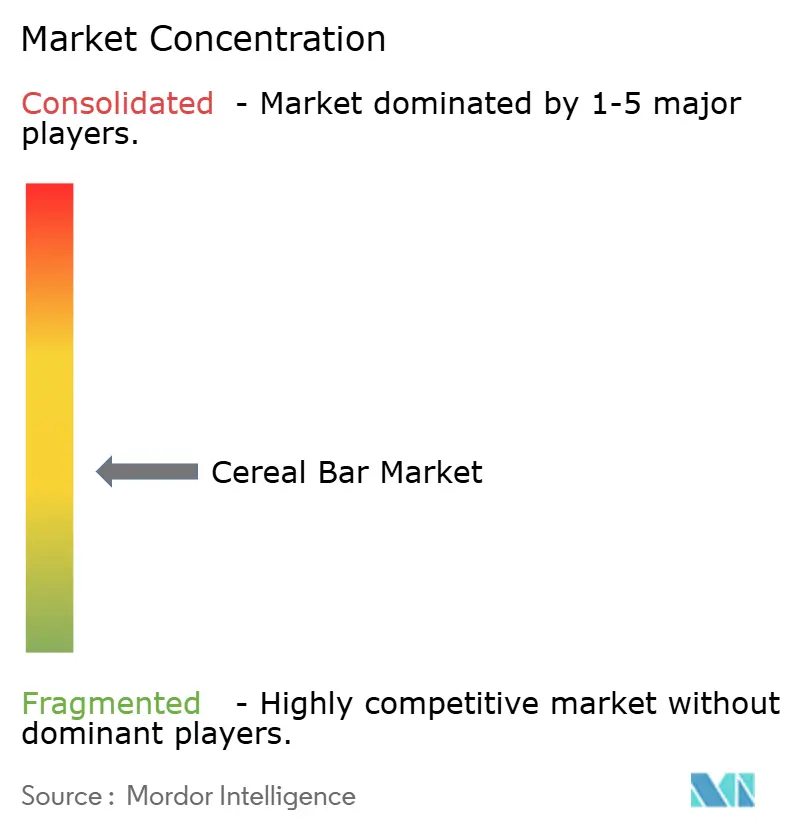
| Market Concentration | Medium |
Major Players
*Disclaimer: Major Players sorted in no particular order Image © Mordor Intelligence. Reuse requires attribution under CC BY 4.0. |
|
Cereal Bar Market Analysis by Mordor Intelligence
The global cereal bar market was valued at USD 10.01 billion in 2025 and is estimated to grow from USD 10.47 billion in 2026 to reach USD 13.03 billion by 2031, at a compound annual growth rate (CAGR) of 4.46% during the forecast period (2026-2031). The global cereal bar market is driven by evolving consumer lifestyles that prioritize convenience alongside perceived health benefits. Factors such as busy schedules, an increase in single-person households, and a growing preference for on-the-go meal replacements have positioned cereal bars as a practical option for breakfast, snacks, or quick energy. Additionally, rising nutrition awareness has increased demand for bars offering functional benefits, such as higher protein content, dietary fiber, reduced sugar, or added vitamins and minerals. Manufacturers addressing these preferences are attracting health-conscious consumers seeking both convenience and nutritional value. Product innovation and premiumization continue to play a significant role in market growth. Brands are differentiating their offerings through unique ingredient combinations, such as ancient grains, plant proteins, and superfoods, along with clean-label claims and advancements in taste and texture that replicate indulgent snacks while maintaining improved nutritional profiles.
Key Report Takeaways
- By product type, breakfast/granola bars led with 80.14% share in 2025, while “Other Bars” are forecast to expand at a 6.16% CAGR through 2031.
- By functional claim, conventional recipes held 86.58% of the 2025 volume, whereas organic variants are set to grow at a 6.23% CAGR to 2031.
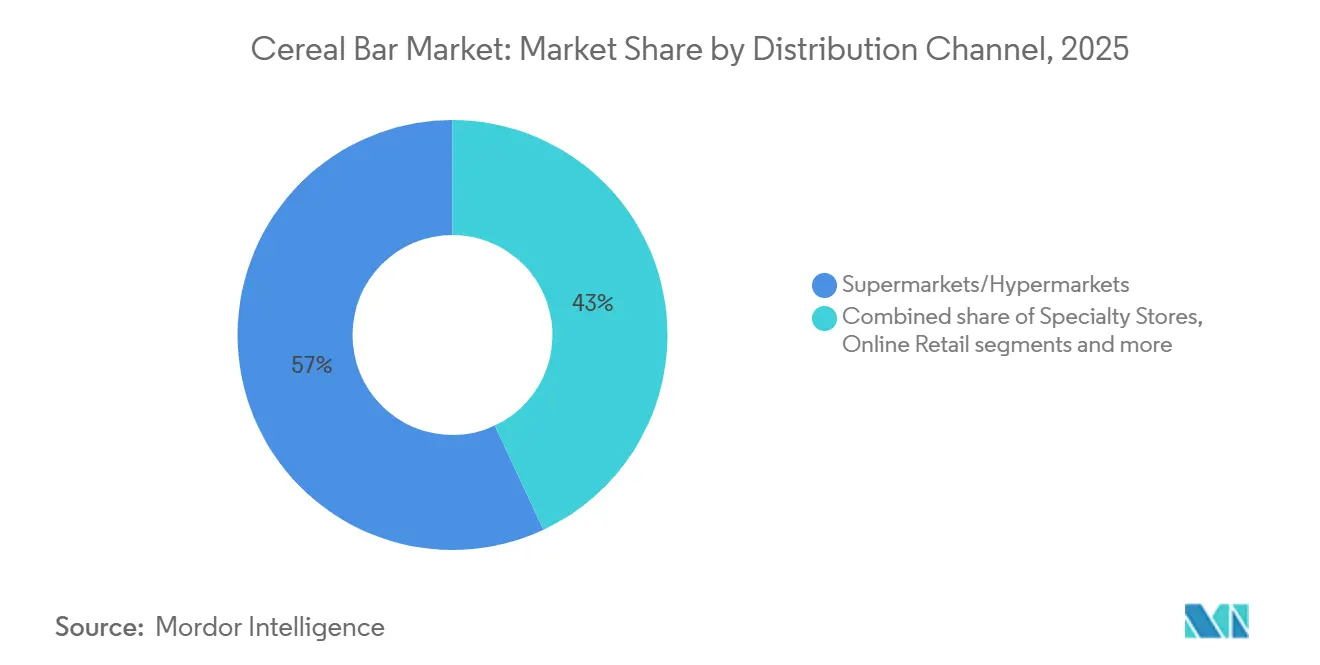
- By distribution channel, supermarkets/hypermarkets captured 56.96% of revenue in 2025; online retail is projected to advance at a 6.53% CAGR over 2026-2031.
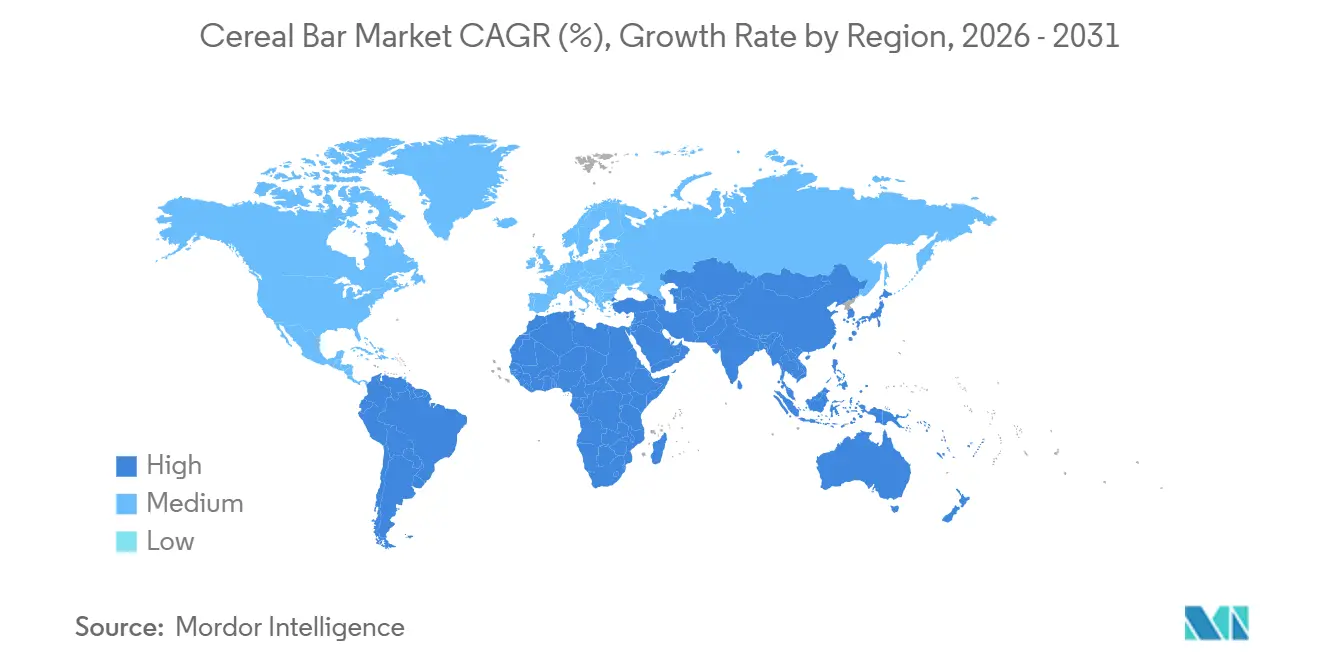
- By geography, North America accounted for 36.01% of revenue in 2025; however, Asia-Pacific is expected to grow with the fastest 5.82% CAGR through 2031.
Note: Market size and forecast figures in this report are generated using Mordor Intelligence’s proprietary estimation framework, updated with the latest available data and insights as of January 2026.
Global Cereal Bar Market Trends and Insights
Drivers Impact Analysis*
| Driver | (~) % Impact on CAGR Forecast | Geographic Relevance | Impact Timeline |
|---|---|---|---|
| Increasing demand for convenient on-the-go snack bars | +1.2% | Global, with peak intensity in North America, Europe, and urban Asia-Pacific | Short term (≤ 2 years) |
| Growing health awareness driving nutritious snack bar consumption | +1.0% | Global, strongest in North America and Europe, accelerating in Asia-Pacific | Medium term (2-4 years) |
| Rising fitness culture supporting cereal bar demand | +0.8% | North America, Europe, urban China and India | Medium term (2-4 years) |
| Growing demand for clean-label and plant-based bars | +0.9% | North America and Europe core, emerging in Asia-Pacific premium segments | Medium term (2-4 years) |
| Product innovation and flavor diversification | +0.7% | Global, with fastest adoption in North America and Western Europe | Short term (≤ 2 years) |
| Rising demand for functional and fortified bars | +0.8% | Global, particularly North America, Europe, and affluent Asia-Pacific metros | Long term (≥ 4 years) |
| Source: Mordor Intelligence | |||


Increasing demand for convenient on-the-go snack bars
Portability has become an essential feature as longer commute times and hybrid work schedules disrupt traditional meal patterns. According to Mondelez International's 2024 State of Snacking report, 63% of respondents snack at least twice daily, with bars being the preferred choice for out-of-home consumption due to their minimal mess and ambient stability. This trend is particularly evident among individuals aged 25 to 44, who prioritize convenience over cost and are willing to pay a premium for single-serve formats. The shift gained momentum post-pandemic, driven by return-to-office mandates that increased desk-side eating and by fitness enthusiasts using bars as pre- and post-workout fuel, eliminating the need for shaker bottles and refrigeration. Retailers have adapted by increasing bar displays in checkout lanes and travel-hub kiosks, where impulse purchases represent a significant portion of sales. Compliance with ISO 22000 food safety standards has become a baseline requirement for brands aiming to secure placement in airport and transit retail, where stricter shelf life and tamper-evidence standards apply compared to grocery channels.
Growing health awareness driving nutritious snack bar consumption
Consumers are increasingly analyzing nutrition labels with a level of detail previously associated with pharmaceutical inserts. This shift in behavior has been further driven by social media influencers who evaluate ingredient lists in real time. According to the International Food Information Council's 2025 survey, 17% of U.S. adults prioritize protein content in snacks[1]Source: International Food Information Council, "Americans’ Perceptions of Protein", ific.org. This trend has prompted brands to reformulate existing product lines to meet consumer demand for higher protein content. Regulatory changes have also played a significant role; the U.S. Food and Drug Administration's (FDA) 2024 updated definition of "healthy" now mandates that snack bars include a meaningful amount of food-group components (such as vegetables, fruit, dairy, protein, or whole grains) while limiting saturated fat and sodium content[2]Source: U.S. Food & Drug Administration, "Use of the "Healthy" Claim on Food Labeling", fda.gov. This change has excluded chocolate-coated indulgence bars from being marketed as healthy options, forcing manufacturers to adjust formulations or reposition their products. Similarly, Europe's Nutri-Score labeling system, adopted by countries including Germany, France, Belgium, and Spain, penalizes products high in sugar and saturated fat[3]Source: Federal Ministry of Agriculture, Food and Regional Identity, "Nutri-Score", bmleh.de. This has encouraged manufacturers to develop products like nut butters and seed blends that achieve a Nutri-Score rating of B or higher, aligning with consumer preferences for healthier options and regulatory requirements.
Growing demand for clean-label and plant-based bars
Plant-based protein has transitioned from a niche category to widespread adoption, driven by the growing popularity of flexitarian diets and increasing environmental concerns influencing consumer choices. This shift reflects a broader consumer trend toward sustainable and health-conscious eating habits. In 2024, Ingredion launched a textured pea-protein isolate specifically designed for bar applications. This product offers a neutral taste and eliminates beany off-notes, addressing a common challenge in plant-based protein formulations. By doing so, it enables brands to develop vegan SKUs with texture and mouthfeel comparable to whey-based bars, thereby expanding options for consumers seeking plant-based alternatives without compromising on sensory attributes. Clean-label claims defined by formulations free from artificial additives and featuring recognizable ingredient names account for a significant share of new bar launches in North America and Western Europe. This trend highlights the growing demand for transparency and simplicity in product ingredients, as consumers increasingly prioritize clean-label products in their purchasing decisions.
Rising demand for functional and fortified bars
Functional ingredients such as proteins, probiotics, adaptogens, and omega-3s are increasingly being incorporated into bars as consumers look for products that offer multiple health benefits in a single serving. These ingredients provide targeted health benefits, such as improved digestion, enhanced skin health, and support for cognitive function. For instance, probiotic strains like Bacillus coagulans GBI-30 have demonstrated stability in low-moisture bar formulations, maintaining viability during ambient storage for up to 18 months and delivering 1 billion CFUs per serving. This level supports digestive health claims under both FDA and EFSA guidelines, ensuring the efficacy of the product over its shelf life. Additionally, fortification with vitamins D, B12, and iron addresses micronutrient deficiencies highlighted by the World Health Organization, particularly among populations with limited consumption of animal products. These nutrients play a critical role in supporting bone health, energy production, and oxygen transport in the body. This enables brands to position their products around "complete nutrition" claims, appealing to health-conscious consumers seeking convenient and nutrient-dense options.
Restraints Impact Analysis*
| Restraint | (~) % Impact on CAGR Forecast | Geographic Relevance | Impact Timeline |
|---|---|---|---|
| Stringent sugar-reduction regulations limiting product formulations | -0.6% | Europe, North America, with emerging enforcement in Asia-Pacific (Singapore, Thailand) | Short term (≤ 2 years) |
| Volatile prices of nuts and seeds impacting costs | -0.5% | Global, most acute in North America and Europe where nut-based bars dominate | Medium term (2-4 years) |
| Presence of counterfeit and unlabeled products | -0.3% | Asia-Pacific, Middle East, Africa, and rural South America | Medium term (2-4 years) |
| Low penetration in rural and semi-urban markets | -0.4% | Asia-Pacific, Africa, and interior South America | Long term (≥ 4 years) |
| Source: Mordor Intelligence | |||
Stringent sugar-reduction regulations limiting product formulations
Governments globally have intensified sugar-reduction mandates, limiting the formulation flexibility that brands previously had. The FDA's proposed "healthy" definition includes a baseline limit of 5% of the Daily Value (DV) for added sugars per Reference Amount Customarily Consumed (RACC). This effectively disqualifies products sweetened with honey or containing high amounts of dried fruit from making health claims unless reformulated with non-nutritive sweeteners. These regulations compel brands to replace ingredients like dates and agave with alternatives such as stevia, monk fruit, or allulose, which present their own challenges related to taste, cost, and consumer acceptance. Stevia and monk fruit, for instance, may leave a lingering aftertaste, while allulose, though closer to sugar in taste, is more expensive and less widely available. Additionally, reformulation efforts can impact product texture and shelf life, further complicating compliance with these mandates.
Volatile prices of nuts and seeds impacting costs
Raw material inflation has reduced gross margins for nut-intensive bars, driven by rising almond prices due to California's prolonged drought and increased export demand from China's growing snack market. Cashew costs have also risen as India, the leading global processor, faced labor shortages and higher energy costs, which elevated shelling expenses. Sunflower and pumpkin seeds, previously seen as cost-effective alternatives, have become more expensive due to reduced export capacity from Ukraine and unfavorable weather conditions in Argentina's growing regions. In response, brands have increased the use of oats and rice crisp ingredients that provide price stability and allergen-friendly attributes. However, this adjustment diminishes the premium perception associated with nut-heavy formulations. Mid-tier players, lacking the financial capacity for forward contracting or vertical integration, remain vulnerable to spot-market volatility, which can significantly impact quarterly margins.
*Our forecasts treat driver/restraint impacts as directional, not additive. The impact forecasts reflect baseline growth, mix effects, and variable interactions.
Segment Analysis
By Product Type: Breakfast and Granola Bars Leads, Other Bars Gain Momentum
Breakfast/granola bars accounted for an 80.14% market share in 2025, driven by long-standing brand equity and widespread retail availability. These bars have been a staple in the market due to their convenience, taste, and alignment with traditional breakfast habits. However, the "Other Bars" category, which includes protein, meal-replacement, energy, and specialty bars, is projected to grow at an annual rate of 6.16% through 2031. This growth is fueled by changing consumer preferences, particularly among health-conscious individuals and those with active lifestyles. For instance, Kellogg's introduction of Special K Protein Snack Bars, featuring 6 grams of protein, highlights this trend. These products cater to fitness-focused consumers who use bars as post-workout recovery options rather than as breakfast alternatives. Additionally, meal-replacement bars, enriched with 20-25% of daily micronutrient needs, are gaining popularity among busy professionals who often forgo lunch. These bars provide a convenient and nutritious solution for individuals seeking to maintain their dietary requirements despite time constraints.
Energy bars, once primarily associated with endurance athletes, are now diversifying into distinct sub-niches. Caffeinated options, containing 80-100 milligrams of caffeine per serving, are gaining popularity among shift workers and gamers. Meanwhile, adaptogen-infused bars are positioned to address stress reduction, particularly within corporate wellness programs. Traditional breakfast bars are encountering challenges due to declining cereal consumption and the growing preference for savory breakfast alternatives. To remain competitive, brands are introducing indulgent flavors like salted caramel and dark chocolate sea salt, which blend elements of nutrition and confectionery.


By Functional Claim: Coventional Reign Supreme, Organic Accelerates
Conventional formulations accounted for an 86.58% market share in 2025, driven by established consumer habits and price sensitivity. However, organic bars are projected to grow at an annual rate of 6.23% through 2031, influenced by clean-label mandates and increasing environmental concerns that are reshaping purchasing decisions. The USDA Organic certification, which prohibits the use of synthetic pesticides, GMOs, and artificial additives, has emerged as a quality benchmark for affluent consumers willing to pay a premium for perceived purity and sustainability. Similarly, Europe's EU Organic regulation, which imposes additional restrictions on processing aids and mandates annual third-party audits, has supported the growth of organic bar adoption in countries such as Germany and France.
Conventional bars maintain structural advantages in mass-market channels, where purchase decisions are often influenced by price-per-calorie considerations. Retailers such as Costco and Aldi have introduced private-label organic bars, offering USDA-certified products at price points comparable to conventional branded alternatives. This trend poses a risk of commoditizing the organic segment. Additionally, functional claims such as gluten-free, non-GMO, and vegan are increasingly overlapping with organic positioning, leading to certification fatigue among consumers who find it challenging to distinguish between value propositions.
By Distribution Channel: Supermarkets/Hypermarkets Dominates, E-commerce Reshapes the Aisle
Supermarkets/hypermarkets accounted for a 56.96% market share in 2025, driven by long-standing consumer habits and the advantage of impulse purchases facilitated by checkout-lane product placement. However, online retail is expected to grow at an annual rate of 6.53% through 2031, as direct-to-consumer models and subscription services transform brand-consumer interactions. Specialty e-commerce platforms, such as Thrive Market, which offer curated organic and clean-label products to membership-fee-paying customers, have established a niche among health-conscious consumers who prioritize ingredient transparency over cost. Convenience and grocery stores cater to immediate consumption needs, such as gas stations and corner shops, where refrigeration limitations favor ambient-stable bars over fresh alternatives.
The rapid growth of e-commerce and the convenience it provides have significantly influenced consumer purchasing behavior, driving a shift toward online platforms. Consumers value the ability to browse, compare, and purchase products from home, benefiting from fast delivery and flexible payment options. Digital marketplaces and brand websites often offer a broader range of cereal bar options, including niche, premium, and international brands, which are not always available in local retail stores. This expanded selection encourages consumers to shop online for greater variety. Additionally, online promotions and pricing incentives, such as discounts, flash sales, bundled offers, free shipping thresholds, and loyalty rewards, appeal to cost-conscious shoppers and contribute to increased cart values.

Geography Analysis
In 2025, North America accounted for 36.01% of the revenue, supported by established health-focused snacking habits and high disposable incomes. The region's developed retail infrastructure and the availability of diverse product options further reinforce its market leadership. Consumers in North America increasingly prefer convenient, on-the-go snacks that align with health and wellness objectives, such as high-protein and low-sugar alternatives. Moreover, the rising demand for clean-label products, emphasizing natural and minimally processed ingredients, is influencing purchasing behavior. The presence of key market players and their ongoing innovations in flavors, packaging, and nutritional content also contribute to the region's strong market performance.
Asia-Pacific is experiencing the highest growth among all regions, with a CAGR of 5.82%. Urbanization is driving the middle class toward convenient, on-the-go nutrition options. In countries like India, Indonesia, and Vietnam, digital commerce is overcoming traditional infrastructure challenges. As gym culture becomes more popular, Chinese consumers are increasingly opting for Western protein bars, though they show a preference for local flavors such as red bean and matcha. In India, the brand Yoga Bar has expanded its product range from granola bars to include muesli, nut butters, and breakfast mixes, utilizing direct-to-consumer logistics to reach customers effectively. In this evolving market, global brands are adapting by customizing SKUs to suit regional preferences, offering smaller package sizes, and reducing sweetness levels to build customer loyalty.
South America and the Middle East and Africa exhibit significant growth potential. Urban areas in Brazil are moving towards a balanced cereal bar market, combining elements of indulgence and health. However, rural markets face challenges due to price sensitivity and a fragmented trade structure. In the Gulf Cooperation Council, expatriate sports communities are driving demand for premium protein bars, although overall consumption remains below global averages. Establishing distribution partnerships and local production facilities can help brands reduce tariffs and better align with local consumer preferences.

Competitive Landscape
The cereal bar market is characterized by a moderately fragmented competitive landscape, where established multinational corporations compete with smaller specialty players. This structure drives companies to implement various strategies, including product innovation, marketing initiatives, strategic partnerships, and mergers and acquisitions, to enhance their market position. Multinational companies such as WK Kellogg's and General Mills utilize their extensive distribution networks, economies of scale, and strong brand recognition to maintain their market leadership. For example, WK Kellogg's continues to expand its Nutri-Grain and Special K product lines to appeal to health-conscious consumers. Meanwhile, smaller companies like KIND Snacks and RXBAR target niche markets by offering specialized products, such as organic, vegan, or gluten-free options, to meet specific consumer demands and secure their market share.
The competition is intensified by growing consumer demand for healthier snack options, driven by increasing health awareness and evolving dietary preferences. This trend has led companies to innovate by launching products with reduced sugar, high protein content, and functional ingredients such as probiotics and superfoods. For example, RXBAR focuses on clean labeling and minimal ingredients, while KIND Snacks uses nuts, seeds, and whole grains to attract health-conscious consumers. Furthermore, sustainability has become a significant consideration, with companies adopting eco-friendly packaging and sourcing ethically produced ingredients to cater to environmentally aware consumers. For instance, Nature Valley has introduced recyclable wrappers for its granola bars as part of its sustainability efforts.
Opportunities remain in functional categories such as collagen beauty bars, adaptogen stress-relief bars, and prebiotic gut-health bars. Regulatory uncertainty surrounding structure-function claims discourages risk-averse incumbents but appeals to venture-backed startups willing to navigate unclear regulatory frameworks until enforcement provides clarity. Emerging players are utilizing technology to shorten product development timelines and tailor offerings to individual needs.
Cereal Bar Industry Leaders
-
PepsiCo, Inc.
-
General Mills Inc.
-
Mondelēz International Inc
-
Mars Inc
-
WK Kellogg Co.
- *Disclaimer: Major Players sorted in no particular order

Recent Industry Developments
- January 2026: Kind LLC, a subsidiary of Mars, Inc., introduced Kind Protein Max granola. Made with whole foods such as oats and nuts, the granola provides 9 grams of fiber and 15 grams of protein. It is available in two flavors: sweet and salty caramel almond, and peanut butter. Kind Protein Max granola can be purchased at major retailers, including Publix, Amazon, Walmart, Meijer, Giant, Kroger, and Food Lion.
- January 2026: Mars, Inc. has expanded its Nutri-Grain portfolio with the introduction of Nutri-Grain Crunchy, a bar designed to offer increased fiber, whole grains, and a crisp texture. Each bar contains a minimum of 23 grams of whole grains and serves as a good source of fiber. Nutri-Grain Crunchy is available in two variants: honey oat flax and chocolate chip chia.
- May 2025: Oatside introduced its oat cereal bars to the Malaysian market. The 18g wholegrain bars, initially launched in Indonesia in 2024, feature high fiber content and address the growing demand from health-conscious consumers. The product line includes three variants: Strawberry White Chocolate, Peanut Butter, and Chocolate, meeting consumer needs for portable and nutritious snack options.
- April 2025: Junkless expanded its product portfolio with granola bars in Birthday Cake and Berries and Cream variants, incorporating a drizzle coating. The product formulation combines whole grain oats with a creamy drizzle and excludes artificial flavors, colors, and preservatives.
- September 2024: Three Wishes Cereal launched grain-free granola bars in three variants: Chocolate Chip, Chocolate Peanut Butter, and S'mores. The products retail at USD 5.99 per pack and are distributed across 1,500 Target stores in the United States.
- January 2024: McKee Foods expanded its operations by introducing Sunbelt Bakery chewy granola bars with sell-by date codes specifically for vending machines. The company launched three variants: chocolate chip, oats and honey, and fudge-dipped chocolate chip. The granola bars maintain shelf-stable properties and individual packaging.


Research Methodology Framework and Report Scope
Market Definitions and Key Coverage
Mordor Intelligence defines the cereal bar market as packaged bars in which cereal grains (chiefly oats, rice, wheat, or mixed granola) are compressed with binders and inclusions such as nuts, dried fruit, or chocolate, sold ready-to-eat for meal replacement or snacking convenience. Products formulated as protein or energy bars are counted only when cereals remain the dominant base.
Scope exclusion: Powdered drink mixes, baked breakfast biscuits, and pure protein bars with less than 25% cereal content fall outside our model.
Segmentation Overview
-
By Product Type
- Breakfast/Granola Bars
- Other Bars
-
By Functional Claim
- Organic
- Conventional
-
By Distribution Channel
- Supermarkets/Hypermarkets
- Convenience/Grocery Stores
- Specialty Stores
- Online Retail
- Other Distribution Channels
-
By Geography
-
North America
- United States
- Canada
- Mexico
- Rest of North America
-
Europe
- Germany
- United Kingdom
- France
- Italy
- Spain
- Netherlands
- Sweden
- Poland
- Belgium
- Rest of Europe
-
Asia-Pacific
- China
- Japan
- India
- Australia
- Singapore
- Indonesia
- Thailand
- South Korea
- Rest of Asia-Pacific
-
South America
- Brazil
- Argentina
- Colombia
- Chile
- Peru
- Rest of South America
-
Middle East and Africa
- United Arab Emirates
- Saudi Arabia
- Turkey
- South Africa
- Nigeria
- Egypt
- Morocco
- Rest of Middle East and Africa
-
North America
Detailed Research Methodology and Data Validation
Primary Research
We interviewed nutritionists, private-label buyers at leading grocery chains, and operations managers at mid-sized bar co-packers across North America, Europe, and Asia-Pacific. Their insights refined flavor trend weights, average selling prices (ASPs), and e-commerce share beliefs, closing gaps that desk work left open.
Desk Research
We began by extracting shipment and retail sell-out data from open sources such as UN Comtrade, USDA GATS, Eurostat, and China Customs. We then aligned those figures with consumption surveys from the WHO Global Dietary Database. Trade association dashboards, including SNAC International and the EU Breakfast Cereal Association, helped us track category promotions and regulatory shifts around sugar caps. Company 10-Ks, investor decks, and news feeds on Dow Jones Factiva supplied price moves and launch pipelines. D&B Hoovers furnished revenue splits for key private players. These sources are illustrative; many additional materials informed the evidence base.
Market-Sizing & Forecasting
A top-down build starts with country-level production plus net trade to approximate apparent consumption, which is then balanced against per-capita intake surveys. Results are cross-checked through selective bottom-up tests, sampled factory throughput, and online ASP multiplied by volume panels before totals are adjusted. Key drivers in our model include oat futures, urban convenience-store density, disposable income of 18-35-year-olds, health-claim labeling updates, and seasonality of outdoor sports events. Multivariate regression, benchmarked to these variables, produces the 2025-2030 trajectory; scenario analysis handles sugar-tax shocks or raw-material spikes.
Data Validation & Update Cycle
Outputs pass variance checks versus independent retail indices; anomalies trigger peer reviews and, if needed, a quick re-survey of contacts. Reports refresh annually, and interim recalculations follow material recalls, regulatory bans, or double-digit currency swings.
Why Mordor's Cereal Bar Baseline Earns Buyer Trust
Published figures vary because firms choose different inclusion criteria, price conventions, and refresh cadences.
Key gap drivers include whether snack-type energy bars are grouped with pure cereal bars, how online discounting is averaged into ASPs, and the choice of 2024 FX rates versus rolling averages. Mordor's study fixes a cereal-led definition, applies blended retail prices, and rolls data every twelve months, yielding a more stable baseline.
Benchmark comparison
| Market Size | Anonymized source | Primary gap driver |
|---|---|---|
| USD 10.01 B | Mordor Intelligence | - |
| USD 19.22 B | Global Consultancy A | Bundles all snack bars and uses manufacturer list prices |
| USD 14.08 B | Industry Journal B | Projects from North America share only, then extrapolates globally |
Taken together, the comparison shows that when scope creep and single-region multipliers are removed, our 10.01 billion baseline offers decision-makers a transparent, repeatable point of reference that avoids hidden inflation and can be confidently traced back to observable trade and consumption signals.


Key Questions Answered in the Report
What is the global value projection for the cereal bar market by 2031?
The category is expected to reach USD 13.03 billion by 2031, reflecting a 4.46% CAGR from 2026 to 2031.
Which product type is expanding fastest within cereal bars?
“Other Bars,” which include protein and meal-replacement formats, are forecast to grow 6.16% annually through 2031.
Which region is poised for the highest growth?
Asia-Pacific is projected to post the quickest 5.82% CAGR through the forecast period due to rising incomes and fitness adoption.
How fast online channels are growing?
How fast are online channels growing?
Page last updated on:


