Touchless Sensing Market Size and Share
Market Overview
| Study Period | 2019 - 2030 |
|---|---|
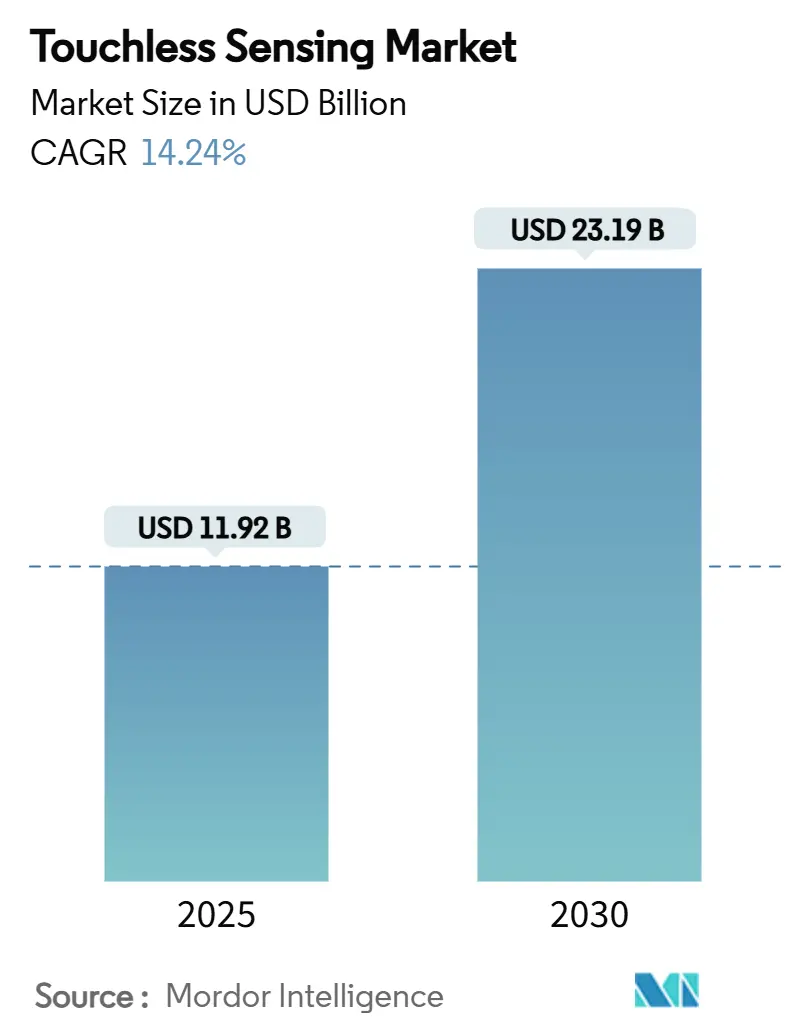
| Market Size (2025) | USD 11.92 Billion |
| Market Size (2030) | USD 23.19 Billion |
| Growth Rate (2025 - 2030) | 14.24% CAGR |
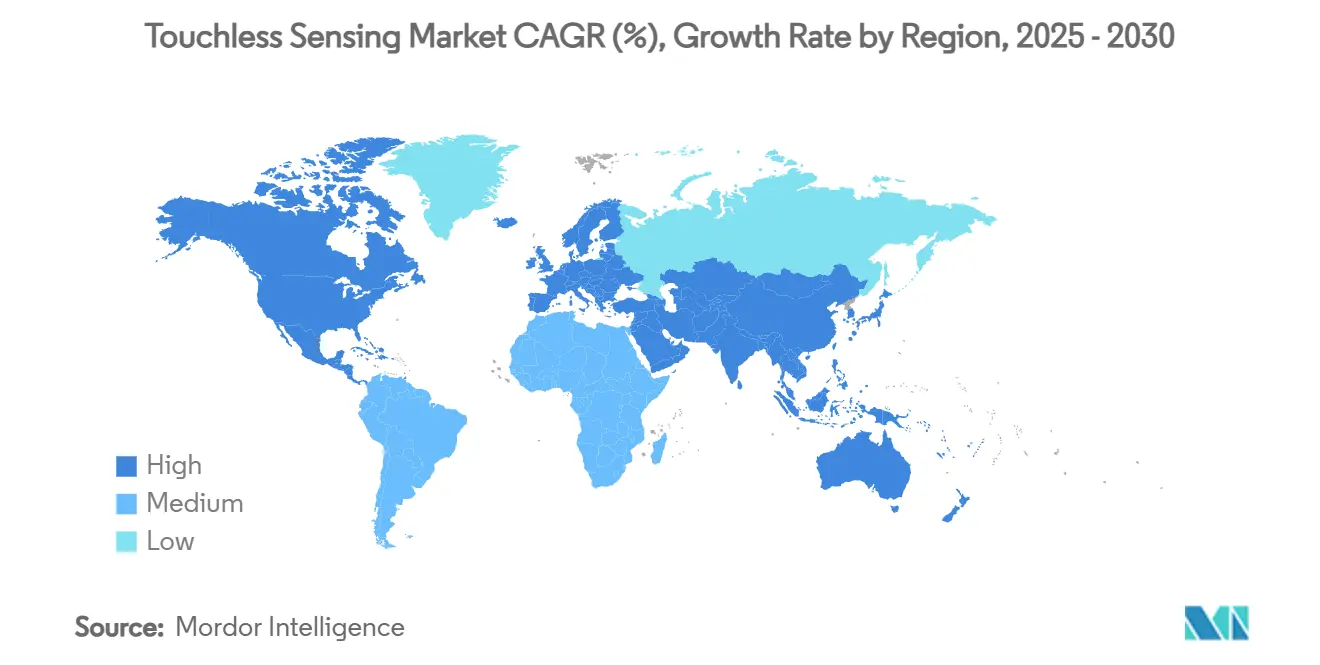
| Fastest Growing Market | Asia Pacific |
| Largest Market | Europe |
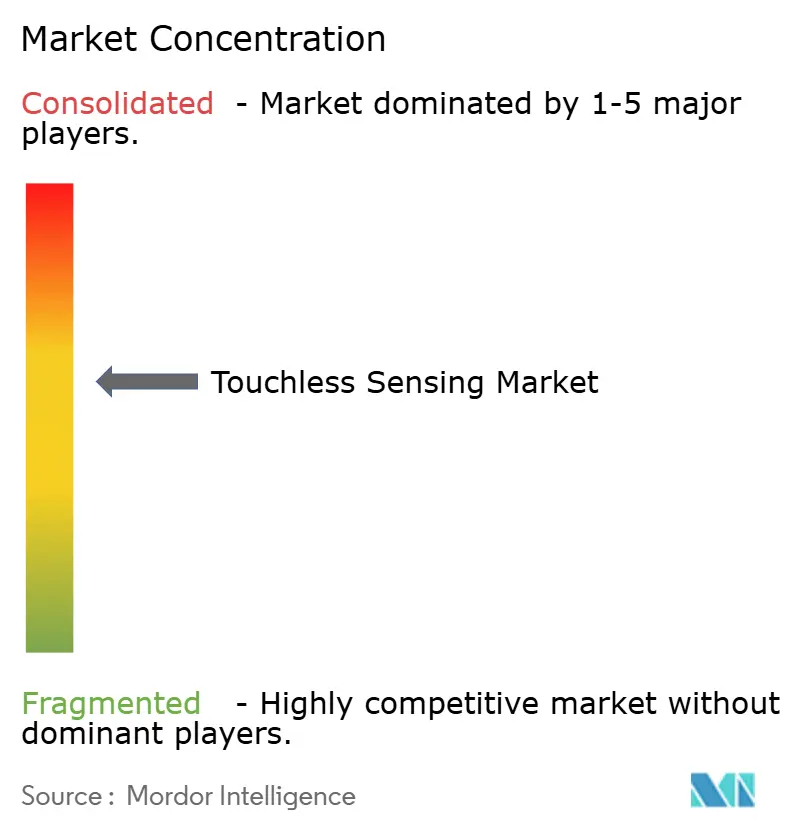
| Market Concentration | Medium |
Major Players *Disclaimer: Major Players sorted in no particular order Image © Mordor Intelligence. Reuse requires attribution under CC BY 4.0. | |
Touchless Sensing Market Analysis by Mordor Intelligence
The touchless sensing market size stands at USD 11.92 billion in 2025 and is projected to grow to USD 23.19 billion by 2030, advancing at a 14.24% CAGR. Demand accelerates as public hygiene expectations remain elevated, vehicles migrate to software-defined cockpits, and AI-driven sensor fusion lifts recognition accuracy. Infrared and ultrasound arrays retain dominance because they are power-efficient and mature, yet 3D time-of-flight cameras are scaling rapidly as semiconductor process nodes improve depth resolution. Europe holds the largest regional position due to strict privacy rules and an advanced automotive base, while APAC delivers the fastest unit growth on the back of consumer-electronics manufacturing clusters. Hardware continues to command most spending, but the value narrative is tilting toward on-device algorithms that turn raw signals into context-aware experiences.
Key Report Takeaways
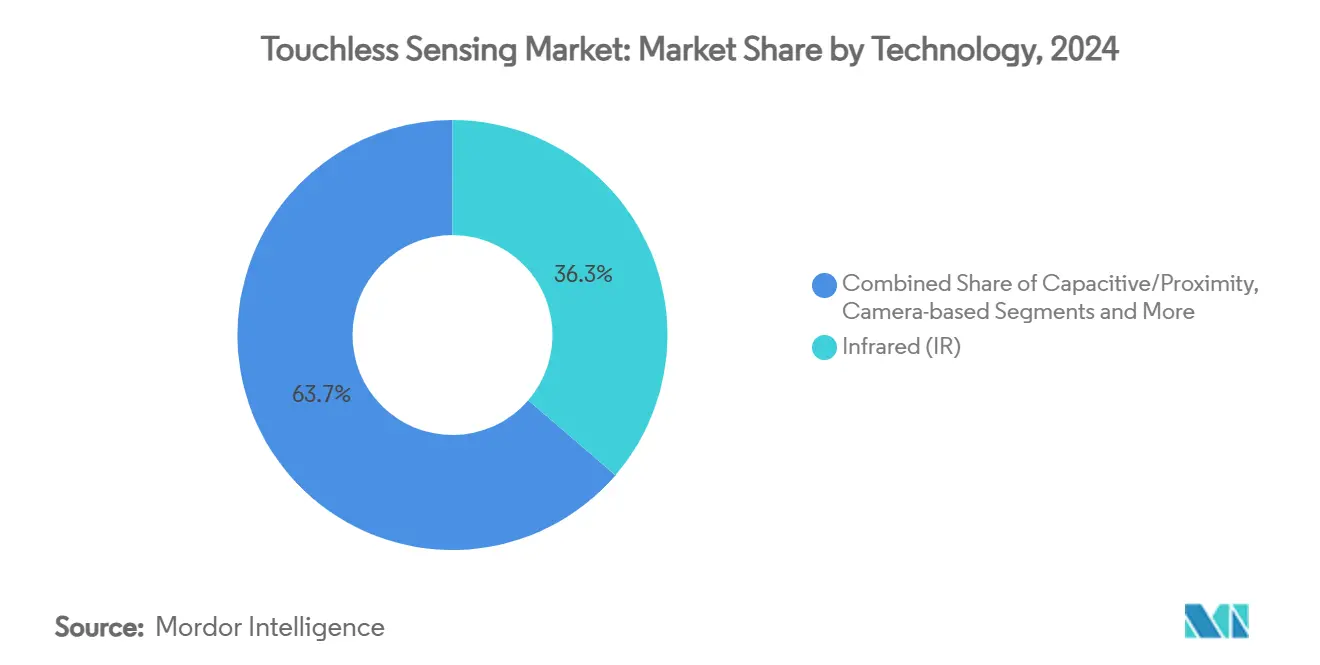
- By technology, infrared led with 36.3% revenue share in 2024, while 3D time-of-flight cameras are expanding at a 15.4% CAGR to 2030.
- By product type, biometric devices held 38.4% of the touchless sensing market share in 2024, whereas gesture-recognition controllers are projected to grow at 15.9% through 2030.
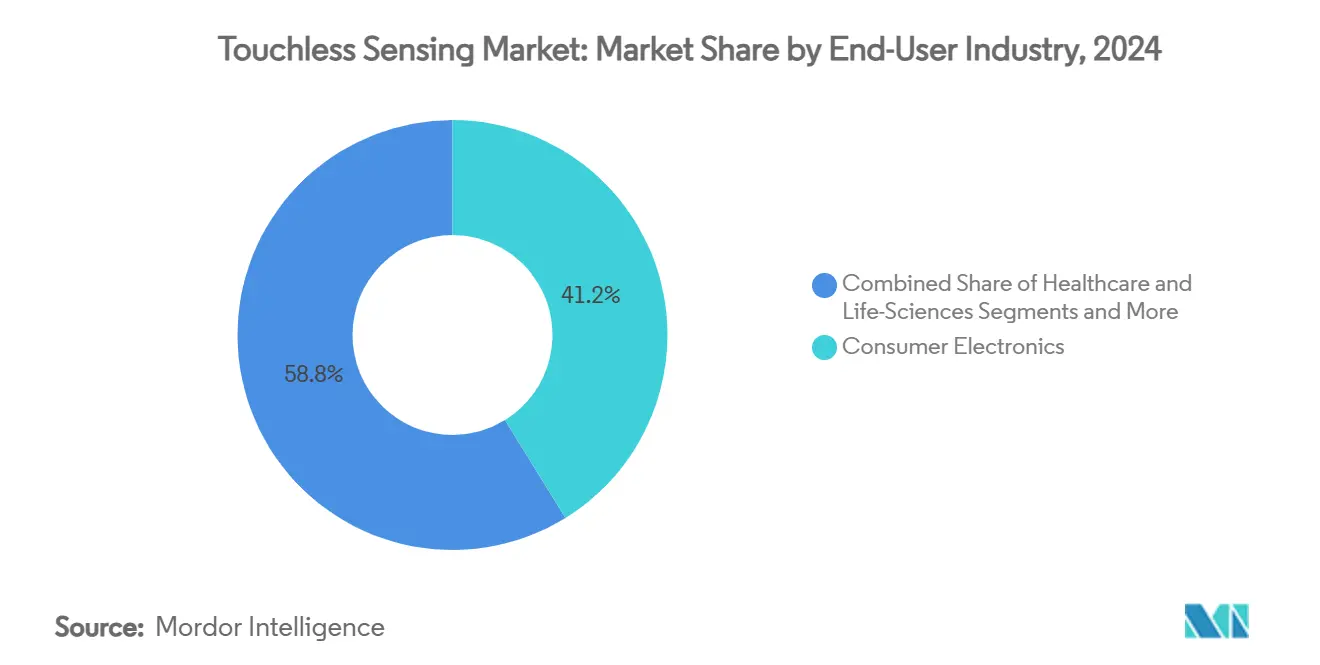
- By end-user industry, consumer electronics accounted for 41.2% of the touchless sensing market size in 2024, and automotive applications are forecast to progress at a 15.2% CAGR over the same horizon.
- By component, hardware contributed 82.1% of 2024 revenue, but software is rising at a 14.8% CAGR as AI moves to the edge.
- By geography, Europe commanded 29.5% global revenue in 2024, while APAC is on track for a 14.5% CAGR to 2030.
Global Touchless Sensing Market Trends and Insights
Drivers Impact Analysis*
| Driver | (~) % Impact on CAGR Forecast | Geographic Relevance | Impact Timeline |
|---|---|---|---|
| Growing hygiene-driven demand in public infrastructure | +2.1% | Global, with concentration in North America & Europe | Short term (≤ 2 years) |
| Surge in consumer-device OEM integration (smartphones, wearables) | +3.2% | APAC core, spill-over to North America | Medium term (2-4 years) |
| Automotive ADAS shift to in-cabin gesture control | +2.8% | Europe & North America, expanding to APAC | Medium term (2-4 years) |
| Rapid adoption of zero-UI kiosks in BFSI and retail | +1.9% | Global, with early gains in developed markets | Short term (≤ 2 years) |
| AI-enhanced multimodal sensor fusion improving accuracy | +2.7% | North America & Europe, technology transfer to APAC | Long term (≥ 4 years) |
| Emerging soft-robotics use-cases for capacitive proximity sensing | +1.5% | Industrial clusters in Germany, Japan, South Korea | Long term (≥ 4 years) |
| Source: Mordor Intelligence | |||
Growing Hygiene-Driven Demand in Public Infrastructure
Public transit stations, hospitals, and government offices have re-engineered user flows to minimize shared-surface contact. Ticketing kiosks now rely on proximity or gesture commands, and hospital triage stations read vital signs without physical probes. Infrared and ultrasonic modules are favored because they retrofit easily into existing housings, letting operators raise safety standards without tearing out legacy systems. Municipal procurement guidelines increasingly rank touchless functions as mandatory, securing multiyear demand visibility. This structural shift positions hygiene compliance as a baseline design assumption rather than a premium feature.
Surge in Consumer-Device OEM Integration
Smartphone, tablet, and wearable brands embed proximity and gesture layers directly under display glass, cutting bill-of-materials while adding differentiating use cases such as hover scrolling and sign-language input.[1]ams-OSRAM, “In-Plane Sensing in MicroLED Displays,” ams-osram.comMicroLED panels can now detect both macro hand waves and micro cardiovascular pulses from the same photodiode grid, compressing components and battery load. Volume shipments from APAC fabs drive sensor ASPs lower, enabling mid-tier models to adopt functions once found only in flagships. As ecosystems mature, developers gain standard APIs that accelerate app-level innovation, feeding a virtuous cycle of adoption.
Automotive ADAS Shift to In-Cabin Gesture Control
Regulators mandate driver-monitoring systems for L2+ autonomy, and OEMs are turning to gesture, gaze, and biometric fusion to satisfy safety tests without cluttering dashboards. Laser beam scanning modules co-developed by Infineon and Marelli project adaptive UIs onto any cockpit surface, freeing designers from fixed screens. Tier-1 suppliers package radar, infrared, and camera sensors behind common housings, simplifying vehicle platforms across trims. As these systems migrate from luxury sedans into mass-segment vehicles, annual unit volumes rise sharply, underpinning the double-digit growth outlook for automotive deployments.
AI-Enhanced Multimodal Sensor Fusion Improving Accuracy
Edge AI chips combine data from infrared, ultrasound, capacitive, and visual streams to anticipate user intent instead of merely reacting to discrete triggers. Synaptics’ Astra silicon runs transformer models locally, removing cloud latency and shrinking privacy attack surfaces. In industrial plants, sensor fusion counteracts electromagnetic interference that would cripple single-channel designs. Software updates unlock new gesture vocabularies post-install, turning hardware into a long-lived platform rather than a fixed-function asset, which improves lifetime ROI for buyers.
Restraints Impact Analysis*
| Restraint | (~) % Impact on CAGR Forecast | Geographic Relevance | Impact Timeline |
|---|---|---|---|
| High switchover and retro-fit costs for legacy systems | -1.8% | Global, particularly affecting SMEs in developed markets | Medium term (2-4 years) |
| End-user privacy / surveillance concerns | -2.3% | Europe & North America, with GDPR/CCPA compliance requirements | Short term (≤ 2 years) |
| Signal-to-noise degradation in high-EMI industrial settings | -1.2% | Industrial manufacturing hubs globally | Medium term (2-4 years) |
| Fragmented standards slowing cross-vendor interoperability | -0.9% | Global, with particular impact on enterprise deployments | Long term (≥ 4 years) |
| Source: Mordor Intelligence | |||
High Switchover and Retrofit Costs for Legacy Systems
Older factories, airports, and office blocks use fieldbus or serial links that cannot transmit the high-bandwidth data that touchless sensors generate. [2]Álvaro García, Anibal Bregon, and M J Martinez, “A Non-Intrusive Industry 4.0 Retrofitting Approach,” ncbi.nlm.nih.gov Upgrading means rewiring cabinets, validating safety certificates, and retraining staff, which can triple project budgets relative to greenfield builds. Wireless sensor hubs and pre-calibrated retrofit kits are emerging, yet price-sensitive SMEs still defer purchases until clear paybacks appear. Financing models that roll hardware, software, and services into monthly subscriptions aim to mitigate capex barriers.
End-User Privacy / Surveillance Concerns
Facial templates, palm veins, and gait signatures are immutable identifiers; if leaked, they cannot be revoked. European data-protection law, therefore, demands explicit consent, on-device encryption, and minimal retention windows. Compliance adds processing overhead and prolongs certification cycles, especially for multinationals that must harmonize rules across regions. Edge analytics that hash biometric vectors before inference, coupled with user-controlled opt-in dashboards, are gaining traction as pragmatic safeguards, but the policy landscape remains fluid.
*Our forecasts treat driver/restraint impacts as directional, not additive. The impact forecasts reflect baseline growth, mix effects, and variable interactions.
Segment Analysis
By Technology: IR/Ultrasound Dominance Faces 3D Disruption
Infrared modules accounted for 36.3% revenue in 2024, reflecting their low power draw and immunity to ambient-light noise. They anchor entry-level hand-sanitizer dispensers and rugged industrial panels where reliability trumps sophistication. The segment’s share will moderate as 3D time-of-flight cameras climb a 15.4% CAGR curve, buoyed by falling VCSEL costs and better depth algorithms. 3D cameras offer sub-millimeter precision, enabling air-writing or pulse measurement without contact. Hybrid boards that package IR proximity, ToF depth, and mm-wave radar on the same flex are appearing in premium laptops, illustrating an emerging multimodal norm.
Second-generation capacitive surfaces keep pace in smartphones because they coexist with existing touch controllers, letting OEMs introduce hover gestures without mechanical redesign. Meanwhile, RFID and NFC stay niche, serving high-security access gates where cryptographic authentication outweighs gesture freedom. Over the forecast, AI firmware will orchestrate signals from diverse sensors, turning hardware heterogeneity into a competitive edge rather than an integration headache. The touchless sensing market size for hybrid technology stacks is projected to grow fastest, reshaping vendor roadmaps.


By Product Type: Biometric Leadership Challenged by Gesture Innovation
Biometric terminals generated 38.4% of 2024 spending as banks, airports, and offices sought frictionless yet secure access. Fingerprint readers are migrating from capacitive plates to optical-under-display designs in vehicles, complementing face unlock modules that work through tinted glass. However, gesture-recognition controllers are scaling at 15.9% because they address infotainment, gaming, and smart-home scenes where identity is less critical, but convenience is paramount.
Sanitary equipment remains steady: faucets, dispensers, and dryers tap proven IR beams that trigger without latency, a key metric for public restrooms. Interactive kiosks rebounded in retail as shops deployed zero-contact catalog browsers that cut cleaning labor. Emerging “soft robotics” grippers integrate capacitive proximity pads, a crossover product that blurs safety sensors with motion control. As these categories converge, suppliers bundle SDKs that span biometrics and gestures, positioning portfolios for a platform era.
By End-User Industry: Consumer Electronics Scale Versus Automotive Innovation
Smartphones, wearables, and AR headsets delivered 41.2% of 2024 revenue by leveraging vast production capacity and rapid refresh cycles. Hover scrolling, air-tap input, and health sensing unite inside the same module, improving stickiness without raising device thickness. Automotive makers, though smaller in volume, post a 15.2% CAGR because each vehicle carries multiple sensors—from overhead consoles to seat frames—and functional-safety grades lift ASPs.
Healthcare adopts radar and infrared vitals monitors that keep infection zones sterile, while BFSI branches deploy gesture ATMs to cut surface cleaning costs. Warehouses integrate proximity shells around collaborative robots, letting humans and machines share aisles safely.[3]Advantech, “Autonomous Mobile Robots (AMR): Technology and Applications,” advantech.comAs verticals intersect, cross-industry standards such as ISO/IEC 30145 emerge, promising interoperability and scale efficiencies. The touchless sensing market share held by automotive is set to widen as L3 autonomy approaches production, while consumer electronics will maintain volume leadership.
By Component: Hardware Foundation Supports Software Innovation
Hardware contributed 82.1% of 2024 turnover because silicon, optics, and RF assemblies remain capital-intensive. Yet software revenues rise 14.8% annually as edge AI models become the clear performance differentiator. Vendors pre-train gesture networks and license inference engines per device, creating recurring revenue layers atop one-time sensor sales.
Services, though still modest, expand as enterprises outsource regulatory assessments, algorithm tuning, and fleet-level over-the-air updates. The touchless sensing market size for software-and-services bundles is forecast to double by 2030, narrowing the hardware-only premium. Open-source stacks such as Synaptics’ Astra toolkit evolve quickly, letting integrators customize gestures without deep ML expertise, further tilting value toward code.
Geography Analysis
Europe generated the largest revenue slice at 29.5% in 2024, helped by cohesive GDPR guidance that gives integrators a clear compliance playbook and by a concentrated premium-automotive sector that pilots in-cabin innovation. The region channels public funds into smart-infrastructure retrofits, installing gesture elevators and contactless ticket validators across rail networks. Nordic healthcare systems pioneered radar vitals monitoring, and those pilots now cascade into broader EU deployments.
North America ranks second, with healthcare and financial services operators adopting touchless interfaces to trim liability from surface-borne pathogens. Data-privacy rules like CCPA are less prescriptive than GDPR yet still demand encryption-at-rest and opt-in prompts, spurring edge-analytics adoption. Silicon Valley fabless firms partner with Tier-1 contract manufacturers in Mexico, shortening supply chains and speeding updates, a factor that sustains market momentum.
APAC is the growth engine, expanding at a 14.5% CAGR as Chinese, Korean, and Japanese OEMs bundle touchless sensing into mainstream phones and cars. Government incentives for Industry 4.0 in Southeast Asia seed factory automation projects prefer proximity sensors over light curtains. India’s transit authorities issue tenders for gesture-ticketing gates in new metro lines, signalling potential scale. The touchless sensing market size across India and ASEAN is expected to reach mid-single-digit billions by 2030, although per-unit ASPs remain lower than in developed regions, driving vendors to optimize bills of material aggressively.

Competitive Landscape
The field remains moderately fragmented. Three leading chip makers—Infineon, Microchip, and ams-OSRAM—supply depth-sensor arrays, radar front ends, and VCSEL drivers at scale. Their wafer fabs, IP portfolios, and automotive safety certifications erect high entry barriers. Mid-tier specialists such as Ultraleap and Elliptic Labs differentiate through gesture algorithms that run on general-purpose DSPs rather than dedicated ASICs. Start-ups in neural interfaces, exemplified by Wisear, attack future AR/VR endpoints with brain-signal controls that could leapfrog hand gestures entirely.
Competition is shifting from hardware counts to software performance. As sensor ASPs compress, value accrues to firmware that maintains accuracy across lighting, EMI, and cultural gesture sets. Patent filings concentrate on multimodal fusion and privacy-preserving inference. Larger vendors respond by acquiring algorithm houses to secure end-to-end stacks; for instance, Infineon’s creation of its SURF unit pools RF, radar, and sensor staff under a single P&L, easing cross-domain roadmaps.
Strategic alliances grow: Infineon-Marelli’s MEMS laser project reimagines cockpit human-machine interfaces; Elliptic Labs optimizes its AI suite for Ceva’s NeuPro-Nano NPU to reach IoT edges with minimal power. Open platforms such as Qualcomm’s Snapdragon Digital Chassis court Tier-1s by offering a complete OS, safety layers, and AI accelerators. These moves foreshadow a consolidation wave in which companies bundle silicon, software, and reference designs to deliver certified subsystems instead of discrete parts.
Touchless Sensing Industry Leaders
Infineon Technologies AG
Microchip Technology Inc.
ams-OSRAM AG
Synaptics Incorporated
STMicroelectronics N.V.
- *Disclaimer: Major Players sorted in no particular order

Recent Industry Developments
- June 2025: Elliptic Labs optimized its AI platform for Ceva’s NeuPro-Nano NPU, enhancing gesture recognition on resource-constrained devices.
- May 2025: Wearable Devices secured a patent covering neural pinch-to-zoom gestures for AR and smart devices.
- April 2025: Infineon and Marelli partnered on MEMS laser beam scanning modules for immersive automotive cockpit.
- January 2025: Qualcomm expanded its Snapdragon Digital Chassis to add AI-powered in-cabin sensing and Smart Home 2.0 features.


Global Touchless Sensing Market Report Scope
| Infrared (IR) |
| Ultrasound |
| Capacitive / Proximity |
| Camera-based (2D/3D ToF, Structured-light) |
| RFID / NFC |
| Touchless Biometric Devices |
| Gesture-Recognition Controllers |
| Sanitary Equipment (faucets, dispensers, dryers) |
| Interactive Kiosks / Screens |
| Consumer Electronics |
| Healthcare and Life-Sciences |
| Automotive and Transportation |
| BFSI and Retail |
| Industrial and Logistics |
| Hardware | Software |
| Services |
| North America | United States | |
| Canada | ||
| Mexico | ||
| South America | Brazil | |
| Argentina | ||
| Rest of South America | ||
| Europe | Germany | |
| United Kingdom | ||
| France | ||
| Italy | ||
| Spain | ||
| Russia | ||
| Rest of Europe | ||
| Asia-Pacific | China | |
| Japan | ||
| India | ||
| South Korea | ||
| Australia | ||
| Rest of Asia-Pacific | ||
| Middle East and Africa | Middle East | United Arab Emirates |
| Saudi Arabia | ||
| Turkey | ||
| Israel | ||
| Rest of Middle East | ||
| Africa | South Africa | |
| Nigeria | ||
| Egypt | ||
| Rest of Africa | ||
| By Technology | Infrared (IR) | ||
| Ultrasound | |||
| Capacitive / Proximity | |||
| Camera-based (2D/3D ToF, Structured-light) | |||
| RFID / NFC | |||
| By Product Type | Touchless Biometric Devices | ||
| Gesture-Recognition Controllers | |||
| Sanitary Equipment (faucets, dispensers, dryers) | |||
| Interactive Kiosks / Screens | |||
| By End-user Industry | Consumer Electronics | ||
| Healthcare and Life-Sciences | |||
| Automotive and Transportation | |||
| BFSI and Retail | |||
| Industrial and Logistics | |||
| By Component | Hardware | Software | |
| Services | |||
| By Geography | North America | United States | |
| Canada | |||
| Mexico | |||
| South America | Brazil | ||
| Argentina | |||
| Rest of South America | |||
| Europe | Germany | ||
| United Kingdom | |||
| France | |||
| Italy | |||
| Spain | |||
| Russia | |||
| Rest of Europe | |||
| Asia-Pacific | China | ||
| Japan | |||
| India | |||
| South Korea | |||
| Australia | |||
| Rest of Asia-Pacific | |||
| Middle East and Africa | Middle East | United Arab Emirates | |
| Saudi Arabia | |||
| Turkey | |||
| Israel | |||
| Rest of Middle East | |||
| Africa | South Africa | ||
| Nigeria | |||
| Egypt | |||
| Rest of Africa | |||


Key Questions Answered in the Report
What is driving the rapid growth of the touchless sensing market?
Elevated hygiene standards, automotive cockpit digitization, and AI-enabled sensor fusion together push the market along a 14.24% CAGR to 2030.
Which technology holds the largest share in 2025?
Infrared sensors still lead with 36.3% revenue share because they deliver low-power, robust performance in diverse settings.
How fast is the automotive segment expanding?
Automotive and transportation deployments are advancing at 15.2% CAGR as in-cabin gesture control becomes integral to driver-monitoring mandates.
Why is Europe the largest regional market?
Strict data-privacy rules and a high-end automotive manufacturing base spur early adoption of safety-certified touchless interfaces across the continent.
What are the main barriers to wider deployment?
High retrofit costs for legacy infrastructure and persistent privacy concerns around biometric data each shave more than 1.5 percentage points off the forecast CAGR.
How will hardware and software revenues evolve?
Hardware remains the bulk of spending today, yet software is growing at 14.8% CAGR as edge-AI algorithms emerge as the primary value lever in differentiated offerings.
Page last updated on:


