Contactless Biometrics Technology Market Size and Share
Market Overview
| Study Period | 2020 - 2031 |
|---|---|
| Market Size (2026) | USD 22.58 Billion |
| Market Size (2031) | USD 42.75 Billion |
| Growth Rate (2026 - 2031) | 13.63% CAGR |
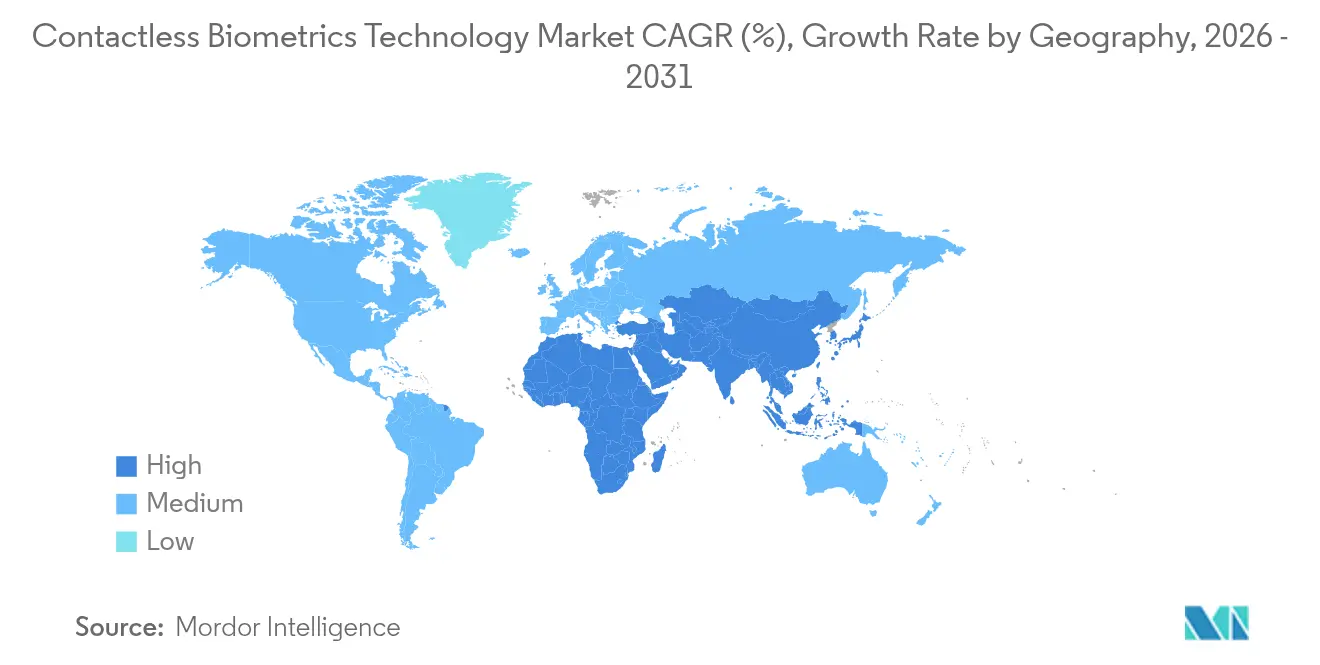
| Fastest Growing Market | Asia Pacific |
| Largest Market | North America |
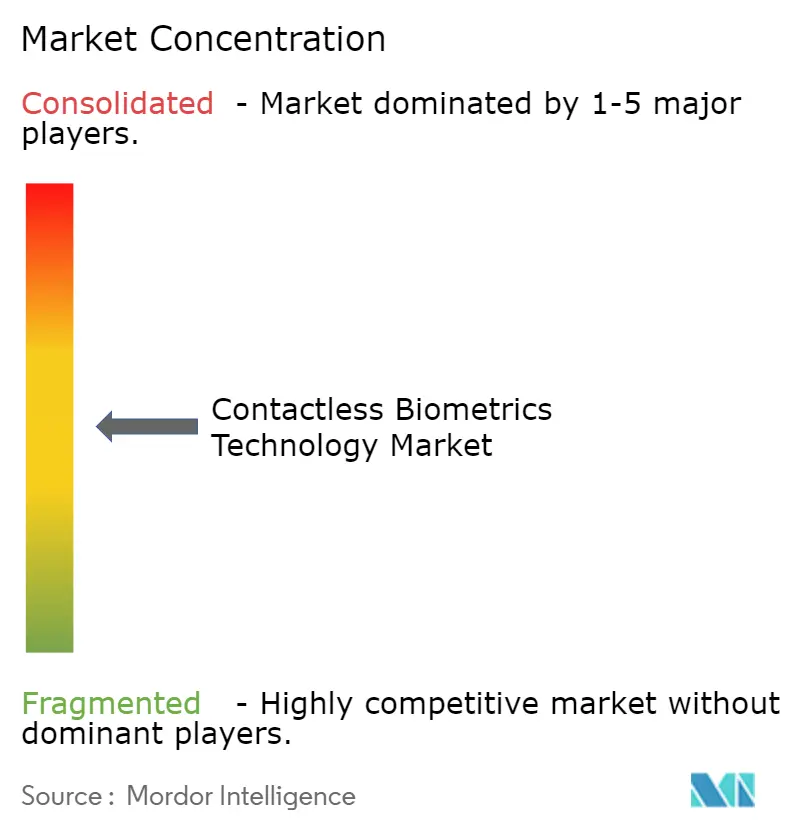
| Market Concentration | Medium |
Major Players *Disclaimer: Major Players sorted in no particular order Image © Mordor Intelligence. Reuse requires attribution under CC BY 4.0. | |
Contactless Biometrics Technology Market Analysis by Mordor Intelligence
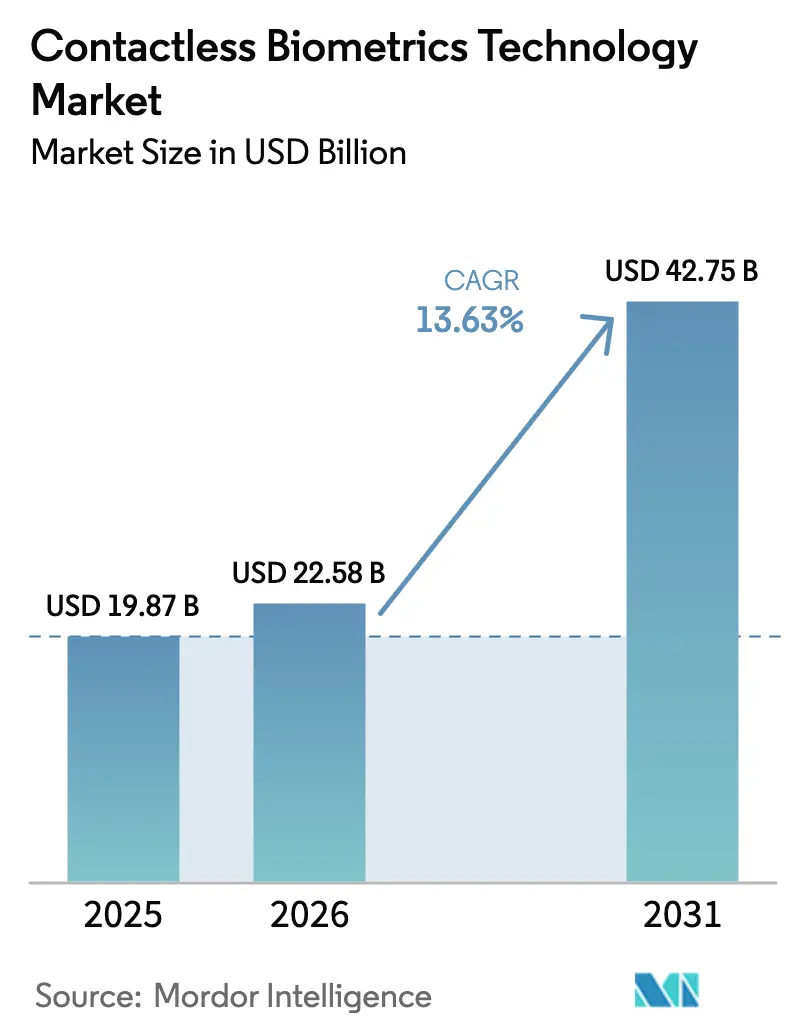
The Contactless Biometrics Technology market size is expected to grow from USD 19.87 billion in 2025 to USD 22.58 billion in 2026 and is forecast to reach USD 42.75 billion by 2031 at 13.63% CAGR over 2026-2031. This growth reflects the decisive migration from touch-based checks to touch-free authentication across public services, finance, healthcare, and enterprise facilities. Government-funded digital-ID programs, mandates for biometric payment cards, and AI-enabled edge cameras are converging to accelerate deployments. Vendors that can pair high-accuracy algorithms with ruggedized sensors are widening adoption in open, high-traffic settings. At the same time, tightening privacy rules in Europe, hardware cost pressures in outdoor iris systems, and persistent deep-fake threats require vendors to align innovation with strict governance frameworks.
Key Report Takeaways
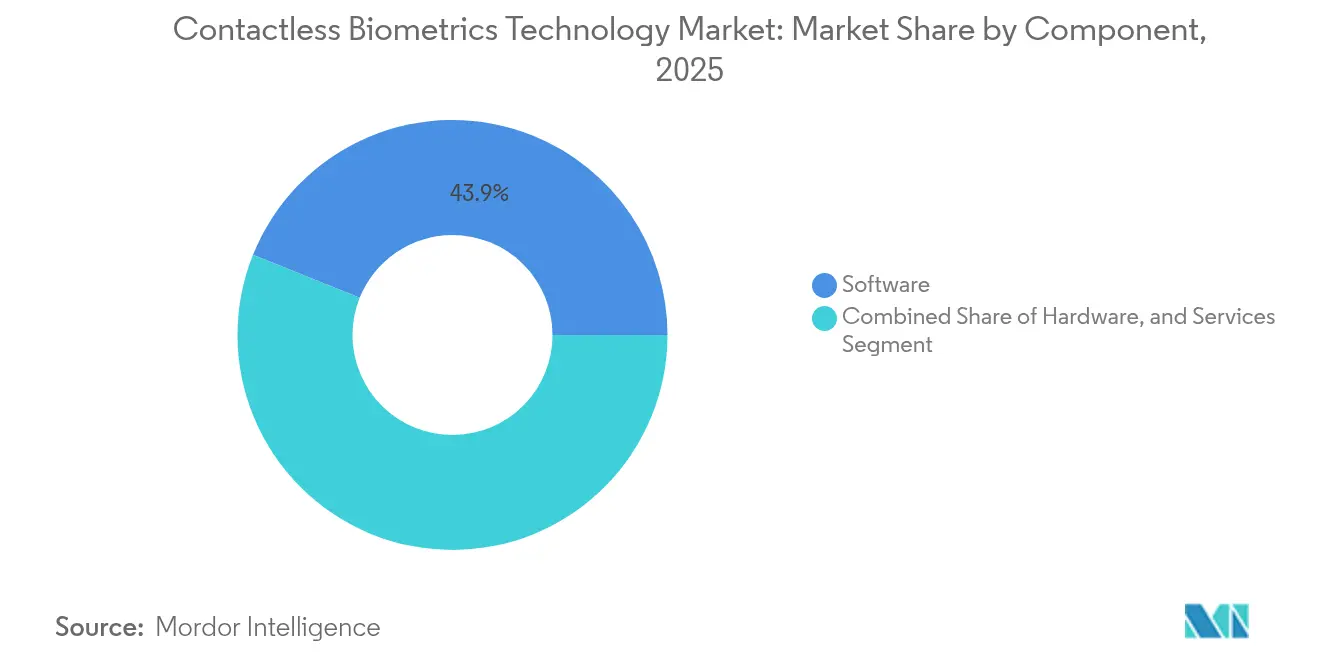
- By component, software led with 43.92% revenue share in 2025, whereas services are projected to expand at 14.98% CAGR through 2031.
- By technology, face recognition captured 37.25% of Contactless Biometrics Technology market share in 2025; iris recognition is forecast to grow the fastest at 16.62% CAGR.
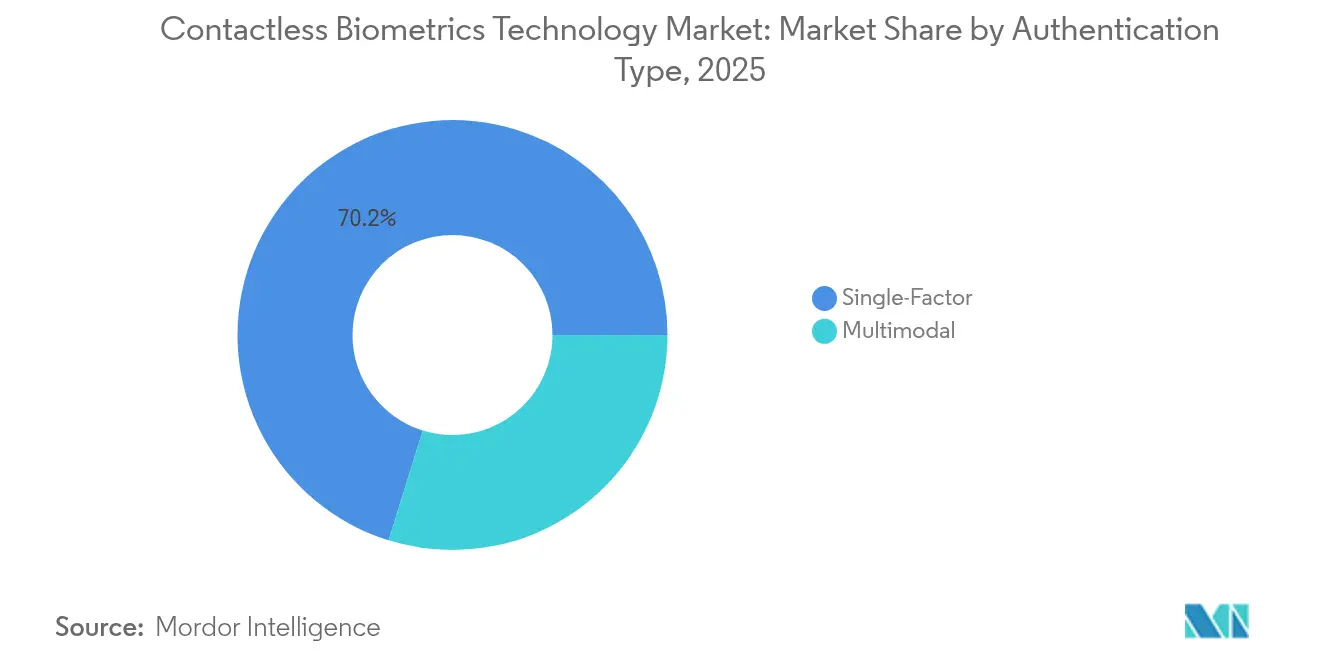
- By authentication type, single-factor solutions held 70.20% of the Contactless Biometrics Technology market in 2025, while multimodal approaches are advancing at 18.74% CAGR.
- By end-user industry, government and public sector commanded 29.58% share of the Contactless Biometrics Technology market size in 2025; healthcare and life sciences are projected to expand at 16.13% CAGR to 2031.
- By geography, North America led with 30.15% revenue share in 2025, whereas Asia Pacific records the highest forecast CAGR at 14.35%.
Note: Market size and forecast figures in this report are generated using Mordor Intelligence’s proprietary estimation framework, updated with the latest available data and insights as of 2026.
Global Contactless Biometrics Technology Market Trends and Insights
Drivers Impact Analysis*
| Driver | (~) % Impact on CAGR Forecast | Geographic Relevance | Impact Timeline |
|---|---|---|---|
| Accelerating National Digital-ID Programs in Asia | +3.2% | Asia Pacific, with spillover to Middle East & Africa | Medium term (2-4 years) |
| Post-Covid Hygiene-Driven Shift to Touch-Free Security in Europe | +2.5% | Europe, North America | Short term (≤ 2 years) |
| Payment-Card OEM Mandates for Embedded Biometrics in North America | +2.1% | North America, Europe | Medium term (2-4 years) |
| Cloud-Based Biometric-as-a-Service Adoption by Mid-Sized Enterprises | +1.8% | Global | Medium term (2-4 years) |
| AI-Enhanced Edge Cameras Enabling "Walk-Through" Authentication | +1.6% | North America, Europe, Asia Pacific | Long term (≥ 4 years) |
| Border-Control e-Gates Roll-Out Across GCC Airports | +1.4% | Middle East, with spillover to Europe and Asia Pacific | Medium term (2-4 years) |
| Source: Mordor Intelligence | |||
Accelerating National Digital-ID Programs in Asia
Asia’s public agencies are deploying nation-scale biometric IDs that link citizens to health, tax, and welfare systems. India’s Aadhaar, Indonesia’s Dukcapil, and Singapore’s Singpass rely on standardized facial and iris templates defined in ISO/IEC 19794-5.[1]FIDO Alliance, “Passkeys and the Future of Authentication,” fidoalliance.org These repositories form trusted pipes that banks and telecom operators use to verify customers in seconds, lifting fraud barriers for e-commerce and remittances. Local IT firms integrate edge cameras in kiosks that match live faces to stored hashes, cutting on-boarding time by 60%. The resulting critical mass of enrolled profiles unlocks cross-sector use cases and moves the Contactless Biometrics Technology market from pilot status to essential infrastructure.
Post-Covid Hygiene-Driven Shift to Touch-Free Security in Europe
European employers replaced shared fingerprint readers with contactless terminals during the pandemic. Surveys by the World Health Organization show reduced transmission risks when users avoid surface contact.[2]Smart Payment Association, “Biometric Payment Cards – Market Trends and Workstreams,” smartpaymentassociation.com Airports in Germany and Spain now gate passengers through facial recognition lanes that cut queue times by 40%. Companies retain these systems for throughput gains and lower maintenance, keeping antiviral concerns as a secondary benefit. Users trained on touch-free IDs at work increasingly expect the same convenience at retail and stadium entrances, creating a pull effect that lifts the Contactless Biometrics Technology market across unrelated verticals.
Payment-Card OEM Mandates for Embedded Biometrics in North America
Major card issuers are phasing in fingerprint sensors on dual-interface credit cards to curb contactless payment fraud. The Smart Payment Association estimates 15% penetration of biometric cards by 2027.[3]NEC Corporation, “Iris Recognition: Biometric Authentication,” nec.com Match-on-card architecture keeps templates inside secure elements, satisfying privacy auditors while cutting declined transactions. Fingerprint Cards AB reports fraud reductions exceeding 60% on live pilots. Because the payment card is a familiar object, consumers accept biometric checks without seeing them as intrusive, accelerating mainstream adoption well beyond high-security sites.
Cloud-Based Biometric-as-a-Service Adoption by Mid-Sized Enterprises
Software-as-a-service platforms hosted on ISO 27001-certified clouds offer enrollment, liveness analysis, and template management under monthly fees. The FIDO Alliance confirms that turnkey APIs cut deployment times for smaller banks from months to days.[4]World Health Organization, “Recommendations on contactless technologies and disease mitigation,” who.int Continuous software updates shield clients from algorithm bias drift and spoofing vectors that arise after initial rollout. Subscription models convert capex to opex, allowing resource-constrained firms to achieve enterprise-grade verification without specialist staff, expanding the Contactless Biometrics Technology market into long-tail customer segments.
Restraints Impact Analysis*
| Restraint | (~) % Impact on CAGR Forecast | Geographic Relevance | Impact Timeline |
|---|---|---|---|
| Cross-Jurisdictional Data-Sovereignty Conflicts | -1.7% | Europe, Asia Pacific | Medium term (2-4 years) |
| High Infrared Camera Costs in Outdoor Iris Systems | -1.2% | Global | Short term (≤ 2 years) |
| Deep-Fake Spoofing Risks for Passive Face Recognition | -1.0% | Global | Medium term (2-4 years) |
| Public Push-Back Against Biometric Surveillance in EU Nordics | -0.8% | Europe, with spillover to North America | Medium term (2-4 years) |
| Source: Mordor Intelligence | |||
Cross-Jurisdictional Data-Sovereignty Conflicts
GDPR treats biometric templates as highly sensitive personal data, forcing firms to store records inside the EU and secure explicit consent for every reuse. Multinational retailers running loyalty apps in both Europe and ASEAN must split databases, replicate encryption keys, and adjust retention periods, raising compliance overhead by 50%. Asian regulators add local twists such as on-shore processing mandates. The patchwork stalls unified rollouts and dilutes economies of scale, trimming expected gains in the Contactless Biometrics Technology market until harmonized frameworks emerge.
High Infrared Camera Costs in Outdoor Iris Systems
Outdoor iris capture needs dual-wavelength IR illumination, weatherproof housings, and adaptive optics. These assemblies can cost triple the price of indoor units, according to vendor disclosures from NEC Corporation.[5]International Organization for Standardization, “ISO/IEC 19794-5:2011 Information technology – Biometric data interchange formats – Part 5: Face image data,” iso.org Transport hubs and oil-rig checkpoints with variable sunlight face budget barriers, opting instead for face or palm vein scanners that trade a modest hit in accuracy for lower unit costs. As bulk component prices fall, iris systems should rebound, but the short-run capex premium slows deployment trajectories in critical infrastructure settings
*Our forecasts treat driver/restraint impacts as directional, not additive. The impact forecasts reflect baseline growth, mix effects, and variable interactions.
Segment Analysis
By Component: Software Dominates Authentication Ecosystem
Software captured 43.92% revenue in 2025, reinforcing its role as the intelligence core of every modern platform. Biometric SDKs stitch together liveness detection, AI-driven matching, and adaptive thresholding that updates in real time. Vendors feed models with anonymized edge data, refining classifiers that now flag spoof attempts with 98% precision. Services, though smaller today, are rising at a 14.98% CAGR as managed solutions bundle hosting, compliance, and analytics into one contract. Mid-size clinics subscribe to cloud dashboards that highlight duplicate patient records and alert staff when two users share overlapping vitals.
Hardware revenue continues to grow yet margins erode as camera modules and time-of-flight sensors commoditize. To stand out, suppliers add multispectral liveness LEDs and wide-angel optics that operate in glare. Miniaturization milestones allow sub-200-micron fingerprint sensors to embed inside smart-card laminates without thickening the card. These incremental gains keep devices relevant, but the bulk of differentiation-and future profit pools-remains in algorithms and managed orchestration, the heart of the Contactless Biometrics Technology market.


By Technology: Face Recognition Leads, Iris Accelerates
Face recognition delivered 37.25% of 2025 revenue on the strengths of distance capture and user familiarity. Airlines deploy ceiling-mounted 3D cameras that verify a moving subject against a gallery in under two seconds. Depth sensing and thermal mapping raise spoof-resistance, while consent banners and local template storage address privacy critics. Meanwhile, iris systems expand at a 16.62% CAGR as costs fall and algorithms perform under diffuse lighting. Hospitals favor iris for its 1-in-1-million false match probability, protecting medication dispensing and newborn ID chains.
Palm vein and contactless fingerprint options meet use cases where gloves or cultural norms hinder facial exposure. Voice recognition tags into call-center fraud defenses that work over low-bandwidth links. Each niche strengthens the overall Contactless Biometrics Technology market by matching modality to context rather than forcing one technology to fit all.
By Authentication Type: Single-Factor Dominates, Multimodal Surges
Single-factor solutions own 70.20% of installations owing to quick adoption cycles and lower integration fees. Retail kiosks authenticate with just face images, a setup deployable in weeks without legacy system rewiring. Continuous algorithm tuning lifts single-factor accuracy, yet residual spoof gaps persist for high-value transactions. Multimodal deployments that combine face and iris or palm and voice cut false accept rates to 0.0001%, a level critical for border control and corporate vault access, and NEC's tablet-grade infrared-RGB combo sensor performs dual checks in parallel, eliminating queue slowdowns while raising security baselines.
As component costs dip and cloud CPU cycles cheapen, multimodal suites migrate from marquee airports to regional hospitals and insurers, enlarging the Contactless Biometrics Technology market size for layered security offerings.
By End-User Industry: Government Leads, Healthcare Accelerates
Public agencies retained 29.58% revenue share in 2025 and anchor some of the largest databases on the planet. The U.S. FBI’s NGI platform now queries faces, irises, and palm prints in sub-second times at 99.6% accuracy. Border-control e-gates in the Gulf cooperate with EU entry-exit schemes, illustrating cross-regional template interoperability. Government rollouts set standards and acclimate citizens to biometrics, clearing pathways for commercial spin-offs that fortify the Contactless Biometrics Technology market.
Healthcare, advancing at 16.13% CAGR, battles patient misidentification that causes avoidable clinical errors. Studies in Journal of Healthcare Engineering link biometric wristbands to 35% fewer medication mix-ups. Hospitals blend iris capture at check-in with facial re-authentication at bedside to stop identity swap fraud. Insurers tie claim processing to verified templates, shrinking duplicate record payouts. The push toward contact-free workflows and regulatory pressure for audit trails energize adoption through 2031.
Geography Analysis
North America generated 30.15% of 2025 revenue, propelled by early EMV card migration, federal transport projects, and mature cloud infrastructure. The Transportation Security Administration’s voluntary facial gates at Ronald Reagan Washington National Airport cut boarding time and showcase privacy-by-design blueprints that other agencies borrow. Regional banks integrate FIDO-based passkeys, enabling passwordless log-ins secured by on-device biometrics that never leave the handset. High disposable income supports rapid consumer upgrades, keeping the Contactless Biometrics Technology market in the region ahead on per-capita spend.
Asia Pacific will expand the fastest at a 14.35% CAGR, thanks to megaprojects in China, India, Japan, and the ASEAN bloc. Digitally native populations adopt facial scan payments via QR-enabled kiosks that post-process images at local data centers. National digital-ID frameworks leapfrog legacy documents, and smartphone saturation ensures that over 80% of adults hold compatible sensors. Vendors tailor outdoor iris cameras for humid climates, and 5G back-haul enables low-latency cloud verification, swelling the Contactless Biometrics Technology market size in the region over the forecast period.
Europe balances innovation with rigorous data protection. GDPR and upcoming AI rules restrict untargeted biometric surveillance but clear a path for consent-driven use. The UK’s new contactless border rules let registered citizens skip passport presentation via e-gate facial checks. Banks comply with Strong Customer Authentication by embedding face or voice factors in mobile apps. Vendors promote privacy-preserving techniques such as on-chip template encryption, aligning with regulators and sustaining steady market momentum despite tighter oversight.

Competitive Landscape
Market concentration is moderate. Thales Group, NEC Corporation, and IDEMIA secure national ID and airport contracts, leveraging decades of cryptography and sensor R&D. Their platforms integrate liveness AI and back-end orchestration, forming turnkey stacks that governments prefer. Yet specialized pure-plays-often spin-offs from university labs-push niche modalities like heartbeat signatures or gait analysis. These innovators file foundational patents, attracting acquisition bids from incumbents seeking to widen modality portfolios and maintain share in the Contactless Biometrics Technology market.
Strategic alliances proliferate. Camera OEMs bundle NEC’s cross-spectral matchers, while cloud hyperscalers court algorithm vendors to power biometric APIs for third-party developers. trinamiX, owned by BASF, embeds spectral-skin analysers behind OLED dashboards to monitor driver alertness, signaling cross-industry expansion. Device makers seek differentiators as commoditization looms, turning biometric add-ons into competitive moats.
Cloud-first vendors challenge heavyweight suites by undercutting on price and update cadence. They promise region-specific compliance modules that toggle retention policies on demand, enticing mid-market clients. The result is an ecosystem in flux, where capability gaps close quickly, but trusted reference deployments still command premium margins, ensuring that brand pedigree remains a deciding factor for mission-critical bids.
Contactless Biometrics Technology Industry Leaders
Aware, Inc.
BIO-key International, Inc.
Cognitec Systems
FaceFirst
Fingerprint Cards AB
- *Disclaimer: Major Players sorted in no particular order

Recent Industry Developments
- April 2025: IDEMIA Public Security demonstrated the IATA Contactless Travel Directory at Passenger Terminal Expo 2025, enabling airlines to verify travelers through fully biometric passenger journeys.
- April 2025: trinamiX unveiled the Invisible Biometric Sensing Display at Auto Shanghai 2025, integrating vital-sign monitoring behind OLED vehicle screens.
- March 2025: The UK Parliament approved amendments enabling passport-free facial recognition travel for British citizens on select lanes.
- February 2025: The Smart Payment Association published biometric card interoperability specifications and formed a dedicated working group to standardize enrollment.


Research Methodology Framework and Report Scope
Market Definitions and Key Coverage
Our study defines the contactless biometrics technology market as the total revenue generated worldwide from solutions that authenticate or verify a user through face, iris, contact-free fingerprint, palm or vein, voice, and multimodal algorithms that operate without any physical touch by the subject. Systems must rely on cameras, depth sensors, or RF/optical readers embedded in fixed, mobile, or cloud-hosted platforms.
Scope Exclusion: Devices that still require skin contact (traditional capacitive fingerprint scanners, hand geometry pads) or retrofit modules added to legacy contact systems are not counted.
Segmentation Overview
- By Component
- Hardware
- Software
- Services
- By Technology
- Face Recognition
- Iris Recognition
- Contactless Fingerprint Recognition
- Voice Recognition
- Palm and Vein Recognition
- Multimodal/Hybrid Recognition
- By Authentication Type
- Single-Factor
- Multimodal
- By End-User Industry
- Government and Public Sector
- BFSI
- Consumer Electronics
- Healthcare and Life Sciences
- Transport and Logistics
- Defense and Security
- Retail and E-commerce
- Others
- By Geography
- North America
- United States
- Canada
- Mexico
- Europe
- Germany
- United Kingdom
- France
- Italy
- Spain
- Russia
- Nordics
- Rest of Europe
- Asia-Pacific
- China
- Japan
- South Korea
- India
- South East Asia
- Australia
- Rest of Asia-Pacific
- South America
- Argentina
- Brazil
- Rest of South America
- Middle East and Africa
- Middle East
- United Arab Emirates
- Saudi Arabia
- Qatar
- Rest of Middle East
- Africa
- South Africa
- Nigeria
- Rest of Africa
- Middle East
- North America
Detailed Research Methodology and Data Validation
Primary Research
Seasoned solution architects, airport IT chiefs, bank security officers, and procurement heads across North America, Europe, Asia-Pacific, and the Gulf were interviewed or surveyed. Their insights tested adoption rates, price erosion pace, and integration barriers, helping us close data gaps and fine-tune cost and penetration assumptions.
Desk Research
We began by mapping the value chain through publicly available information from agencies such as the International Air Transport Association, World Bank digital identity programs, and Interpol's biometric standards papers, which outline adoption triggers and unit deployments. Company 10-Ks, customs shipment records, and patent filings identified active suppliers, typical average selling prices, and regional installation patterns. Our analysts also screened D&B Hoovers, Dow Jones Factiva, and Questel to cross-check financial footprints and recent IP activity in facial and iris analytics. The sources named here illustrate, rather than exhaust, the wide secondary corpus reviewed.
Market-Sizing & Forecasting
A top-down construct starts with the installed base of networked cameras, e-gates, KYC kiosks, and NFC-enabled phones, which is then aligned to contactless biometric penetration ratios by use case. Select bottom-up checks, supplier revenue roll-ups and sample hardware ASP × units, anchor our totals. Key model levers include airport passenger volumes, smartphone shipments, e-commerce fraud losses, public spending on digital ID, and healthcare touchless check-in installs. Multivariate regression with scenario analysis projects each lever, while outlier regions where ASP disclosure is scarce are gap-filled using regional price curves validated by distributors.
Data Validation & Update Cycle
Outputs pass three rounds of analyst review that flag variance above two standard deviations against peer indicators. Annual refreshes are standard; interim updates trigger after material events such as new national ID mandates. A final pass right before publication guarantees clients receive the latest calibrated view.
Why Mordor's Contactless Biometrics Technology Baseline Commands Reliability
Published figures often diverge because firms apply their own scope filters, currency bases, and refresh cadences. Component mixes and channel mark-ups also vary.
Key gap drivers include: some studies bundle contact-based scanners, others apply aggressive device ASP inflation, while a few extrapolate from limited pilot data. Mordor Intelligence locks scope to pure touchless modalities, applies blended ASPs derived from multi-region invoices, and refreshes annually, yielding a balanced, traceable baseline.
Benchmark comparison
| Market Size | Anonymized source | Primary gap driver |
|---|---|---|
| USD 19.87 B | Mordor Intelligence | - |
| USD 21.20 B | Global Consultancy A | Includes retrofit kits and uses single-region ASPs |
| USD 16.97 B | Industry Journal B | Excludes SaaS-based biometric APIs |
| USD 25.84 B | Regional Consultancy C | Applies optimistic 30% year-one rollout for government projects |
These comparisons show that, by selecting the right scope and vetting every assumption with on-ground experts, Mordor analysts deliver a dependable baseline that decision-makers can reuse with confidence.


Key Questions Answered in the Report
What is driving the strong CAGR in the Contactless Biometrics Technology market?
Growth is powered by national digital-ID projects, post-Covid demand for touch-free security, biometric payment card rollouts, and AI-enabled edge devices that simplify large-scale deployments.
Which component segment will grow the fastest through 2031?
Services, particularly cloud-based biometric-as-a-service offerings, are projected to advance at 14.98% CAGR as enterprises favor subscription models over capital expenditures.
Why is multimodal authentication gaining traction?
Pairing multiple biometric factors cuts false accept rates to 0.0001% and meets stricter compliance rules, which is vital for aviation, banking, and critical infrastructure sites.
How do data-sovereignty rules affect cross-border deployments?
Regulations such as GDPR require localized storage and explicit consent for biometric data, raising deployment costs by up to 60% for multinational programs.
Which region will contribute the most incremental revenue between 2026 and 2031?
Asia Pacific, expanding at 14.35% CAGR, will add the highest absolute revenue on the back of government ID schemes and rapid smartphone penetration.
What role do biometric payment cards play in consumer adoption?
They introduce fingerprint verification within a familiar form factor, cutting fraud by more than 60% and familiarizing consumers with everyday biometric use.
What is the forecast value for the Contactless biometrics technology market in 2031?
The Contactless Biometrics Technology market is forecast to reach USD 42.75 billion by 2031, advancing at a 13.63% CAGR.
Page last updated on:


