Market Overview
| Study Period | 2020 - 2031 |
|---|---|
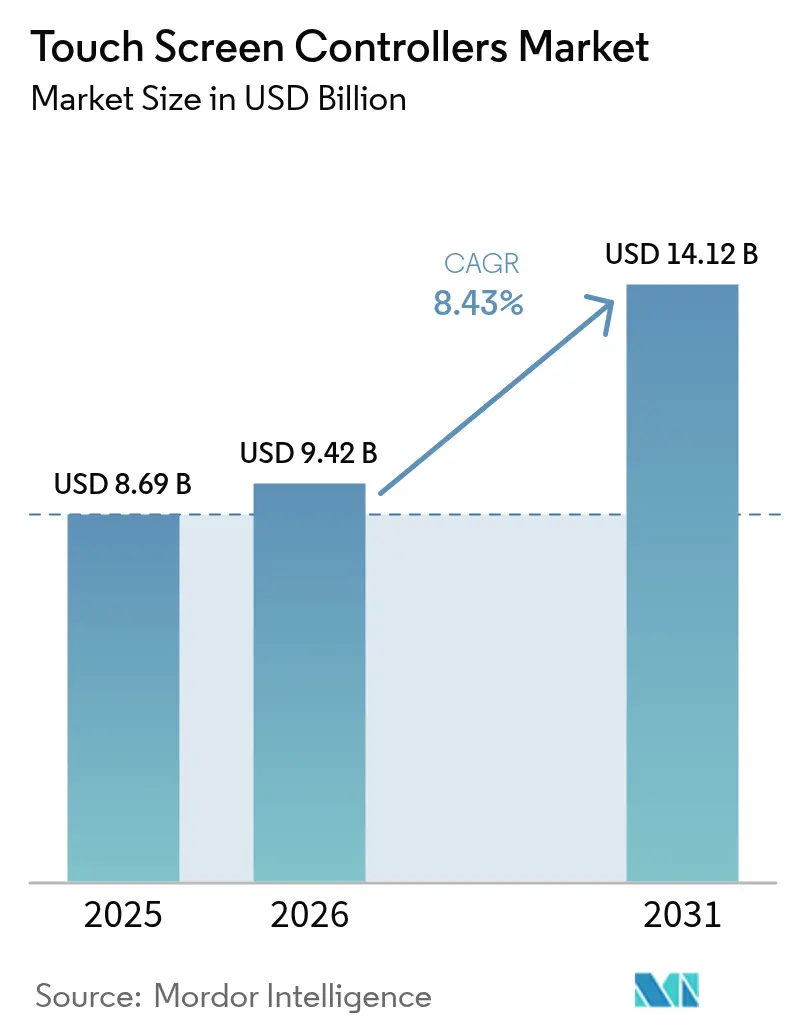
| Market Size (2026) | USD 9.42 Billion |
| Market Size (2031) | USD 14.12 Billion |
| Growth Rate (2026 - 2031) | 8.43% CAGR |
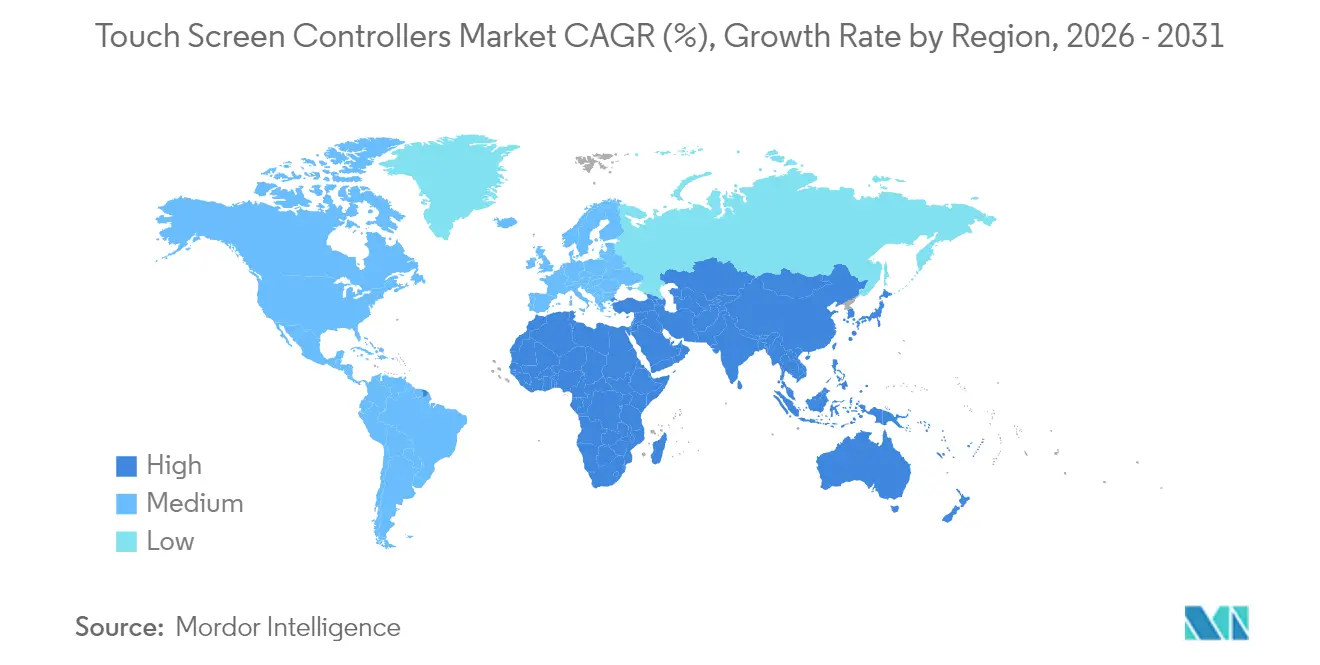
| Fastest Growing Market | Middle East and Africa |
| Largest Market | Asia Pacific |
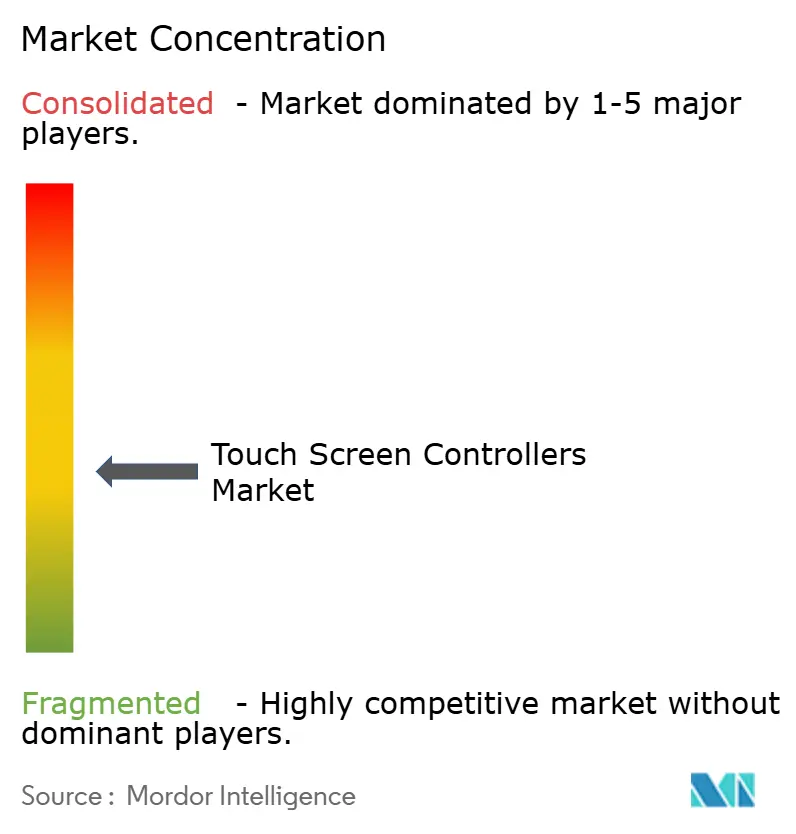
| Market Concentration | Medium |
Major Players.webp) *Disclaimer: Major Players sorted in no particular order Image © Mordor Intelligence. Reuse requires attribution under CC BY 4.0. | |
Touch Screen Controllers Market Analysis by Mordor Intelligence
The touch screen controllers market size is expected to grow from USD 8.69 billion in 2025 to USD 9.42 billion in 2026 and is forecast to reach USD 14.12 billion by 2031 at 8.43% CAGR over 2026-2031. Growth is propelled by rising adoption of multi-touch interfaces in smartphones, larger in-vehicle displays, and industrial migration to projected capacitive (PCAP) panels. On the supply side, integrated touch-and-display driver ICs (TDDI) are trimming component counts and enabling thinner device profiles, while ongoing wafer-level constraints encourage premium-priced automotive and medical solutions. Demand is reinforced by retail automation, wearables that require ultra-low-power 32-bit controllers, and expanding use of flexible OLED screens that push controller algorithms toward complex edge detection and palm rejection. Regional momentum is greatest in Asia Pacific because of its dense electronics manufacturing base, with incremental opportunities building in the Middle East and Africa through smart-city projects and self-checkout deployments.
Key Report Takeaways
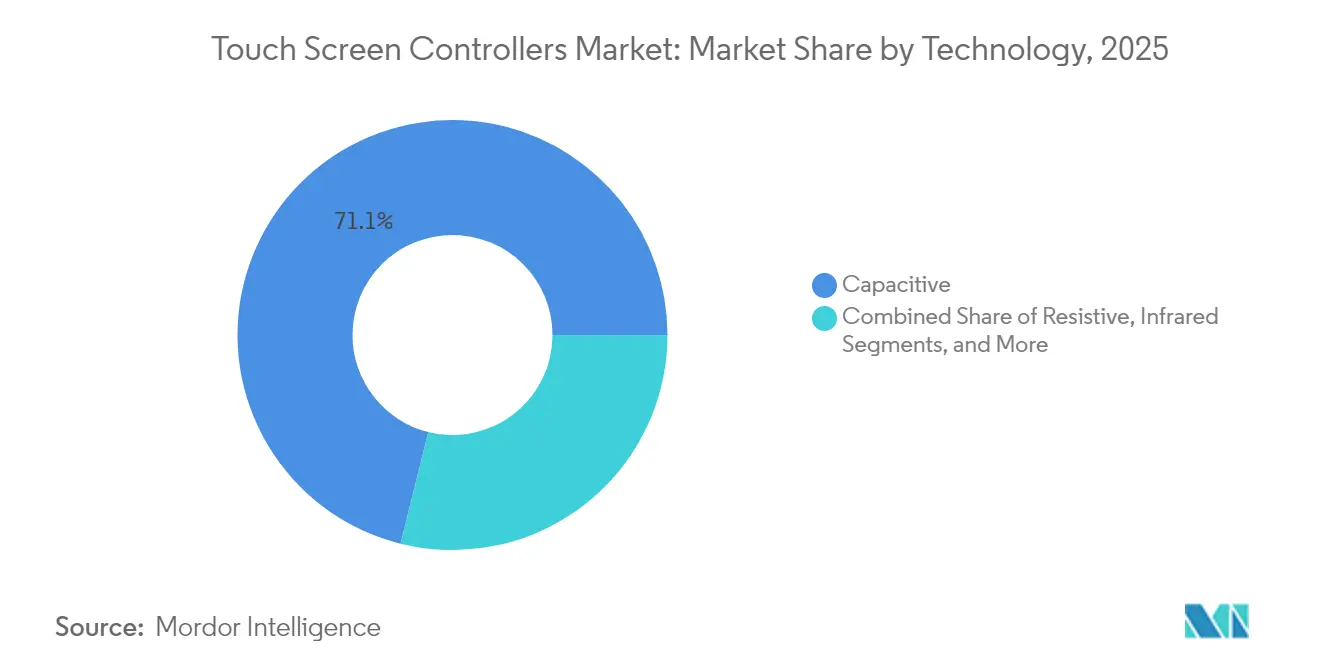
- By technology, capacitive solutions led with 71.12% of the touch screen controllers market share in 2025, whereas infrared is set for the fastest 10.45% CAGR to 2031.
- By interface, I2C held 42.65% revenue share in 2025; USB is forecast to advance at a 9.05% CAGR through 2031.
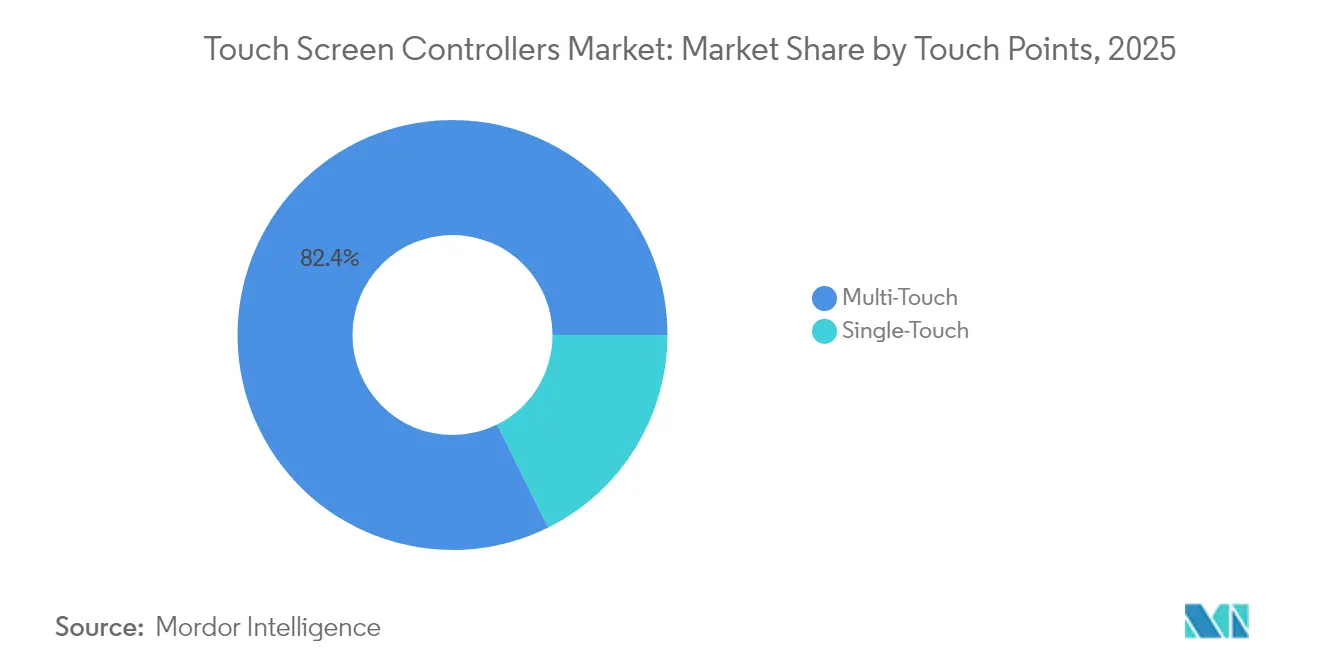
- By touch points, multi-touch accounted for 82.35% of the touch screen controllers market size in 2025, and remains on an 8.56% growth path.
- By display size, the 5–10 inch class captured 38.40% of the touch screen controllers market size in 2025, while panels above 10 inches expand at a 10.05% CAGR to 2031.
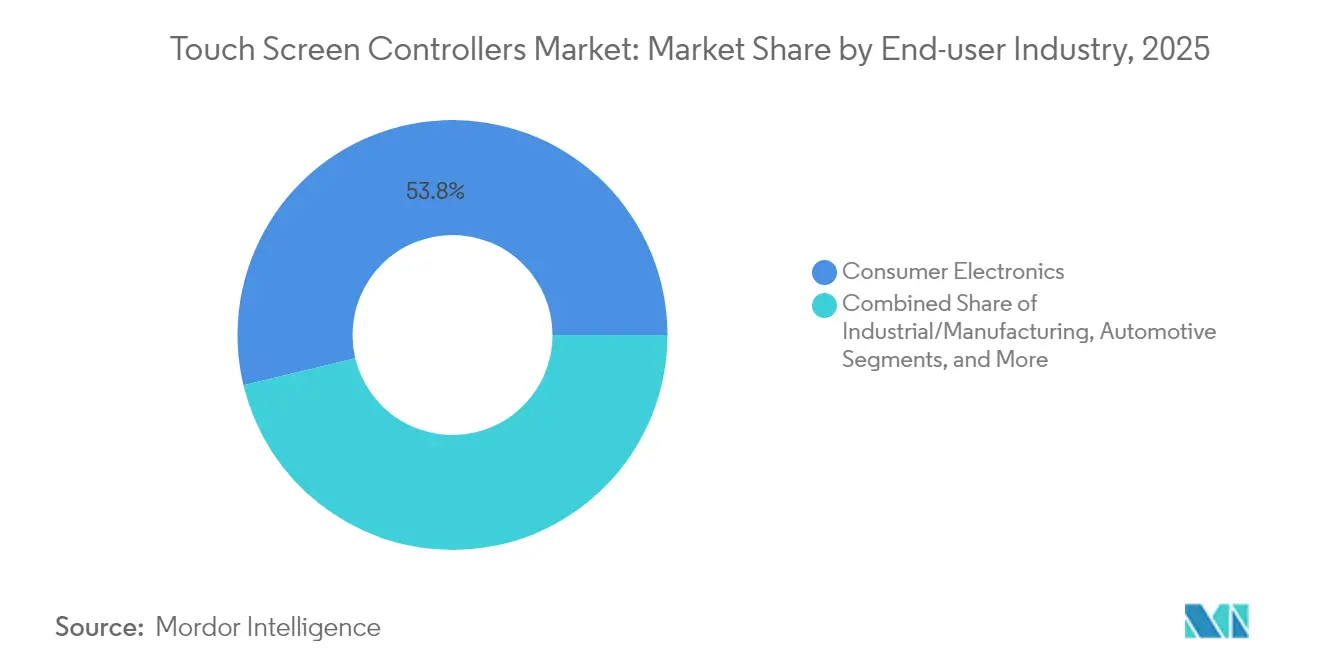
- By end-user industry, consumer electronics led with 53.75% revenue in 2025, but automotive registers the strongest 11.05% CAGR through 2031.
- By geography, Asia Pacific commanded 61.25% revenue in 2025, whereas the Middle East and Africa region is on a 10.03% CAGR trajectory to 2031.
- The top five companies together controlled 44.30% global share in 2025.
Note: Market size and forecast figures in this report are generated using Mordor Intelligence’s proprietary estimation framework, updated with the latest available data and insights as of 2026.
Global Touch Screen Controllers Market Trends and Insights
Drivers Impact Analysis*
| Driver | (~) % Impact on CAGR Forecast | Geographic Relevance | Impact Timeline |
|---|---|---|---|
| Multi-Touch Capacitive Adoption in Flexible OLED Smartphone Displays | +2.3% | Global, with concentration in China, South Korea, and Japan | Medium term (2-4 years) |
| In-Vehicle Infotainment Upgrades with Level-2 ADAS in Europe | +1.8% | Europe, North America, with spillover to premium segments in APAC | Medium term (2-4 years) |
| Self-Checkout POS Proliferation amid North-American Labor Shortages | +1.2% | North America, with adoption spreading to Europe and developed APAC | Short term (≤ 2 years) |
| Hand-held Medical Imaging Devices Miniaturization | +0.8% | North America, Europe, and developed APAC markets | Medium term (2-4 years) |
| Industry 4.0 Rugged PCAP Panels Replacing Membrane Keypads in China | +1.5% | Asia Pacific, primarily China, with gradual adoption in other manufacturing hubs | Medium term (2-4 years) |
| Touch-Enabled Smartwatch Shift Driving Low-Power 32-bit Controllers | +1.1% | Global, with early adoption in North America and Europe | Short term (≤ 2 years) |
| Source: Mordor Intelligence | |||
Multi-touch Capacitive Adoption in Flexible OLED Smartphone Displays
Smartphone makers are stretching displays over curved edges and foldable hinges, raising complexity for touch-channel routing and palm-rejection logic. Controllers must process variable pressure inputs over irregular surfaces while minimizing parasitic capacitance. Oxide-based panels showcased in 2025 demonstrated integrated touch paths that sustain signal-to-noise ratios at narrow bezels above 90% screen-to-body levels. Patent portfolios around edge shielding and localized drive waveforms create a premium tier inside the touch screen controllers market, where suppliers monetize specialized IP against high-volume flagship handsets.
In-Vehicle Infotainment Upgrades with Level-2 ADAS in Europe
Car dashboards now host curved 34-inch panels that merge cluster, navigation, and media controls. Controllers, therefore, need wide operating temperatures, stringent EMI resilience, and fault-tolerant firmware. Devices such as the ATMXT3072M1 adopt 112 reconfigurable channels and proprietary mutual-cap acquisition schemes that raise SNR by 15 dB, ensuring reliable detection under electromagnetic stress from powertrains and ADAS radars.[1]Microchip Technology, “maXTouch Touchscreen Controllers,” microchip.com Haptic knobs embedded atop displays restore tactile feedback, improving driver attention scores and placing additional latency constraints on the controller’s scan loop.
Self-Checkout POS Proliferation amid North-American Labor Shortages
Retailers deploy high-duty-cycle kiosks that must reject liquid splashes, adapt to dynamic lighting, and safeguard payment credentials. Controllers with extended voltage drive eliminate water-induced false touches and integrate hardware crypto accelerators for secure PIN entry. The advanced PCAP 9200 series exemplifies these features and positions vendors to ride the swelling installed base of unattended checkout lanes. Volume demand for kiosks brings incremental units into the touch screen controllers market within a two-year window.
Industry 4.0 Rugged PCAP Panels Replacing Membrane Keypads in China
Factory operators migrate to glass-front PCAP screens that tolerate chemicals and glove usage. This shift expands controller unit volumes beyond consumer handhelds into production lines, pushing suppliers to build firmware that filters conductive noise from drive motors. Domestic Chinese OEMs have begun standardizing on these rugged modules, accelerating share gain for regional fabs and stimulating local tooling investments across the touch screen controllers market.
Restraints Impact Analysis*
| Restraint | (~) % Impact on CAGR Forecast | Geographic Relevance | Impact Timeline |
|---|---|---|---|
| 55 nm Mixed-Signal Wafer Supply-Chain Tightness | -0.7% | Global, with particular impact on Asian manufacturing | Short term (≤ 2 years) |
| EMI/ESD Compliance Issues for >24″ Capacitive Automotive Displays | -0.5% | Global automotive supply chain, primarily affecting European and North American OEMs | Medium term (2-4 years) |
| Controller-IP Litigation with Indian White-Box Tablet Makers | -0.3% | India, with potential spillover to other emerging markets | Medium term (2-4 years) |
| ASP Erosion from Panel-Maker Vertical Integration | -0.6% | Asia Pacific, primarily affecting Chinese and Taiwanese supply chains | Long term (≥ 4 years) |
| Source: Mordor Intelligence | |||
55 nm Mixed-Signal Wafer Supply-Chain Tightness
Foundry allocations at key 55 nm nodes remain strained because automotive MCU and industrial IoT demand compete with consumer touch chips. Controller makers increasingly sign multi-year take-or-pay contracts to guarantee capacity, diverting working capital and elongating design cycles. Some firms are redesigning products for 65 nm or 40 nm bulk CMOS, though such porting introduces requalification costs and can raise die size. NXP’s disclosure of limited allocation windows underscores near-term supply risk across the touch screen controllers market.[2]NXP Semiconductors, “IFRS 2024 Q4,” nxp.com
EMI/ESD Compliance Issues for >24″ Capacitive Automotive Displays
Large cockpit screens magnify antenna effects that attract EMI and elevate ESD stress. Controller vendors must integrate guard channels, advanced filtering, and on-chip transient suppression, increasing the bill-of-materials and certification timelines. Synaptics markets automotive-grade solutions that address these demands through proprietary spread-spectrum drive schemes and robust shielding layouts. Compliance complexity tempers growth potential for oversized panels within the touch screen controllers market until design tools and material stacks mature.
*Our forecasts treat driver/restraint impacts as directional, not additive. The impact forecasts reflect baseline growth, mix effects, and variable interactions.
Segment Analysis
By Technology: Capacitive Dominates While Infrared Scales Up
Capacitive solutions captured 71.12% of the touch screen controllers market share in 2025, reflecting strong adoption in phones, tablets, and vehicle cockpits. Their ability to sense through cover-glass and to support ten-plus touch points secures design wins where durability, optical clarity, and gesture richness matter. The segment benefits from ongoing migration to integrated TDDI chips that lower bezel count and shrink module thickness. Conversely, resistive products continue serving glove-based factory consoles and point-of-sale terminals, though incremental volumes decline as PCAP pricing falls.
Infrared controllers post the highest 10.45% CAGR to 2031. Bezel-mounted emitter-receiver arrays let integrators scale beyond 100 inches at moderate cost, a key advantage for classrooms, digital signage, and heavy-duty kiosks. Efficiency gains in IR LED drivers combined with refined line-of-sight algorithms are reducing latency and improving ambient light immunity, prompting education boards and corporate meeting rooms to consider interactive walls. This dynamic keeps technology diversity alive inside the touch screen controllers market, encouraging vendors to maintain parallel product lines across PCAP, IR, and niche acoustic or optical imaging solutions.


By Interface: I2C Retains Lead While USB Accelerates
The I2C protocol delivered 42.65% revenue in 2025 thanks to its two-wire simplicity, low pin count, and multi-master capability, catering to system-on-chip environments. Smartphones, wearables, and many automotive displays rely on I2C for low-noise, low-power communication between the controller and host processor. SPI holds steady in panel PCs and higher-resolution tablets where bandwidth requirements rise, while UART persists in legacy industrial terminals seeking minimal firmware updates.
USB emerges as the fastest-growing at a 9.05% CAGR given its plug-and-play nature and high throughput that supports stylus data and hover sensing. ODMs targeting kiosks, medical carts, and detachable monitors appreciate the standard connector and host-agnostic enumeration process. White-box PC makers also favor USB touch due to the cost avoidance of additional bridge ICs. This interface flexibility widens application reach, adds volumes to the touch screen controllers market, and pressures vendors to supply multi-interface firmware capable of seamless field reconfiguration.
By Touch Points: Multi-Touch Sets the Experience Benchmark
Multi-touch occupied 82.35% revenue in 2025, confirming its status as a baseline expectation in interactive products. Controllers now decode 10 to 20 separate contacts with high linearity and sub-1 mm precision, empowering pinch-zoom and three-finger swipe gestures that dominate modern UX design. Industrial HMIs exploit five-finger recognition for simultaneous operability with gloves. Hover detection and pressure gradation extend capabilities, positioning high-resolution multi-touch as the standard for creative tools and automotive telematics.
Single-touch retains relevance where cost and ruggedness outweigh gesture needs. Medical infusion pumps, elevator panels, and basic thermostats often adopt single-point controllers tuned for fluid rejection and EMI immunity. Embedded firmware emphasizes consistent debounce timing rather than complex pattern recognition. This coexistence ensures the touch screen controllers market accommodates an array of price and specification brackets, supporting long-tail applications even as multi-touch growth persists.
By Display Size: Mid-Range Screens Dominate Yet Large Panels Surge
Panels measuring 5–10 inches delivered 38.40% of the touch screen controllers market size in 2025. The format balances portability and readability, serving mid-sized tablets, rugged handhelds, and infotainment head units. Designers leverage edge-to-edge glass and mini-LED backlights, which elevate EMI and thermal hurdles that controllers must resolve through adaptive drive waveforms and temperature compensation.
Displays above 10 inches register the strongest 10.05% CAGR moving toward 2031. Full-dashboard automotive screens, interactive kiosks, and collaborative flat panels demand high channel counts and robust frequency hopping to mitigate large-panel noise. Snowmobile consoles outfitted with 10.25-inch touch displays illustrate spillover into recreational vehicles, broadening applications. Below 5 inches, wearables and specialized sensors persist but cede revenue share to expanding midsize and large formats, sustaining multiple growth nodes inside the touch screen controllers market.
By End-User Industry: Consumer Electronics Tops While Automotive Gains Pace
Consumer electronics contributed 53.75% revenue in 2025, anchored by handset and tablet economies of scale. Laptop penetration is rising as OEMs introduce 2-in-1 designs with stylus input, while smartwatches ask for micro-footprint controllers drawing single-digit milliwatts in sleep mode. Tight design cycles spur demand for readily available reference boards and software toolkits.
Automotive rises fastest at 11.05% CAGR, propelled by cockpit digitization and the transition to software-defined vehicles. Large curved clusters require extended operating temperature and functional-safety diagnostics, steering controller roadmaps toward AEC-Q100 qualification. Industrial factories, healthcare devices, and retail kiosks together expand a robust second tier, where environmental robustness and regulatory compliance drive premium ASPs that cushion margin compression across the broader touch screen controllers market.
Geography Analysis
Asia Pacific held 61.25% revenue in 2025, supported by dense component supply chains, skilled labor, and government incentives for semiconductor self-sufficiency. China hosts major controller IC fabs plus downstream module assemblers that feed local smartphone and appliance giants. Regional suppliers such as FocalTech continue to innovate with integrated display-and-touch solutions that meet automotive reliability goals. South Korea and Japan contribute leading OLED and oxide TFT expertise, fueling high-value controller sockets in flexible and foldable devices.
North America ranks second, driven by platform innovation in automotive electronics, medical imaging, and industrial automation. Silicon Valley design centers emphasize AI-enhanced signal processing that filters complex noise environments. Retail chains accelerate self-checkout installations, securing additional controller unit demand. Robust cybersecurity requirements in this region elevate interest in hardware-accelerated encryption embedded within touch controllers.
Europe follows closely and relies heavily on automotive production clusters in Germany, France, and Sweden. Stringent functional-safety and electromagnetic-compatibility norms lengthen design timelines yet create defendable niches for certified suppliers. EU-wide push toward Level-2 and Level-3 ADAS drives larger cockpit displays that utilize high-channel-count controllers, enriching application diversity in the touch screen controllers market.
The Middle East and Africa region posts the fastest 10.03% CAGR through 2031. Smart-city programs in Gulf economies order touch-enabled kiosks, digital signage, and payment terminals. Retail and hospitality segments adopt interactive systems that shorten service queues. Smaller domestic integrators procure controllers via global distributors, raising local design activity.
South America shows gradual expansion, with Brazil and Argentina upgrading banking ATMs and classroom technology. Currency volatility and tariff structures influence procurement cycles, yet growing smartphone penetration nourishes aftermarket demand for repair-grade touch modules. Collective regional progress broadens the geographic footprint of the touch screen controllers market, mitigating overreliance on Asia-based output.

Competitive Landscape
The touch screen controllers market displays moderate concentration. Roughly 45% revenue rested with the top five vendors in 2024, led by NXP Semiconductors, Renesas Electronics, and Synaptics. These firms leverage mixed-signal design heritage and large automotive engagement to sustain competitive moats. Mid-tier Asian companies integrate forward into display driver ICs, forming TDDI packages that cut the bill-of-materials for handset OEMs and intensify price competition in high-volume segments.
Value-chain integration is altering power dynamics. Panel makers in China and Taiwan co-develop controller silicon to retain margin amid LCD commoditization, creating cost pressure on standalone IC suppliers. In response, pure-play controller firms pivot to specialized verticals where regulatory compliance or environmental constraints elevate entry barriers. Examples include medical-grade controllers qualified under IEC 60601 or industrial parts with chemical-resistant cover-glass calibration.
Innovation is active. SigmaSense introduced ShareTouch for secure data transfer and Who Touch for personalized user recognition, exploiting advanced digital signal processing to sample full analog waveforms instead of traditional peak detection. Microchip’s knob-on-display concept embeds rotary encoders on glass, merging tactile and touch input in one module. Patent disclosures on multi-point capacitive sensing with integrated drive and readout circlets indicate continuing efforts to heighten noise immunity while shrinking die area.[4]Steven P. Hotelling et al., “US8279180B2 – Multipoint Touch Surface Controller,” google.com
Touch Screen Controllers Industry Leaders
NXP Semiconductors
STMicroelectronics
Renesas Electronic Corporation
Texas Instruments Incorporated
Microchip Technology Inc.
- *Disclaimer: Major Players sorted in no particular order

Recent Industry Developments
- March 2025: Infineon updated ModusToolbox to support Apple Find My accessories through AIROC Bluetooth MCUs, implying tighter integration between touch subsystems and wireless microcontrollers.
- February 2025: Microchip extended its maXTouch M1 line with ATMXT3072M1 and ATMXT2496M1, enabling curved automotive displays up to 34 inches with 112 configurable channels.
- February 2025: AMT launched true-flat resistive panels for industrial environments, combining pressure sensing and chemical resistance across sizes to 19 inches.
- January 2025: SigmaSense unveiled ShareTouch, Who Touch, and SigmaInk protocols at CES 2025, adding secure data transfer and active-pen support to large interactive displays.


Research Methodology Framework and Report Scope
Market Definitions and Key Coverage
Our study defines the global touch screen controllers market as the value of newly manufactured integrated circuits that translate sensor input from a touch panel into digital commands for displays used in phones, tablets, industrial HMI panels, vehicle infotainment, and self-service kiosks.
Scope Exclusion: Modules that integrate display drivers with controllers and legacy 4-bit resistive chips are not covered.
Segmentation Overview
- By Technology
- Resistive
- capacitive (Projected and Surface)
- Surface Acoustic Wave
- Infrared
- Optical Imaging
- By Interface
- I2C
- SPI
- USB
- UART
- By Touch Points
- Single-Touch
- Multi-Touch
- By Display Size
- Less than 5 Inch
- 5 - 10 Inch
- Above 10 Inch
- By End-user Industry
- Consumer Electronics
- Industrial and Manufacturing
- Healthcare and Medical Devices
- Retail and POS Terminals
- Automotive
- Banking and Financial Kiosks
- Others (Aviation, Education)
- By Geography
- North America
- United States
- Canada
- Mexico
- Europe
- Germany
- United Kingdom
- France
- Italy
- Spain
- Nordics (Denmark, Sweden, Norway, Finland)
- Rest of Europe
- Asia-Pacific
- China
- Japan
- South Korea
- India
- Southeast Asia
- Australia
- Rest of Asia-Pacific
- South America
- Brazil
- Argentina
- Rest of South America
- Middle East
- Gulf Cooperation Council Countries
- Turkey
- Rest of Middle East
- Africa
- South Africa
- Nigeria
- Rest of Africa
- North America
Detailed Research Methodology and Data Validation
Primary Research
Mordor analysts spoke with IC designers, smartphone procurement leads, in-vehicle infotainment engineers, and southeast Asian distributors across North America, Europe, China, Japan, and India. These conversations refined interface mix assumptions and average selling prices before figures were locked.
Desk Research
We built the demand pool from public sources such as UN Comtrade trade codes, World Semiconductor Trade Statistics, and US ITC import records, then verified vendor splits through EDGAR filings. Trend cues came from IEEE Xplore articles, Semiconductor Industry Association briefs, and respected trade magazines, while D&B Hoovers and Dow Jones Factiva supplied screened company financials. The sources listed are indicative rather than exhaustive.
Market-Sizing & Forecasting
We began with a top-down reconstruction of global unit demand by aligning quarterly smartphone, tablet, and automotive display production with controller attach rates, which are then cross-checked through sampled ASP × volume roll-ups for major suppliers. Variables such as smartphone shipments, automotive display penetration, 300 mm wafer capacity, average controller ASP movement, and multi-touch adoption rate feed a multivariate regression that produces the 2025-2030 outlook. Bottom-up gaps where channel data is thin are bridged with HS-854231 customs records.
Data Validation & Update Cycle
Outputs pass variance checks versus WSTS billings and listed vendor revenues; any anomaly triggers a re-contact loop with respondents. Reports refresh yearly, with interim updates for major M&A, trade policy, or technology node shifts.
Why Mordor's Touch Screen Controllers Baseline Commands Reliability
Published estimates differ because firms select varying device sets, bundle combo ICs inconsistently, or apply single-region price curves.
Key gap drivers include Mordor's strict exclusion of driver-controller hybrids, our mid-case price erosion path, and annual refresh cycle, while some publishers bundle hybrids or apply aggressive unit ramp scenarios.
Benchmark comparison
| Market Size | Anonymized source | Primary gap driver |
|---|---|---|
| USD 8.69 B (2025) | Mordor Intelligence | - |
| USD 13.31 B (2025) | Global Consultancy A | Includes driver-controller modules and uniform 10 % ASP erosion |
| USD 9.11 B (2022) | Industry Journal B | Uses 2022 base and straight-line CAGR without post-COVID inventory reset |
The comparison shows that Mordor's disciplined scope, carefully chosen variables, and yearly updates offer decision-makers a balanced, transparent baseline that can be traced back to clear data signals.


Key Questions Answered in the Report
What is the current value of the touch screen controllers market?
The touch screen controllers market is valued at USD 9.42 billion in 2026.
How fast is the touch screen controllers market expected to grow?
It is projected to expand at an 8.43% CAGR, reaching USD 14.12 billion by 2031.
Which technology holds the largest share in the touch screen controllers market?
Capacitive technology leads with 71.12% share in 2025.
Why are infrared touch controllers gaining traction?
Infrared solutions scale cost-effectively to very large screens, driving a 10.45% CAGR from 2026 to 2031.
Why are infrared touch controllers gaining traction?
Infrared solutions scale cost-effectively to very large screens, driving a 10.45% CAGR from 2026 to 2031.
What regions show the strongest growth potential?
The Middle East and Africa region is projected to record a 10.03% CAGR between 2026 and 2031, the fastest worldwide.
Page last updated on:


