Titanium Dioxide Market Size and Share
Market Overview
| Study Period | 2020 - 2031 |
|---|---|
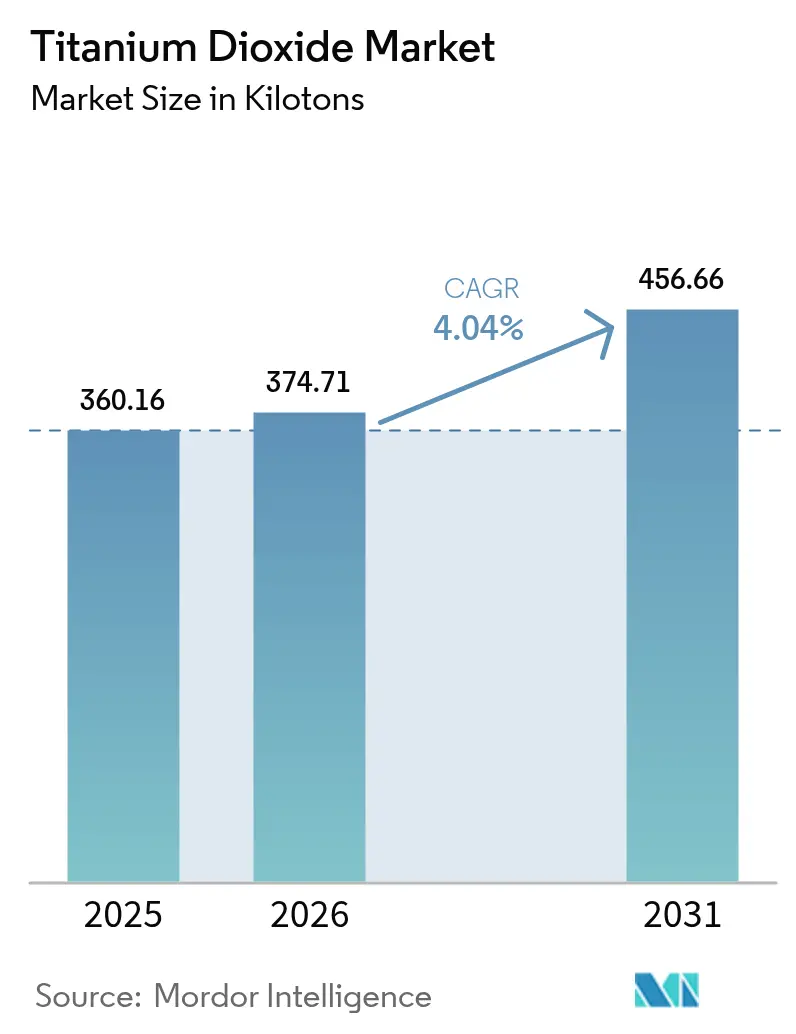
| Market Volume (2026) | 374.71 kilotons |
| Market Volume (2031) | 456.66 kilotons |
| Growth Rate (2026 - 2031) | 4.04% CAGR |
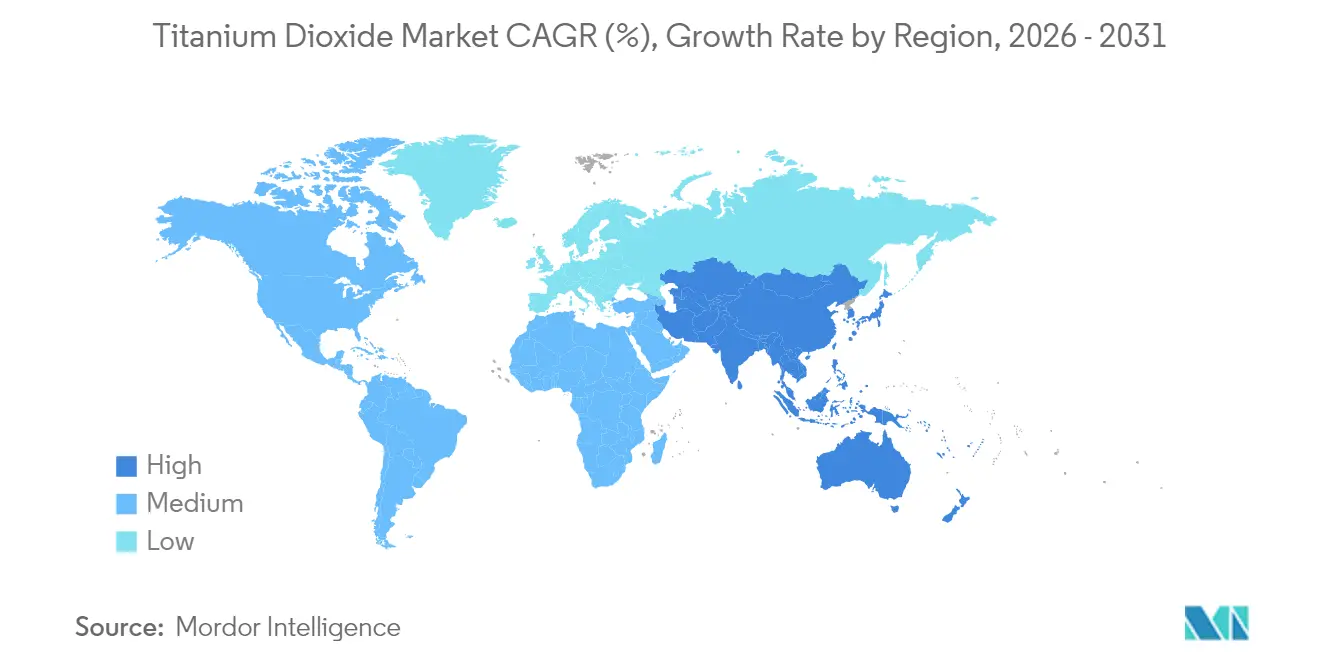
| Fastest Growing Market | Asia Pacific |
| Largest Market | Asia Pacific |
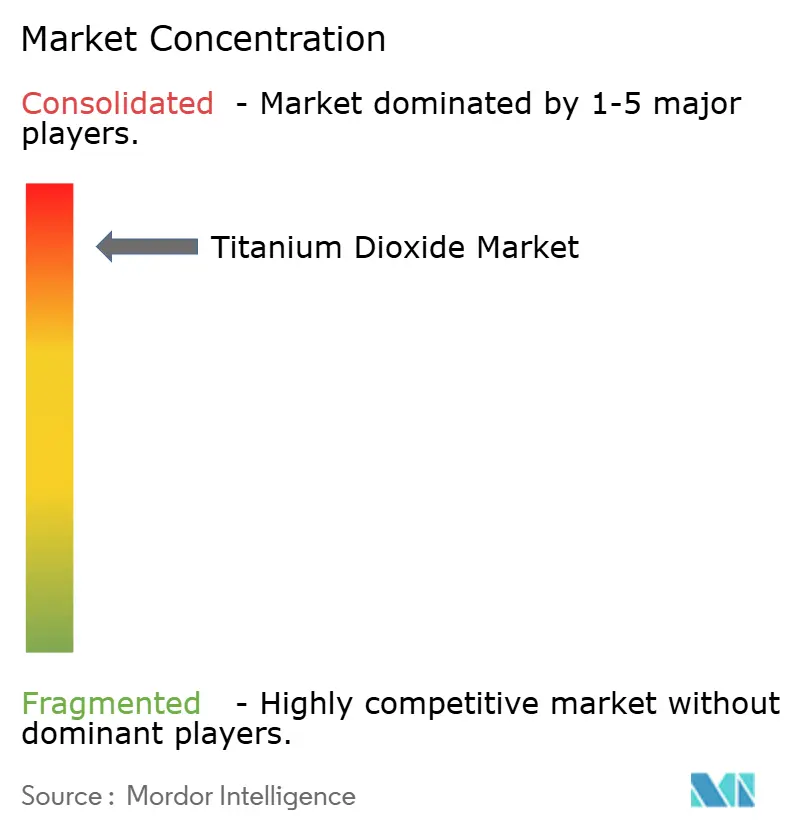
| Market Concentration | High |
Major Players *Disclaimer: Major Players sorted in no particular order Image © Mordor Intelligence. Reuse requires attribution under CC BY 4.0. | |
Titanium Dioxide Market Analysis by Mordor Intelligence
The Titanium Dioxide market size is expected to grow from 360.16 kilotons in 2025 to 374.71 kilotons in 2026 and is forecast to reach 456.66 kilotons by 2031 at 4.04% CAGR over 2026-2031. Rising demand from construction, packaging, automotive plastics, and cool-roof coatings offsets regulatory headwinds, especially Europe’s Category 2 carcinogen labeling and anti-dumping duties on Chinese material. Asia-Pacific, anchored by China’s supply base and India’s localization push, is advancing at a 4.92% CAGR. Manufacturers are balancing cost pressures from volatile ilmenite and rutile feedstock with technology upgrades in the chloride route. Process optimization by players such as Chemours is boosting capacity by 15% without major capital outlays, while vertical integration by Tronox and others mitigates raw-material volatility. Regulatory divergence between the EU and other regions is spurring differentiated product portfolios and creating scope for regional arbitrage.
Key Report Takeaways
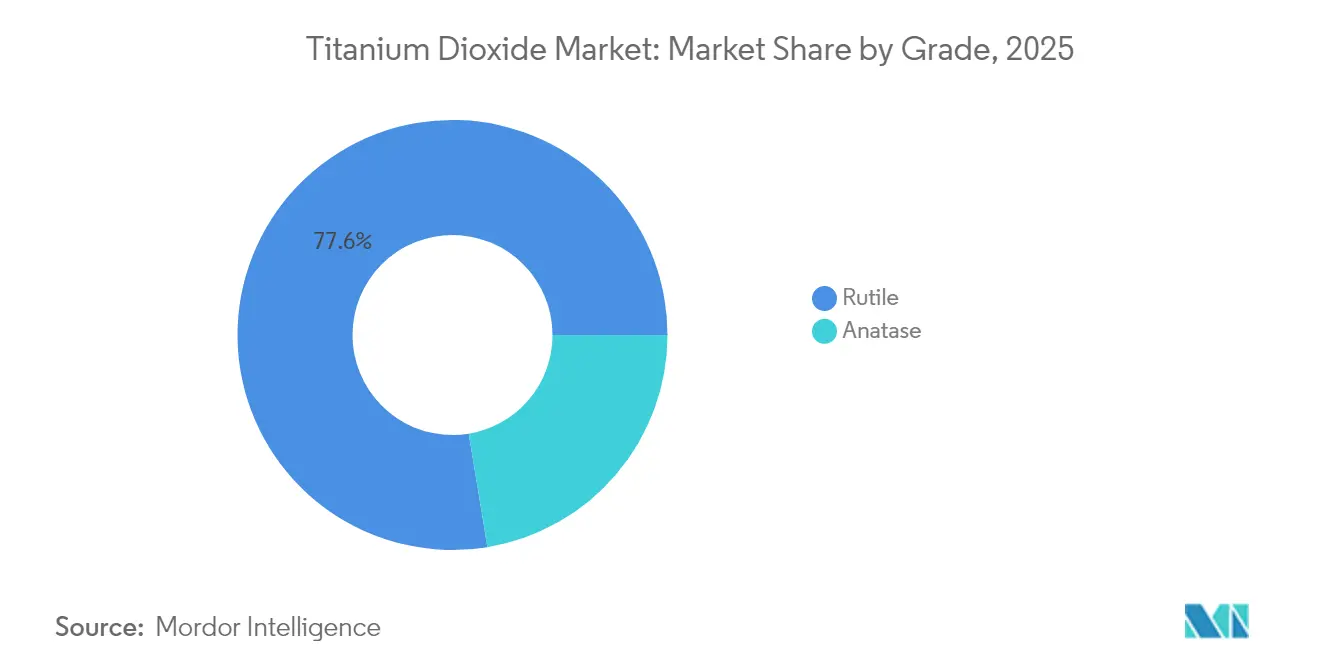
- By grade, rutile led with 77.60% of the titanium dioxide market share in 2025; anatase is growing fastest at a 4.32% CAGR through 2031.
- By process, the sulfate route accounted for 64.30% of the titanium dioxide market size in 2025, but chloride processing is expanding quickest at 4.53% CAGR.
- By application, paints and coatings captured 51.40% of the titanium dioxide market size in 2025, while plastics are the fastest-rising segment at 4.32% CAGR.
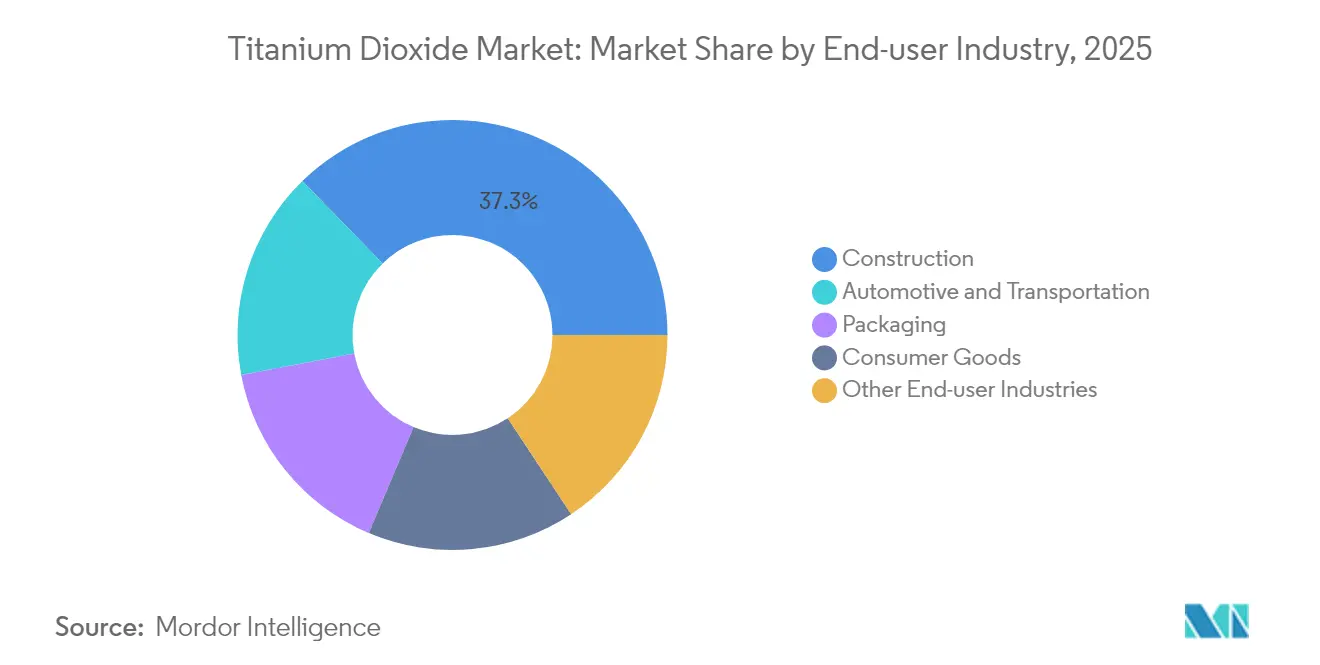
- By end-user industry, construction held 37.30% revenue share in 2025; packaging is projected to post the highest 4.44% CAGR to 2031.
- By geography, Asia-Pacific dominated with a 34.70% share of the titanium dioxide market in 2025 and remains the quickest-growing region at 4.78% CAGR.
Note: Market size and forecast figures in this report are generated using Mordor Intelligence’s proprietary estimation framework, updated with the latest available data and insights as of 2026.
Global Titanium Dioxide Market Trends and Insights
Driver Impact Analysis*
| Drivers | (~) % Impact on CAGR Forecast | Geographic Relevance | Impact Timeline |
|---|---|---|---|
| Waterborne architectural-coating uptake | +1.2% | Asia-Pacific, Middle East | Medium term (2-4 years) |
| Lightweight high-gloss automotive plastics | +0.7% | Europe, North America | Medium term (2-4 years) |
| Laminated e-commerce paperboard packaging | +0.9% | Global, focus on Asia-Pacific and North America | Short term (≤ 2 years) |
| UV-resistant cool-roof coatings | +0.6% | Middle East, Southern Europe, North Africa | Medium term (2-4 years) |
| Localization of chloride-route TiO₂ capacity in India | +0.5% | India, with an impact on global supply chains | Long term (≥5 yrs) |
| Source: Mordor Intelligence | |||
Surge in Demand for Waterborne Architectural Coatings in Asia-Pacific
Escalating volatile-organic-compound regulations across China, India and Indonesia are accelerating substitution of solvent systems by waterborne paints, driving incremental rutile pigment offtake in the region. Regional coating lines are upgrading dispersion technology to achieve hiding power parity, underpinning continuous volume growth for the titanium dioxide market. Infrastructure stimulus programs in India and Indonesia compound demand, while localized chloride-route capacity secures supply resilience. Formulators emphasize lower odor and safer worksite conditions, bolstering acceptance among contractors. The shift is adding a structural tailwind despite feedstock price swings.
Shift Toward Lightweight, High-Gloss Automotive Plastics in Europe
Stringent EU fleet-average carbon-dioxide limits have placed lightweighting at the center of design strategies. Incorporating titanium dioxide into polypropylene and polycarbonate trim delivers high-gloss surfaces that rival coated metal panels yet weigh markedly less, achieving a 5-7% fuel-efficiency gain per 10% vehicle weight reduction. Premium OEMs adopt hydrophobic grades such as TIOXIDE TR48, which disperse at high processing temperatures without loss of brightness. The titanium dioxide market gains not only in volume but in value because these specialty grades command premium pricing and carry minimal regulatory substitution risk.
Growth of Laminated Paperboard Packaging for E-Commerce Logistics
Parcel volumes continue to soar, and brand owners demand packaging that maintains structural integrity through multistep distribution. Titanium dioxide improves opacity and print fidelity, protecting brand imagery and consumer unboxing experience. Its light-scattering properties enhance fiber bonding, delivering weight reductions without compromising compression strength. This specification trend amplifies pigment intensity per square meter, adding depth to the titanium dioxide market beyond traditional cartonboard uses. Integration of moisture-barrier laminates further highlights TiO₂’s role by safeguarding graphics and reducing damage-related returns.
Uptake of UV-Resistant Cool-Roof Coatings in Middle-East Construction
In the Gulf states, air-conditioning loads account for up to 70% of summer electricity use. Cool-roof coatings formulated with high-reflectance titanium dioxide reflect nearly 80% of solar radiation and lower interior temperatures by 1.5 °C, cutting cooling energy by 15-35%. Government green-building mandates and escalating electricity tariffs accelerate adoption in commercial and residential segments. Durability against ultraviolet degradation under desert conditions positions TiO₂ as indispensable, reinforcing medium-term demand momentum for the titanium dioxide market.
Restraint Impact Analysis*
| Restraints | (~) % Impact on CAGR Forecast | Geographic Relevance | Impact Timeline |
|---|---|---|---|
| EU carcinogen labeling for TiO₂ powders | -0.8% | Europe, global exporters | Short term (≤ 2 years) |
| Ilmenite and rutile feedstock price volatility | -0.7% | Global, especially import-dependent markets | Short term (≤ 2 years) |
| Competitive pressure from alternative white pigments | -0.3% | Europe and North America initially | Long term (≥5 yrs) |
| Source: Mordor Intelligence | |||
EU Classification of TiO₂ as Suspected Carcinogen Raising Labeling Costs
European Regulation 2025/4 mandates cancer warnings on powder formulations containing more than or equal to 1% titanium dioxide[1]Publications Office of the European Union, “Commission Implementing Regulation (EU) 2025/4,” eur-lex.europa.eu. Coating, plastisol, and printing-ink suppliers face reformulation, new packaging artwork, and legal reviews, inflating compliance costs. Divergent rules in the United Kingdom and North America complicate global portfolio management, requiring dual labeling strategies. Short-run manufacturing batches raise unit costs, dampening discretionary demand in DIY channels. Although the European Court annulled the hazard label in 2022, the ruling was reversed in 2025 after scientific reassessment, reinforcing uncertainty for the titanium dioxide market.
Volatility in Ilmenite/Rutile Feedstock Prices Impacting Margins
Spot rutile TiO₂ prices climbed in 2024, prompting Chinese producers to issue multiple price hikes. Non-integrated pigment plants in Europe and Asia see gross margins compressed, while integrated players such as Tronox partially offset spikes through captive mines. The unpredictability discourages long-term supply contracts and elevates customer price-risk premiums, restraining downstream demand growth and weighing on the titanium dioxide market.
*Our forecasts treat driver/restraint impacts as directional, not additive. The impact forecasts reflect baseline growth, mix effects, and variable interactions.
Segment Analysis
By Grade: Rutile Retains Dominance Amid Specialty Anatase Advances
Rutile commanded 77.60% of the titanium dioxide market in 2025, reflecting its higher refractive index (2.7) and superior weatherability. This supremacy is entrenched in outdoor architectural coatings, automotive topcoats, and polymer masterbatches where long-term gloss retention is critical. Dual-function grades integrating photocatalytic traits are unlocking new self-cleaning surface opportunities, further entrenching the rutile’s lead.
Anatase, accounting for the demand balance, is advancing at a faster 4.32% CAGR thanks to niche growth in pharmaceutical excipients and photocatalytic building materials. Surface-modified anatase grades extend shelf life in food-contact papers and offer distinct bluish undertones valued in premium office papers.


By Process: Environmental Edge Drives Chloride Route Expansion
The sulfate route delivered 64.30% of the titanium dioxide market size in 2025 by leveraging lower-grade ilmenite and smaller capital footprints. Nevertheless, chloride-based capacity is expanding at 4.53% CAGR as regulators intensify scrutiny of acidic sulfate waste streams. Chloride plants use high-TiO₂ slag or natural rutile and generate primarily rutile pigment with lower trace impurities, enabling higher pricing in premium coatings and masterbatch segments. Chemours reports that proprietary low-temperature chlorination at 350-450 °C can reduce energy use by 30% and improve yield.
Emerging producers in India are adopting chloride technology to achieve quality parity with Western suppliers and to hedge against evolving effluent norms. Incremental debottlenecking projects across North America and Europe aim to squeeze 5-15% extra output from existing chloride assets without greenfield spending, keeping supply balanced despite regional capacity closures such as Tronox’s Botlek facility. Process-driven cost differentials, therefore, remain central to titanium dioxide market competitiveness.
By Application: Paints and Coatings Lead, Plastics Accelerate
Paints and coatings consumed 51.40% of the titanium dioxide market size in 2025 due to TiO₂’s unmatched brightness and opacity. The segment spans architectural, industrial, and marine formulations, where a typical dry film loading of 15-25 % governs hiding power. Shift to low-VOC waterborne systems in Asia-Pacific and North America increases pigment dispersion demands, favoring surface-treated rutile grades. Plastics are growing quickest at 4.32% CAGR as automotive interior trim, white goods, and multilayer packaging adopt TiO₂ for UV shielding and aesthetic uniformity.
Printed rigid packaging films have raised TiO₂ loading to enhance whitespace for high-resolution graphics, compounding pigment intensity per square meter. Paper and pulp applications, though modest in tonnage, rely on anatase to elevate brightness in premium graphic papers. In cosmetics, ultrafine TiO₂ remains a key UV filter in sunscreens, but regulatory debates on nanoparticle safety cap volume growth. Photocatalytic concrete and air-purifying building facades add promising but presently niche tail-winds to the titanium dioxide market.
By End-User Industry: Construction Stays Front-Runner, Packaging Gains Pace
Construction captured 37.30% share of titanium dioxide consumption in 2025, powered by exterior architectural paints, cool roofs, and high-reflectance concrete tiles. Intensifying urban heat-island mitigation codes in hot climates underpin steady demand for bright white coatings with superior solar reflectance. Automotive and transportation hold a solid second-tier position, integrating TiO₂-filled plastics and multilayer coatings to meet both aesthetic and functional UV-resistance criteria. The packaging industry, expanding at 4.44% CAGR, draws on TiO₂ for opacity in e-commerce cartonboard and light-weighted flexible laminates that endure rough logistics.
Geography Analysis
Asia-Pacific controls 34.70% of the titanium dioxide market and delivers the fastest 4.78% CAGR through 2031. China alone houses a major portion of global TiO₂ capacity, balancing exports with rising domestic architectural and infrastructure demand. Government directives to upgrade pigment quality and curb sulfate-process effluent are pushing producers toward chloride technology, replicating Western standards.
North America’s titanium dioxide market remains driven by durable goods, aerospace coatings, and packaging films. Mature environmental regulations favor chloride output, and corporate ESG commitments spur research and development into lower-carbon pigment pathways. Europe’s market is shaped by dual constraints: Category 2 carcinogen labeling and definitive anti-dumping duties on Chinese imports. These measures elevate local production costs but also encourage premium-grade innovation to justify higher price points.
The Middle-East and Africa present emergent potential propelled by construction megaprojects. Cool-roof mandates in the Gulf Cooperation Council and rising tourism facilities spur high-albedo coating uptake. Domestic TiO₂ production remains negligible, driving import dependency and exposure to freight fluctuations.
Mordor Intelligence provides coverage of the titanium dioxide market across other key regional markets, including Europe and North America, each with their regulatory frameworks and demand patterns.

Competitive Landscape
The titanium dioxide market exhibits high concentration. Chemours leverages proprietary chloride technology and continuous improvement programs to extract an extra 15% capacity from existing lines, sustaining a cost-leadership edge. Venator strengthens its specialty position through hydrophobic grades tailored for high-temperature polymer processing. Regional players in India and Southeast Asia are entering via sulfate brownfield conversions, banking on domestic demand but facing stricter effluent norms.
Titanium Dioxide Industry Leaders
Kronos Worldwide, Inc.
LB Group
The Chemours Company
Tronox Holdings Plc
Venator Materials PLC
- *Disclaimer: Major Players sorted in no particular order

Recent Industry Developments
- March 2025: Tronox Holdings announced that it will idle its 90,000 tons/y titanium dioxide plant in Botlek, Netherlands, following a strategic site review.
- February 2025: The Chemours Company launched Ti-Pure TS-6706, a TMP- and TME-free evolution of Ti-Pure R-706 for appearance-critical coatings.


Global Titanium Dioxide Market Report Scope
Titanium dioxide is one of the whitest materials on the earth. It is used extensively as a white pigment to add whiteness and opacity in various applications, such as paints and coatings, cosmetics, food, and other applications.
The titanium dioxide market is segmented by grade, application, and geography. By grade, the market is segmented into rutile and anatase. By application, the market is segmented into paints and coatings, plastics, paper and pulp, cosmetics, and other applications. The report also offers market size and forecast for 15 countries across major regions. For each segment, market sizing and forecast have been done based on volume (kiloton).
| Rutile |
| Anatase |
| Chloride |
| Sulfate |
| Paints and Coatings |
| Plastics |
| Paper and Pulp |
| Cosmetics |
| Other Applications (Leather, Textiles, Rubber) |
| Construction |
| Automotive and Transportation |
| Packaging |
| Consumer Goods |
| Other End-user Industries |
| Asia-Pacific | China |
| India | |
| Japan | |
| South Korea | |
| ASEAN | |
| Rest of Asia-Pacific | |
| North America | United States |
| Canada | |
| Mexico | |
| Europe | Germany |
| United Kingdom | |
| France | |
| Italy | |
| Nordics | |
| Rest of Europe | |
| South America | Brazil |
| Argentina | |
| Rest of South America | |
| Middle-East and Africa | Saudi Arabia |
| United Arab Emirates | |
| South Africa | |
| Egypt | |
| Rest of Middle-East and Africa |
| By Grade | Rutile | |
| Anatase | ||
| By Process | Chloride | |
| Sulfate | ||
| By Application | Paints and Coatings | |
| Plastics | ||
| Paper and Pulp | ||
| Cosmetics | ||
| Other Applications (Leather, Textiles, Rubber) | ||
| By End-user Industry | Construction | |
| Automotive and Transportation | ||
| Packaging | ||
| Consumer Goods | ||
| Other End-user Industries | ||
| By Geography | Asia-Pacific | China |
| India | ||
| Japan | ||
| South Korea | ||
| ASEAN | ||
| Rest of Asia-Pacific | ||
| North America | United States | |
| Canada | ||
| Mexico | ||
| Europe | Germany | |
| United Kingdom | ||
| France | ||
| Italy | ||
| Nordics | ||
| Rest of Europe | ||
| South America | Brazil | |
| Argentina | ||
| Rest of South America | ||
| Middle-East and Africa | Saudi Arabia | |
| United Arab Emirates | ||
| South Africa | ||
| Egypt | ||
| Rest of Middle-East and Africa | ||


Key Questions Answered in the Report
What is the current titanium dioxide market size and its growth outlook?
The titanium dioxide market size is estimated at 374.71 kilotons in 2026 and is projected to grow to 456.66 kilotons by 2031 at a 4.04% CAGR.
Which region leads the titanium dioxide market?
Asia-Pacific holds 34.70% of global demand and exhibits the highest 4.78% CAGR, supported by industrialization and expanding chloride-route capacity.
Why is the chloride process gaining share over the sulfate process?
Chloride technology yields higher-purity rutile pigment with less waste and lower energy per unit, leading to a 4.53% CAGR versus sulfate’s slower expansion.
How does EU carcinogen labeling affect titanium dioxide demand?
Mandatory cancer warnings on TiO₂ powders raise formulation and packaging costs, tempering short-term demand growth in Europe and forcing portfolio adjustments.
Which application will drive the fastest volume growth through 2031?
Plastics is expected to outpace other sectors at 4.32% CAGR as automotive, packaging and consumer durable producers intensify the use of TiO₂ for UV stability and aesthetics.
Page last updated on:


