Autonomous (Driverless) Cars Market Size and Share
Market Overview
| Study Period | 2019 - 2031 |
|---|---|
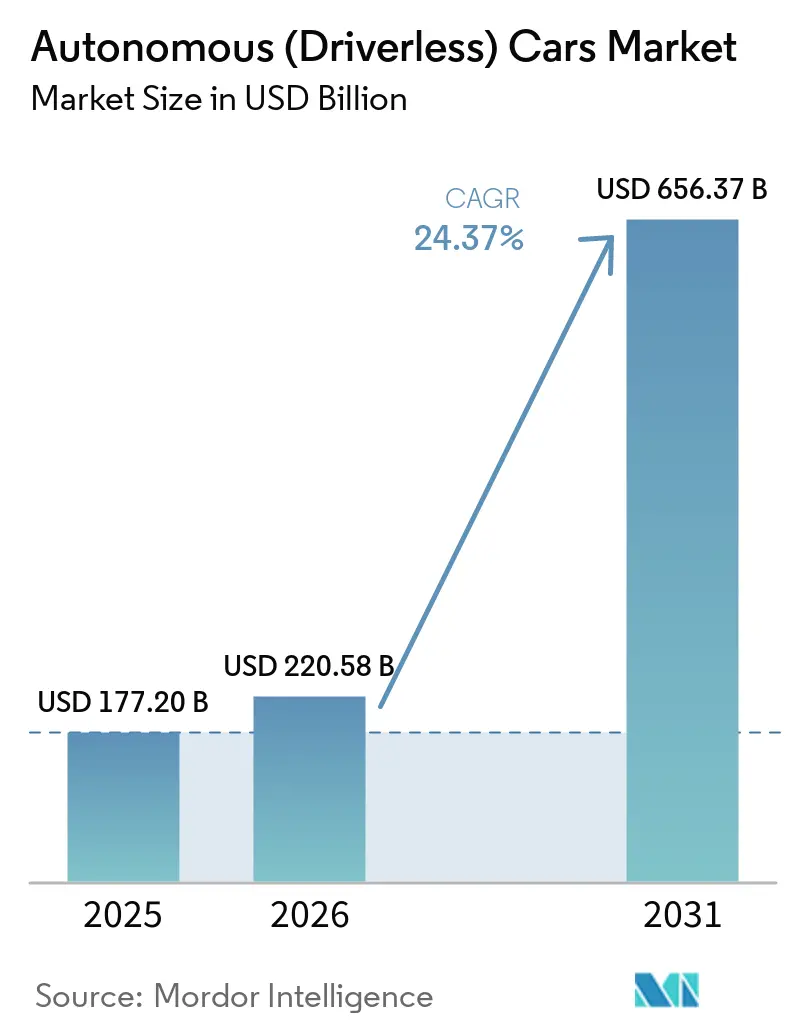
| Market Size (2026) | USD 220.58 Billion |
| Market Size (2031) | USD 656.37 Billion |
| Growth Rate (2026 - 2031) | 24.37% CAGR |
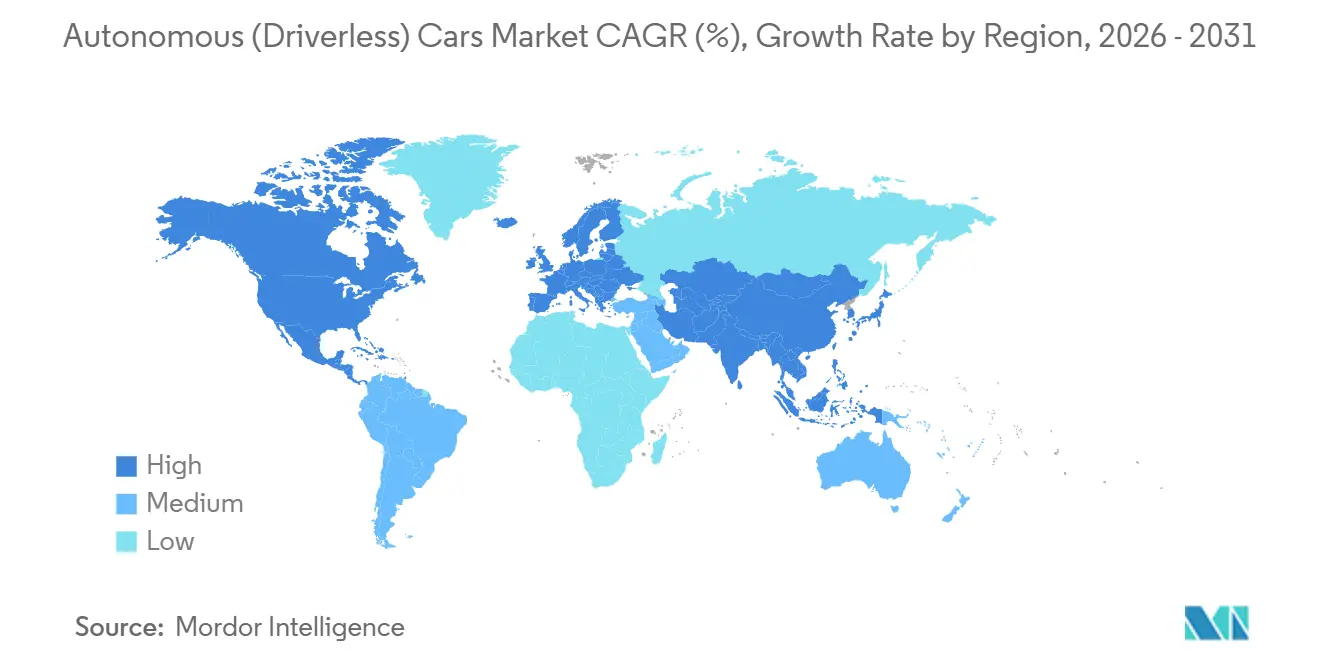
| Fastest Growing Market | Asia Pacific |
| Largest Market | North America |
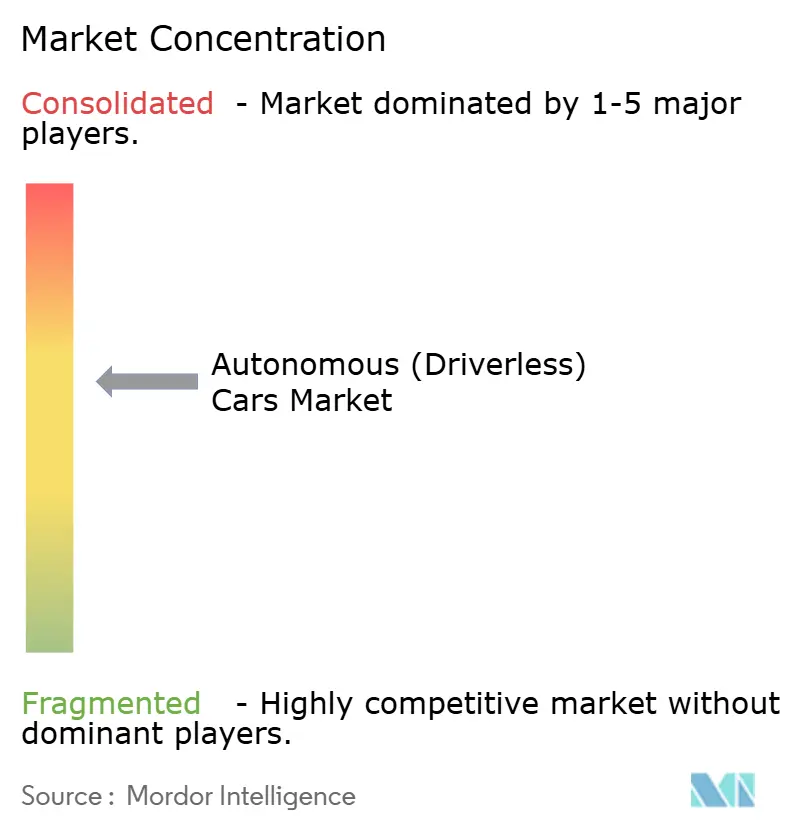
| Market Concentration | Medium |
Major Players *Disclaimer: Major Players sorted in no particular order Image © Mordor Intelligence. Reuse requires attribution under CC BY 4.0. | |
Autonomous (Driverless) Cars Market Analysis by Mordor Intelligence
The autonomous (driverless) cars market size is expected to grow from USD 177.20 billion in 2025 to USD 220.58 billion in 2026, and is forecast to reach USD 656.37 billion by 2031, at a CAGR of 24.37% during the forecast period (2026-2031). Rising affordability of sensors and computing, expanding robo-taxi pilots in major Asian cities, and new safety mandates in the European Union and China continue to drive the autonomous (driverless) cars market toward mass-market acceptance. Automakers have begun embedding Level 2 features as standard equipment to comply with regulations, thereby boosting economies of scale and lowering unit hardware costs. Software now drives much of the value creation because perception, mapping, and planning engines can be upgraded through over-the-air updates, creating recurring revenue streams. Hardware commoditization, 5G-enabled vehicle-to-everything corridors, and power-efficient automotive system-on-chips signal shorter commercialization lead times for higher-autonomy tiers.
Key Report Takeaways
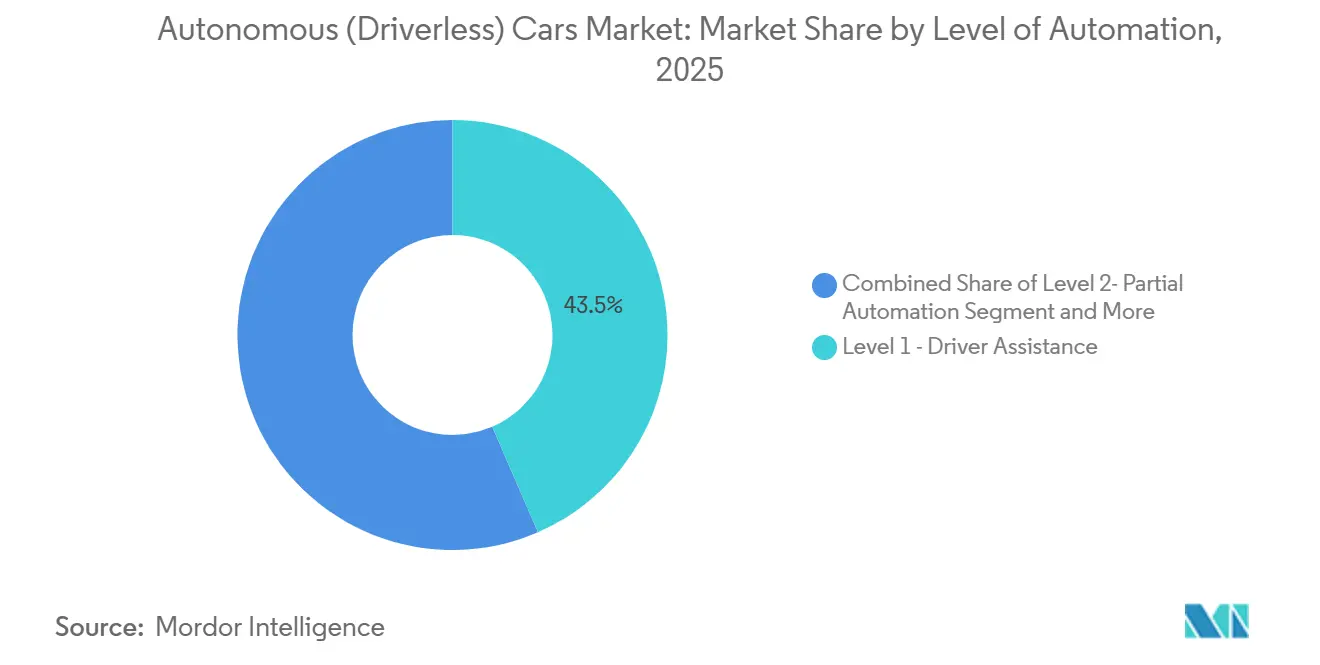
- By level of automation, Level 1 driver assistance held 43.47% of the autonomous (driverless) cars market share in 2025, while Level 5 full automation is forecast to expand at a 24.39% CAGR through 2031.
- By vehicle type, sport-utility vehicles and multi-purpose vehicles captured 78.81% of the autonomous (driverless) cars market share in 2025, whereas hatchbacks are expected to post a 25.11% CAGR to 2031.
- By propulsion type, internal combustion engine vehicles retained 66.37% of the autonomous (driverless) cars market share in 2025. However, battery electric vehicles are expected to grow at a 25.01% CAGR over the forecast period.
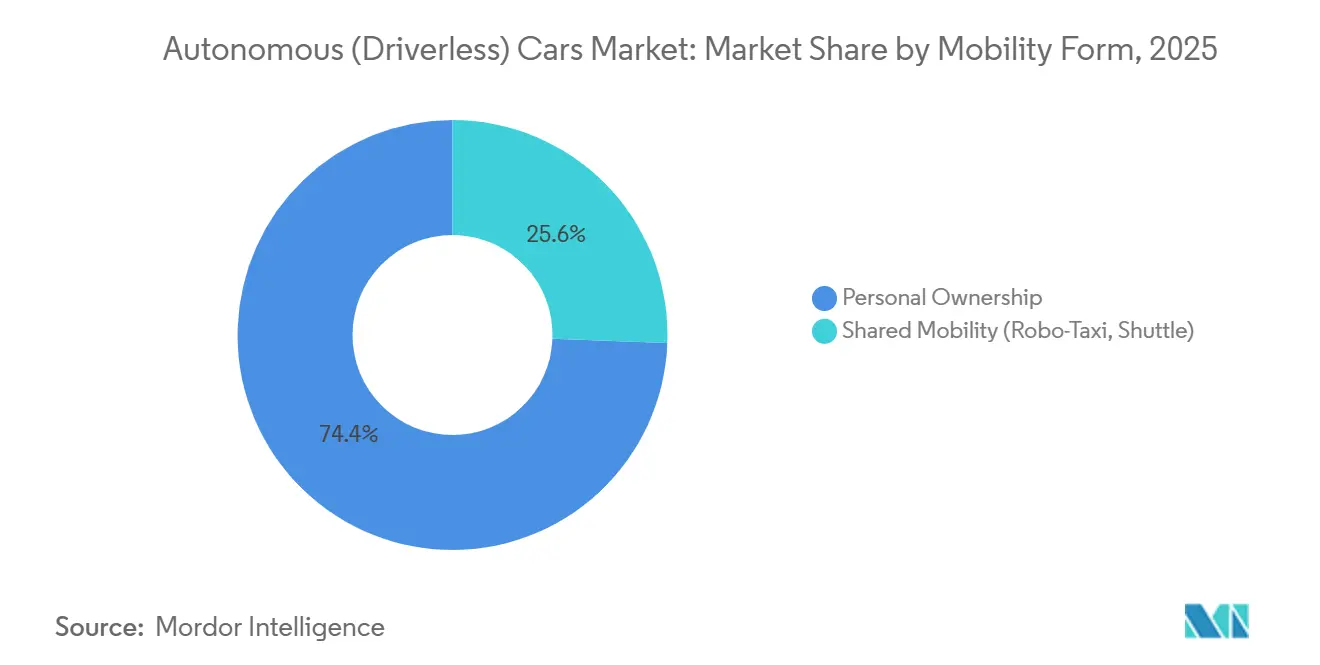
- By mobility form, personal ownership is projected to account for 74.35% of the autonomous (driverless) cars market share in 2025, while shared mobility is expected to grow at a 25.13% CAGR through 2031.
- By component, hardware accounted for 55.57% of the autonomous (driverless) cars market share in 2025, although software is projected to register a 25.07% CAGR through 2031.
- By geography, North America led the autonomous (driverless) cars market with 38.71% market share in 2025, whereas Asia Pacific is on track for a 25.05% CAGR over the forecast period (2026-2031).
Note: Market size and forecast figures in this report are generated using Mordor Intelligence’s proprietary estimation framework, updated with the latest available data and insights as of January 2026.
Global Autonomous (Driverless) Cars Market Trends and Insights
Drivers Impact Analysis*
| Driver | (~)% Impact on CAGR Forecast | Geographic Relevance | Impact Timeline |
|---|---|---|---|
| Rapid Expansion of Robo-Taxi Pilots | +4.2% | China (Wuhan, Beijing, Shenzhen, Guangzhou), Japan (Tokyo, Osaka) | Short term (≤ 2 years) |
| Government Mandates for ADAS-Centric Safety Regulations | +3.8% | Europe, China, with spillover to ASEAN markets adopting UN R157 | Medium term (2-4 years) |
| Falling LiDAR and AI Compute Costs | +3.5% | Global, with early adoption in North America and Europe | Medium term (2-4 years) |
| 5G-V2X Corridor Roll-outs | +3.1% | United States, Canada, with pilot extensions to Mexico | Medium term (2-4 years) |
| Power-Efficient Automotive SoCs Enabling Higher-Autonomy Tiers | +2.9% | Global, led by North America and Asia Pacific | Long term (≥ 4 years) |
| Fleet Decarbonization Targets Accelerating Autonomous Middle-Mile Logistics | +2.7% | Europe (Germany, Netherlands, France), with early gains in Scandinavia | Long term (≥ 4 years) |
| Source: Mordor Intelligence | |||
Rapid Expansion of Robo-Taxi Pilots across Asian Mega-Cities
In late 2024, Baidu's Apollo Go achieved a significant milestone of cumulative rides across multiple cities in China. Meanwhile, Waymo was recording a substantial number of paid rides weekly in both Phoenix and San Francisco. In April 2025, Tokyo revised its Road Traffic Act, paving the way for Level 4 operations in specific districts. This move prompted automotive giants Toyota and Nissan to hasten their pilot schedules. Waymo's unit economics are on the upswing, with the company's average ride cost dropping to a competitive level. Concurrently, Baidu celebrated achieving positive contribution margins in Wuhan by the end of 2024. Furthermore, municipalities in the region are more amenable to issuing commercial licenses than their Western counterparts, resulting in a notable near-term growth boost.
Government Mandates for ADAS-Centric Safety Regulations in the EU and China
The European Union enforced Regulation 2019/2144 in July 2024, obligating all new passenger vehicles to include autonomous emergency braking, intelligent speed assistance, lane-keeping assist, and driver monitoring systems [1]“General Vehicle Safety,” Regulation (EU) 2019/2144, eur-lex. europa.eu . China released GB/T 40429-2021 and granted multiple Level 3 permits in Beijing and Shenzhen during 2024, setting hands-free highway operation as an attainable near-term goal [2]“GB/T 40429-2021 Intelligent Connected Vehicle Standard,” Ministry of Industry and Information Technology, miit.gov.cn . Japan, South Korea, and ASEAN states have adopted UN Regulation 157, creating a contiguous regulatory pull across Asia. The shared compliance calendar increases volume for advanced sensors, reduces per-unit cost, and shortens payback periods for automakers that invest in Level 3 systems.
Falling LiDAR and AI Compute Costs Unlocking Mass-Market Level 3 Launches
Hesai AT128 LiDAR modules are now available at a significantly lower cost in high volumes. NVIDIA's Thor SoC is expected to deliver substantial processing power while maintaining energy efficiency in the near future [3]“Thor Centralized Car Computer,” NVIDIA Corporation, nvidia.com . In 2024, Mercedes-Benz introduced its Drive Pilot Level 3 in Nevada and California, accompanied by an annual subscription fee. These advancements in cost and performance enable mid-tier sedans and SUVs to incorporate conditional automation without encountering thermal or pricing barriers. This overall progress is expected to contribute significantly to the forecasted medium-term CAGR.
5G-V2X Corridor Roll-Outs in North American Freight Networks
The United States National V2X Deployment Plan designates a significant investment for roadside units on major freight routes, beginning with projects in Texas and Arizona. Aurora Innovation and Kodiak Robotics are piloting autonomous Class 8 trucks on these routes, demonstrating notable fuel savings through platooning. As coverage expands, fleet operators benefit from data feeds that enhance route planning and safety, driving considerable growth in the medium term.
Restraints Impact Analysis*
| Restraint | (~)% Impact on CAGR Forecast | Geographic Relevance | Impact Timeline |
|---|---|---|---|
| Patchwork State-Level AV Regulations | -2.4% | United States, with spillover to Canada | Short term (≤ 2 years) |
| Public Mistrust Intensified by High-Profile Robotaxi Incidents | -1.8% | China, United States, with reputational spillover to global markets | Short term (≤ 2 years) |
| Automotive-Grade AI Chip Shortages and Fab Capacity Constraints | -1.5% | Global, most acute in North America and Europe | Medium term (2-4 years) |
| High-Definition Map Maintenance Costs | -1.2% | India, Southeast Asia, South America, Middle East | Long term (≥ 4 years) |
| Source: Mordor Intelligence | |||
Patchwork State-Level AV Regulations in the United States Delay Commercial Scale
There is no single federal framework governing autonomous vehicles in the United States; therefore, companies must navigate unique rules in each state. California revoked Cruise permits after a pedestrian-dragging event, and Arizona limited commercial services in certain municipalities. This fragmentation leads to duplicative compliance programs and slows interstate freight automation, resulting in a few percentage points of reduced near-term growth.
Public Mistrust Intensified by High-Profile Robotaxi Incidents
Following an incident in San Francisco in late 2023, Cruise suspended its nationwide services. In the following year, Baidu experienced temporary shutdowns in Wuhan, and Pony.ai paused its rides in Guangzhou for a brief period. These events, coupled with heightened media scrutiny and social media backlash, have made regulators more cautious. Due to the reputational damage, there is an anticipated short-term decline in growth until transparency campaigns and safety audits can restore public trust.
*Our forecasts treat driver/restraint impacts as directional, not additive. The impact forecasts reflect baseline growth, mix effects, and variable interactions.
Segment Analysis
By Level of Automation: Rising Level 5 Activity Underlines the Shift to Higher Autonomy
Level 1 driver assistance captured 43.47% of the autonomous (driverless) cars market share in 2025. The segment benefits from mandatory features, such as autonomous emergency braking and lane-keeping assist, which are now standard in entry trims across Europe and China. Level 3 conditional automation is being scaled in premium models following regulatory approvals in Nevada, California, Germany, and Japan. Mercedes-Benz logged 2 million miles on Drive Pilot during 2024, and BMW plans to deploy Highway Assistant in 2026. The segment transition indicates hardware commoditization and the monetization of subscription software.
Level 5 full automation is projected to grow at a 24.39% CAGR through 2031, as robo-taxi fleets in Wuhan, Phoenix, and Tokyo enlarge service areas. The autonomous (driverless) cars market observes operators amortizing sensor suites across high daily utilization, turning fixed assets into revenue generators for up to 18 hours per day. Level 4 deployments in middle-mile freight and shuttle services demonstrate commercial viability in geo-fenced zones. Subscription models in Level 3 vehicles signal recurring revenue potential, while Level 5 fleets redefine the economics of urban mobility.


By Vehicle Type: SUV Real Estate Meets Hatchback Scalability
SUVs and MPVs held 78.81% of the autonomous (driverless) cars market share in 2025 because their larger rooflines and front fascias can comfortably house LiDAR, radar, and camera arrays without aesthetic trade-offs. Waymo’s Jaguar I-PACE and Baidu’s Apollo Moon rely on sport-utility form factors for roomy sensor placement. The autonomous (driverless) cars market will retain SUV dominance, where passenger capacity and sensor heat dissipation are key considerations.
Hatchbacks are forecast to expand at a 25.11% CAGR to 2031 as solid-state LiDAR shrinks below 10 centimeters and compute units fit under compact dashboards. Automakers can bring autonomy to high-volume B-segment platforms, and dense Asian cities favor compact dimensions for easier curb access. Sedans remain relevant where long-range aerodynamics and battery efficiency are essential, as seen in the Tesla Model S and Lucid Air deployments.
By Propulsion Type: BEV Electrical Headroom Gains Momentum
Internal combustion engine models commanded 66.37% of the autonomous (driverless) cars market share in 2025 after manufacturers retrofitted existing platforms with Level 1 and Level 2 features. Yet battery electric vehicles carry surplus electrical capacity that easily powers multi-sensor suites. The autonomous (driverless) cars market size for BEVs is set to accelerate at a 25.01% CAGR through 2031, aided by simplified drive-by-wire architectures. ICE trucks keep a share in long-haul segments until battery energy density and megawatt charging mature.
Hybrid electric vehicles provide interim solutions. However, limited electrical headroom restricts advanced computing, keeping most hybrids at Level 2 capability. BEVs also enable quieter cabins, which boosts robo-taxi passenger comfort and lowers lifecycle maintenance costs by eliminating oil changes and reducing brake wear.
By Mobility Form: Ownership Preference Faces Robo-Taxi Economics
Personal ownership accounted for 74.35% of the autonomous (driverless) cars market share in 2025, as consumers valued customization and immediate availability. Manufacturers monetized autonomy through subscriptions, such as Tesla's Full Self-Driving at USD 199 per month and Mercedes-Benz's Drive Pilot at USD 2,500 annually. The autonomous (driverless) cars market anticipates continued owner adoption in areas with suburban lifestyles and low public transit density.
Shared mobility is forecast to grow at a 25.13% CAGR through 2031 due to strengthening unit economics. Waymo rides in Phoenix already approach ride-hail parity, and Baidu Apollo Go recorded profitability in Wuhan. High utilization spreads capital cost across many revenue miles, enabling fares to fall further. Autonomous shuttles in retirement communities and industrial parks support specialized use cases.
By Component: Hardware Commoditization Shifts Value Toward Software
Hardware represented 55.57% of the autonomous (driverless) cars market share in 2025. LiDAR pricing fell sharply, with Luminar Iris at USD 1,000 and Hesai AT128 below USD 500, signaling ongoing commoditization. Radar modules now cost USD 50-100, and compute modules, such as Mobileye's EyeQ6 Lite, run near USD 200. The autonomous (driverless) cars software market is projected to grow rapidly, with a robust CAGR of 25.07% through 2031, as perception, mapping, and planning algorithms can be updated over-the-air.
Waymo demonstrates exceptional accuracy in detecting pedestrians from a significant distance. Meanwhile, Mobileye leverages an extensive network, sourcing mapping data from a vast number of vehicles to refresh road updates almost instantaneously. Additionally, services like sensor calibration and remote operations are increasingly serving as a crucial link, seamlessly connecting hardware integration with algorithm deployment.
Geography Analysis
North America generated 38.71% of the autonomous (driverless) cars market share in 2025. Waymo operated more than a lakh weekly rides across four United States cities, and Tesla enrolled multiple vehicles in its supervised Full Self-Driving program. Regulatory fragmentation remains a hurdle after California revoked Cruise's permits; however, federal spending on V2X roadside units supports autonomous freight deployment on interstate corridors. Canada allows Level 4 testing without safety drivers in Ontario and Quebec, but its smaller addressable fleet tempers near-term volume.
Asia Pacific is projected to register a 25.05% CAGR through 2031. Baidu Apollo Go crossed the 6 million ride milestone, and Pony.ai plus AutoX expanded fleets in Beijing, Guangzhou, and Shenzhen. Japan’s Road Traffic Act revision allows Level 4 vehicles to operate within geofenced districts, enabling Toyota's pilots in Tokyo’s Odaiba and Nissan's trials in Yokohama. India remains nascent until HD mapping density improves and a clear regulatory framework emerges, while South Korea grants Level 4 permits for autonomous buses on dedicated lanes in Sejong City.
Europe benefits from the General Safety Regulation that mandates Level 2 features as standard. Mercedes-Benz launched Drive Pilot in Germany in 2024, followed by Nevada and California. BMW targets a Level 3 rollout by 2026. Fleet decarbonization rules are accelerating the adoption of autonomous electric trucks. Einride has deployed 200 driverless trucks across Germany, the Netherlands, and Sweden, while Volvo introduced the Vera system for port shuttles. South America and the Middle East pilot niche services, yet sparse HD maps and evolving rules delay broader scale.

Competitive Landscape
Competition remains moderately fragmented. Waymo operates a fleet-first model, deploying a significant number of Jaguar I-PACE robo-taxis. In contrast, Tesla integrates software into consumer vehicles, capitalizing on subscription monetization. Mobileye secures royalty streams by licensing EyeQ chips and perception software to numerous automakers, eliminating the burden of a capital-intensive fleet. NVIDIA pairs its Thor SoCs with software and cloud simulation, levying annual fees for validation services. Meanwhile, Chinese entities such as Baidu, BYD, and Pony.ai utilize municipal partnerships to expedite permit approvals and secure public funding.
Middle-mile freight emerges as a pivotal opportunity. Aurora Innovation partners with FedEx and Uber Freight on key routes in Texas, while Kodiak Robotics navigates a central corridor connecting Arizona and Texas. Sensor pioneers, such as Aeva and Ouster, are developing frequency-modulated continuous-wave LiDAR systems equipped with native velocity data, thereby reducing computational demands. Patent filings reveal distinct focuses: Waymo emphasizes sensor fusion and path planning, whereas Tesla zeroes in on neural network training and over-the-air updates.
Tier-one suppliers, including Continental, Bosch, and Aptiv, offer safety-certified integration services, a feat challenging for smaller startups to replicate economically. With compliance to ISO 26262 and UN R157 setting the baseline, younger software firms are increasingly partnering with established component suppliers to scale validation. As the decade progresses, firms adept at merging data network effects, regulatory know-how, and capital efficiency are poised for market consolidation.
Autonomous (Driverless) Cars Industry Leaders
Tesla, Inc.
Volkswagen AG
Toyota Motor Corporation
Mercedes-Benz Group AG
BYD Auto Co., Ltd.
- *Disclaimer: Major Players sorted in no particular order

Recent Industry Developments
- October 2025: Lucid Group entered a strategic alliance with NVIDIA to deploy the DRIVE AGX Thor platform in future models, aiming for consumer-owned Level 4 autonomous electric vehicles.
- May 2025: Uber and WeRide announced plans to expand their joint autonomous operations to 15 cities within the next two years. The expansion underscores the growing strategic alignment between ride-hailing and dedicated AV software providers.
- May 2025: Waymo received clearance from the California Public Utilities Commission to extend autonomous ride-hailing across the wider San Francisco Bay Area after submitting an updated safety plan.


Research Methodology Framework and Report Scope
Market Definitions and Key Coverage
Our study treats the global autonomous-car market as revenue generated from the factory sale of passenger and light commercial vehicles equipped with Society of Automotive Engineers (SAE) Level 3 through Level 5 automation hardware, software, and integrated services. Vehicles restricted to Level 0-2 driver assistance are tracked only as feeder data for penetration analysis.
Scope exclusion: aftermarket retrofit kits and off-road specialty vehicles are not counted.
Segmentation Overview
- By Level of Automation
- Level 1- Driver Assistance
- Level 2 - Partial Automation
- Level 3 - Conditional Automation
- Level 4 - High Automation
- Level 5 - Full Automation
- By Vehicle Type
- Hatchbacks
- Sedans
- Sport Utility Vehicles (SUVs) and Multi-Purpose Vehicles (MPVs)
- By Propulsion Type
- Internal Combustion Engine (ICE)
- Battery Electric Vehicles (BEV)
- Hybrid Electric Vehicles (HEV)
- By Mobility Form
- Personal Ownership
- Shared Mobility (Robo-Taxi, Shuttle)
- By Component
- Hardware
- Sensors (LiDAR, RADAR, Cameras, Ultrasonic, IMU)
- Computing Platforms (SoCs, GPUs)
- Actuators and Control Systems
- Software
- Perception and Planning Suites
- Mapping and Localization Engines
- Driver Monitoring and HMI
- Services
- Integration and Validation
- Remote Operation and Tele-operation
- Hardware
- By Geography
- North America
- United States
- Canada
- Rest of North America
- South America
- Brazil
- Argentina
- Rest of South America
- Europe
- Germany
- United Kingdom
- France
- Italy
- Spain
- Rest of Europe
- Asia Pacific
- China
- India
- Japan
- South Korea
- Rest of Asia Pacific
- Middle East and Africa
- United Arab Emirates
- Saudi Arabia
- South Africa
- Turkey
- Rest of Middle East and Africa
- North America
Detailed Research Methodology and Data Validation
Primary Research
Multiple touch points with OEM autonomy program leads, LiDAR chipset chiefs, fleet operators in China, Europe, and the United States, plus regulators vetting UN R157 pilots, allow us to verify deployment timetables, average selling prices, and risk adjustment factors; these conversations close data gaps uncovered during desk work and refine regional adoption curves.
Desk Research
Mordor analysts start with curated public datasets such as OICA production volumes, NHTSA Automated Vehicle STEP filings, UNECE WP.29 type approval registers, and China MIIT homologation lists, which signal legitimate L3-L5 launches. We enrich these with trade association dashboards (SAE, ACEA, ITS America), import-export logs from Volza, and patent clusters extracted via Questel that spotlight sensor fusion breakthroughs. Company 10-Ks and investor decks then anchor pricing corridors for LiDAR, domain controllers, and AI software stacks. Select paid libraries, D&B Hoovers for OEM financials and Dow Jones Factiva for deal flow, round out the desk work. This inventory is illustrative rather than exhaustive.
Market-Sizing & Forecasting
We apply a top-down build: global light vehicle output is multiplied by region-specific autonomy-ready penetration rates, themselves modeled from regulatory milestones, sensor cost trajectories, and battery electric uptake. Select bottom-up cross checks, sampled ASP x unit roll-ups from five leading OEM programs and robotaxi service miles, help tune totals. Key variables include solid-state LiDAR price decline, GSR2 and NHTSA rule timing, robotaxi pilot kilometers, semiconductor compute density, and BEV share of new sales. Forecasts rely on multivariate regression blended with scenario analysis to capture policy or cost shocks; gaps in supplier data are bridged through weighted averages derived from nearest comparable models.
Data Validation & Update Cycle
Outputs pass a three-layer review: automated variance scans against historic ratios, peer analyst audit, and final senior sign-off. We revisit models annually and trigger interim updates when material events occur, such as regulatory approvals, flagship L4 launches, or >=10% cost swings, ensuring clients receive a fresh baseline at delivery.
Why Mordor's Autonomous Car Baseline Commands Confidence
Published numbers diverge because firms differ on which automation tiers, vehicle classes, and ASP assumptions they include and how frequently they refresh them.
By hewing to an L3-L5 definition, using live cost curves, and updating every twelve months, Mordor delivers a balanced, decision-ready baseline.
Benchmark comparison
| Market Size | Anonymized source | Primary gap driver |
|---|---|---|
| USD 32.89 B (2024) | Mordor Intelligence | - |
| USD 68.09 B (2024) | Global Consultancy A | Includes Level 1-2 units and counts defense contracts, inflating value |
| USD 207.38 B (2024) | Industry Analyst B | Applies list prices, bundles connected car and HD map services |
In sum, while other publishers swing wide due to broader scopes, price multipliers, or slower refresh cadences, our disciplined variable selection and continuous validation give stakeholders a transparent yet conservative reference point they can confidently build plans upon.


Key Questions Answered in the Report
What was the global value of autonomous (driverless) cars in 2026?
The market recorded revenue of USD 220.58 billion in 2026.
How fast is the compound annual growth rate expected through 2031?
The market is projected to expand at a 24.37% CAGR to USD 656.37 billion by 2031.
Which region led the autonomous (driverless) cars market in 2025?
In 2025, North America accounted for 38.71% of the market, driven by active robo-taxi fleets and increasing consumer software subscriptions.
Which propulsion system shows the fastest growth outlook?
Battery electric vehicles are forecast to grow at a 25.01% CAGR because their electrical architectures match autonomous system requirements.
What is the biggest regulatory tailwind for adoption?
The European General Safety Regulation, effective July 2024, makes Level 2 driver-assistance features mandatory, accelerating sensor install rates.
Where are robo-taxis scaling most rapidly?
Chinese cities such as Wuhan, Beijing, and Shenzhen show the highest near-term fleet growth and permit issuance.
Page last updated on:


