Tissue Clearing Market Size and Share
Market Overview
| Study Period | 2019 - 2030 |
|---|---|
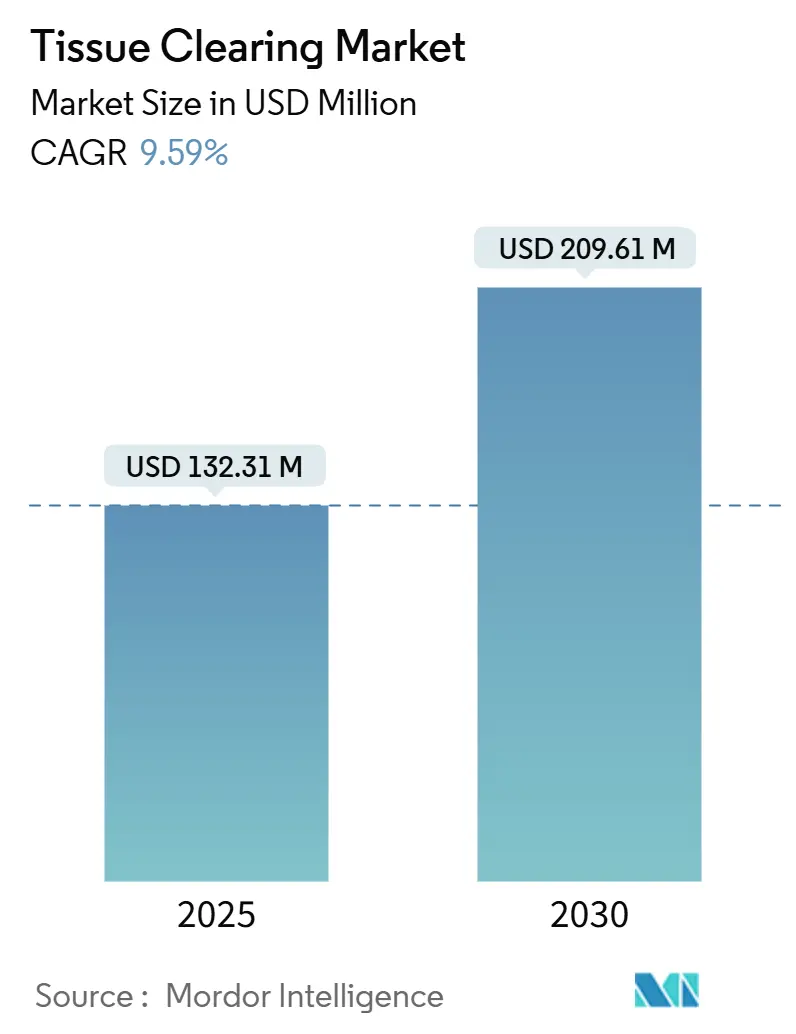
| Market Size (2025) | USD 132.31 Million |
| Market Size (2030) | USD 209.61 Million |
| Growth Rate (2025 - 2030) | 9.59% CAGR |
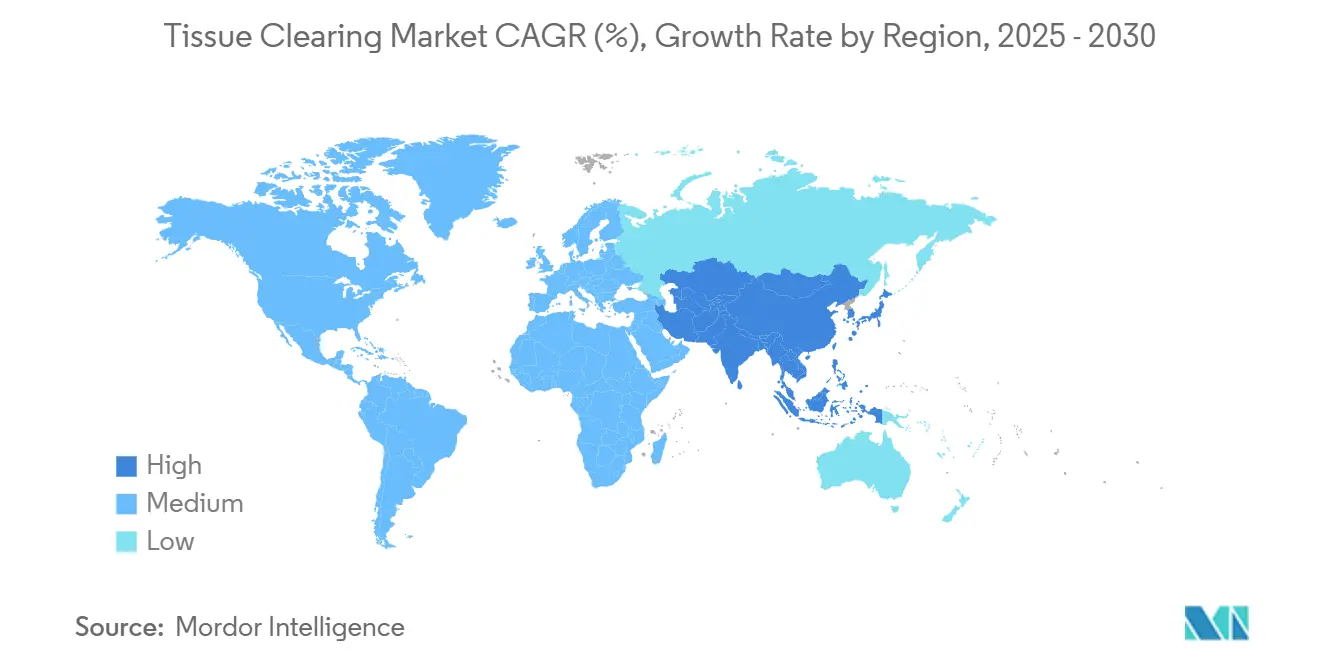
| Fastest Growing Market | Asia Pacific |
| Largest Market | North America |
| Market Concentration | Medium |
Major Players *Disclaimer: Major Players sorted in no particular order Image © Mordor Intelligence. Reuse requires attribution under CC BY 4.0. | |
Tissue Clearing Market Analysis by Mordor Intelligence
The tissue clearing market size stood at USD 132.31 million in 2025 and is forecast to reach USD 209.16 million by 2030, advancing at a 9.59% CAGR during the period. Strong federal funding, notably the NIH BRAIN Initiative’s USD 150 million commitment to large-scale connectivity mapping, propels both academic and commercial adoption.[1]National Institutes of Health, “NIH BRAIN Initiative awards new projects to develop innovative brain mapping technologies,” braininitiative.nih.gov Growing convergence between sophisticated clearing chemistries and next-generation light-sheet microscopes keeps capital equipment replacement cycles brisk while fueling recurring demand for reagents, software, and consumables. Wider use of three-dimensional pathology in oncology, organoid research, and multi-omics workflows underscores a clear pivot away from traditional 2-D histology toward whole-organ visualization. Regulatory signals—such as the U.S. Food and Drug Administration’s device classification for digital pathology software—reinforce the market’s clinical trajectory.[2]U.S. Food and Drug Administration, “21 CFR 864.3750—Software algorithm device to assist users in digital pathology,” ecfr.gov Regionally, North America retains scale advantages through entrenched academic–industry networks, whereas Asia-Pacific delivers the highest incremental volume on the back of expanding biotechnology infrastructure.
Key Report Takeaways
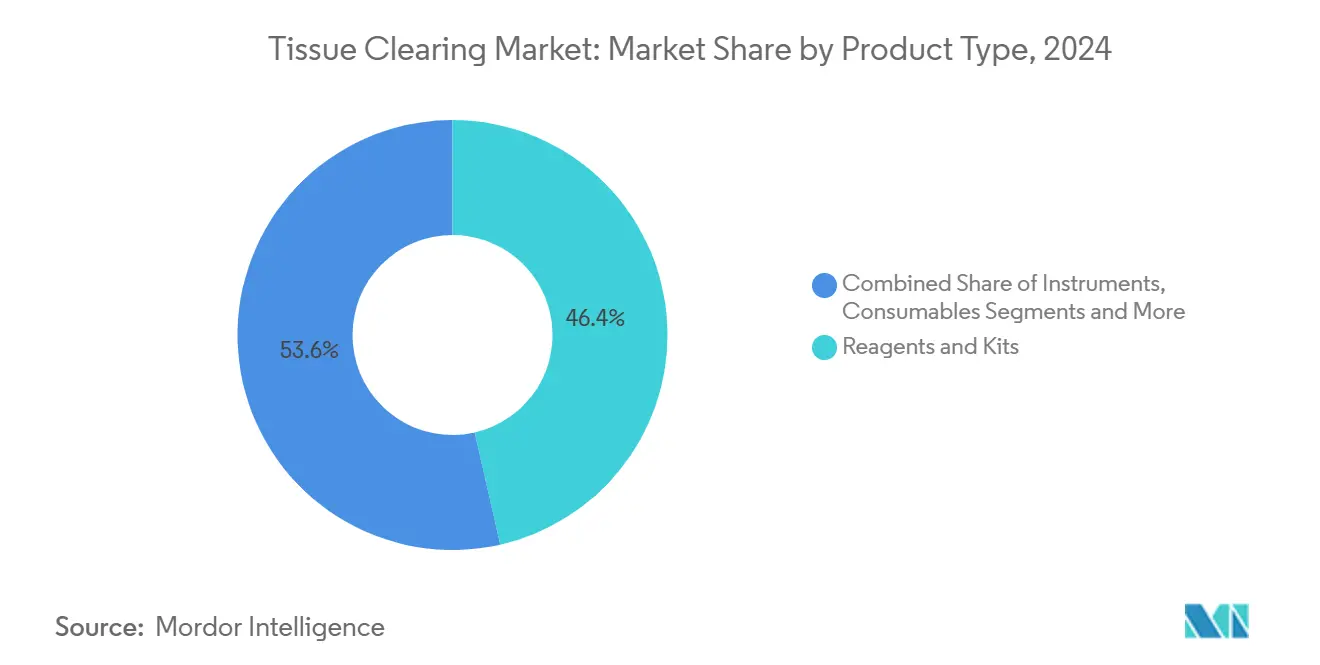
- By product type, Reagents & Kits led with 46.44% share in 2024, while Software & Services is projected to register a 13.69% CAGR through 2030.
- By clearing method, hydrophobic solvent-based protocols accounted for 39.87% share in 2024; hydrogel-based approaches are forecast to expand at a 12.48% CAGR during the same period.
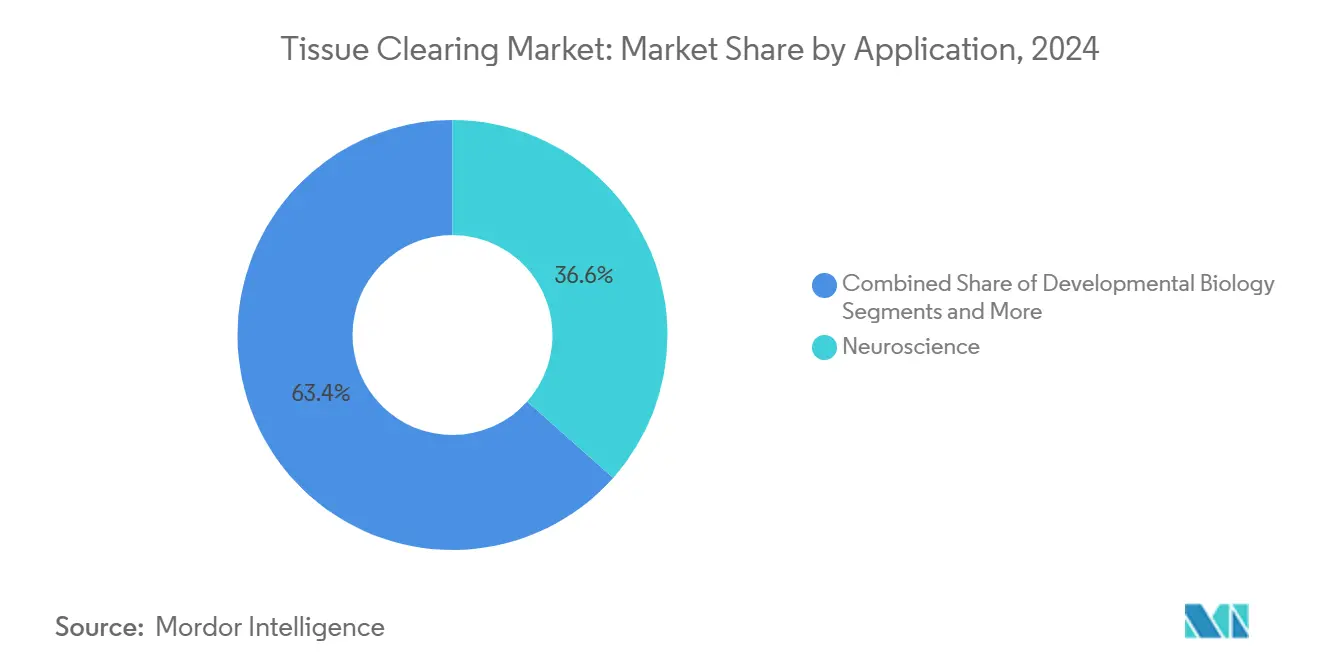
- By application, neuroscience retained 36.57% share in 2024, whereas organoid & stem-cell research is advancing at a 13.78% CAGR to 2030.
- By end user, academic & research institutes captured 42.66% share in 2024, and hospitals & diagnostic laboratories are set to grow at a 12.23% CAGR.
- By geography, North America dominated with 37.81% share in 2024, while Asia-Pacific is poised for the fastest growth at an 11.44% CAGR.
Global Tissue Clearing Market Trends and Insights
Drivers Impact Analysis*
| Driver | (~) % Impact on CAGR Forecast | Geographic Relevance | Impact Timeline |
|---|---|---|---|
| Rapid Adoption Of Light-Sheet Microscopy Platforms | + 2.1% | Global, with North America & Europe leading | Medium term (2-4 years) |
| Emergence Of Turnkey Clearing-Imaging-Analysis Workflows | + 1.8% | North America & EU, expanding to APAC | Short term (≤ 2 years) |
| Growing 3-D Pathology Demand In Oncology Drug Discovery | + 1.5% | Global, concentrated in pharma hubs | Medium term (2-4 years) |
| Rising Multi-Omics Integration With Cleared-Tissue Datasets | + 1.3% | APAC core, spill-over to North America | Long term (≥ 4 years) |
| National Brain-Mapping Megaproject Funding Waves | + 1.2% | North America, EU, select APAC countries | Long term (≥ 4 years) |
| Expansion Of Organoid & Ex-Vivo Whole-Organ Screening Pipelines | + 1.0% | Global, pharma-concentrated regions | Medium term (2-4 years) |
| Source: Mordor Intelligence | |||
Rapid Adoption Of Light-Sheet Microscopy Platforms
Light-sheet microscopes now image centimeter-scale cleared specimens at sub-cellular resolution, beating the 200 µm depth ceiling common to confocal optics.[3]Jianglai Wu, “Curved light sheet microscopy for centimetre-scale cleared tissue imaging,” Nature, nature.com Curved light-sheet architectures trim whole-mouse-brain acquisition time to roughly 40 minutes, and AI-based reconstruction software removes manual stitching. Integration of hardware speed and automated analytics positions light-sheet imaging as the modality of choice in the tissue clearing market, shortening the typical seven-year instrument refresh cycle and deepening reagent pull-through.
Emergence Of Turnkey Clearing-Imaging-Analysis Workflows
Vendors are bundling chemistry, optics, and cloud analytics into cohesive platforms that slash onboarding friction. Translucence Biosystems, for instance, supplies adapters that retrofit existing ZEISS systems for high-refractive-index protocols, allowing labs to avoid full hardware replacement. Protocols such as wildDISCO standardize antibody penetration, and integrated data pipelines give novice users access to deep-learning analytics. By reducing the need for specialist staff, turnkey ecosystems expand penetration into core facilities and smaller institutions.
Growing 3-D Pathology Demand In Oncology Drug Discovery
Pharmaceutical researchers report that 3-D pathology reveals therapeutic response patterns lost in 2-D sections. Open-top light-sheet microscopes enable nondestructive imaging of whole biopsy cores, leaving tissue intact for downstream molecular assays. The U.S. FDA’s digital pathology guidance clarifies the path to clinical approval, further validating investment. Resulting volumetric biomarkers give sponsors richer stratification data, aligning with precision-medicine objectives.
Rising Multi-Omics Integration With Cleared-Tissue Datasets
Algorithms such as VORTEX predict spatial transcriptomes from limited 2-D slices, opening cost-effective multi-omics for entire organs. Coupled with multiplexed immunofluorescence that visualizes 50 + proteins simultaneously, researchers achieve holistic molecular and structural readouts. Advances in expansion microscopy bridge nanoscale and organ-level analysis, enhancing the tissue clearing market’s value proposition for systems biology.
Restraints Impact Analysis*
| Restraint | (~) % Impact on CAGR Forecast | Geographic Relevance | Impact Timeline |
|---|---|---|---|
| Steep Capital Investment For Cleared-Tissue Imaging Systems | -1.8% | Global, more pronounced in emerging markets | Short term (≤ 2 years) |
| Limited Throughput Of Current Solvent-Based Protocols For Clinical Labs | -1.2% | Global, acute in high-volume clinical settings | Medium term (2-4 years) |
| Fluorescence Quenching & Antibody Compatibility Issues | -0.9% | Global, research-focused institutions | Short term (≤ 2 years) |
| Nascent Regulatory Standards For 3-D Digital Pathology Submissions | -0.6% | North America & EU regulatory jurisdictions | Long term (≥ 4 years) |
| Source: Mordor Intelligence | |||
Steep Capital Investment For Cleared-Tissue Imaging Systems
Commercial light-sheet setups cost USD 200,000–800,000, limiting uptake outside well-funded centers. Open-source alternatives such as descSPIM lower entry tags to USD 20,000–50,000 but require engineering know-how. Recurring expenses for service contracts, specialized objectives, and refractive-index-matched immersion media extend payback periods, particularly in emerging economies.
Limited Throughput Of Current Solvent-Based Protocols For Clinical Labs
Standard solvent clearing consumes 24–72 hours—too slow for pathology labs that must deliver same-day diagnoses. Magnetohydrodynamic acceleration trims cycle time yet adds specialized hardware requirements. Manual reagent exchanges further cap daily specimen volume, raising labor overhead.
*Our forecasts treat driver/restraint impacts as directional, not additive. The impact forecasts reflect baseline growth, mix effects, and variable interactions.
Segment Analysis
By Product Type: Software Integration Drives Market Evolution
Reagents & Kits dominated the tissue clearing market size at USD 61.4 million in 2024, representing 46.44% share, buoyed by routine purchases for hydrophobic and hydrogel protocols. Software & Services, however, is outpacing all categories at 13.69% CAGR through 2030. Automated analytics platforms now address the primary bottleneck—data processing—by delivering cloud-based segmentation, stitching, and quantitation. As a result, the tissue clearing market increasingly rewards vendors that pair consumables with user-friendly informatics suites.
The software boom reflects democratization. AI algorithms cut tissue microarray analysis time to 7.7% of manual workflows. Laboratories without in-house bioinformatics teams thus leapfrog traditional barriers. Expect progressive bundling between chemistry suppliers and image-analysis providers, cementing integrated ecosystems across academia, pharma, and diagnostics.


By Clearing Method: Hydrogel Protocols Reshape Technical Landscape
Hydrophobic solvent systems still command 39.87% share, yet hydrogel methods are growing at 12.48% CAGR, eroding the incumbent position. Hydrogel formulations preserve ultrastructure and permit reversible clearing, supporting repetitive staining cycles critical for longitudinal studies. The tissue clearing market size tied to hydrogel protocols is projected to more than double by 2030, narrowing the gap with solvents.
Emerging hybrid chemistries combine solvent speed with hydrogel gentleness, appealing to researchers balancing throughput and morphology. Biomimetic collagen hydrogels reinforce tissue integrity, facilitating organoid assays that cannot tolerate harsh solvents. As clinical users prioritize sample fidelity, hydrogel adoption will accelerate beyond research into hospital workflows.
By Application: Organoid Research Accelerates Beyond Traditional Neuroscience
Neuroscience retained 36.57% share of tissue clearing market size in 2024, reflecting the technology’s roots in brain mapping. Nonetheless, organoid & stem-cell research is advancing at 13.78% CAGR, buoyed by pharmaceutical interest in patient-specific disease models. Volumetric imaging of intestinal organoids, for example, informs inflammatory bowel disease drug pipelines.
Oncology applications also gain momentum via 3-D tumor reconstructions that capture spatial heterogeneity linked to therapeutic resistance. The tissue clearing market thus expands into translational domains where volumetric biomarkers and functional readouts underpin precision-medicine initiatives.
By End User: Clinical Translation Accelerates Hospital Adoption
Academic & research institutes contributed 42.66% of tissue clearing market share in 2024, yet hospitals & diagnostic labs show the steepest curve at 12.23% CAGR. FDA 510(k) clearance for PathPresenter’s clinical viewer underscores growing regulatory comfort with digital pathology. As reimbursement frameworks crystallize, hospitals invest in integrated clearing-imaging suites to reduce repeat biopsy rates and turn around complex cases faster.
Contract research organizations pick up overflow, offering cleared-tissue imaging as a fee-for-service model that alleviates capital burdens for smaller biotechs. Pharmaceutical companies remain steady adopters, linking 3-D datasets to multi-omics pipelines for drug development.
Geography Analysis
North America accounted for 37.81% of tissue clearing market size in 2024, anchored by NIH megaprojects and FDA digital pathology guidance. Dense biotech clusters in Boston, San Francisco, and San Diego foster rapid lab-to-market translation, while Canada’s Brain Canada initiative adds complementary grant streams. Mexican facilities supply cost-competitive reagents, tightening regional supply chains.
Europe ranks second, underpinned by Horizon-Europe funding and pan-EU regulatory harmonization. Germany, the United Kingdom, and France spearhead adoption; Italy and Spain provide niche strengths in regenerative medicine and developmental biology imaging. Initiatives such as NanoBright’s “molecular lantern” for non-invasive brain analysis demonstrate European innovation depth.
Asia-Pacific is the fastest-growing region at 11.44% CAGR. China scales quickly on government life-science subsidies and an expanding CRO ecosystem. Japanese teams advance nanobody-based 3-D immunohistochemistry, while South Korea leverages advanced manufacturing to localize objective lenses and optical components. India and Australia round out the landscape with targeted neuroscience and developmental-biology consortia.

Competitive Landscape
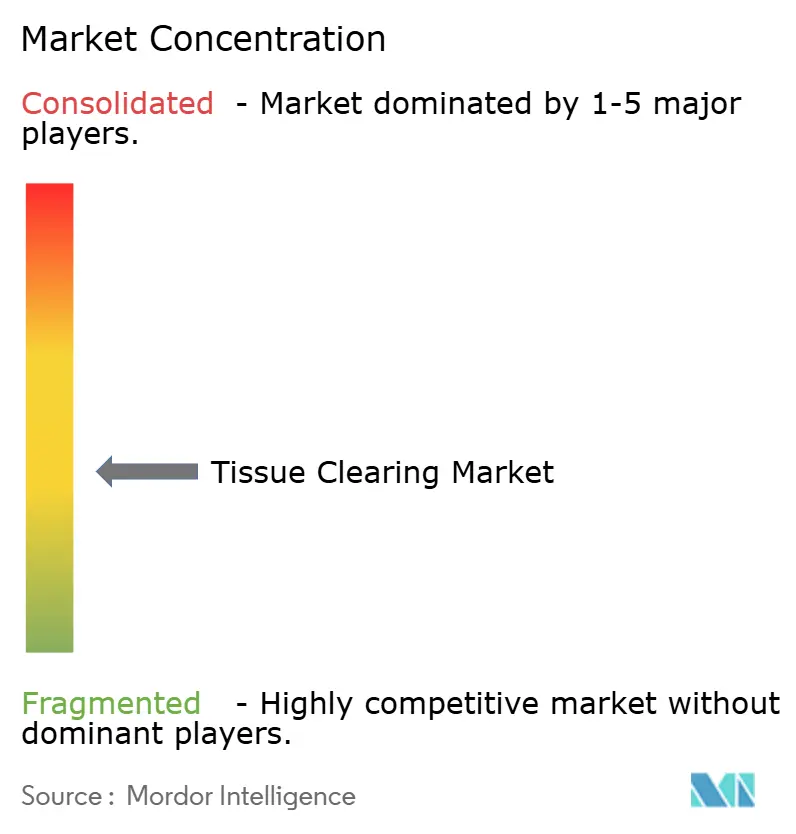
The market remains moderately fragmented. Optical heavyweights such as ZEISS and Bruker adapt light-sheet systems for cleared samples, yet agile specialists like Lightspeed Microscopy earn venture backing to commercialize open-top platforms. Competitive advantage shifts toward vendors that integrate chemistry, imaging, and analytics in turnkey workflows.
Intellectual-property filings reveal heightened activity around automated processing, AI-driven segmentation, and standardized hydrogel chemistries. Open-source initiatives, typified by descSPIM, inject price pressure, compelling premium brands to differentiate through validated protocols, regulatory support, and global service networks. Collaborative agreements between cloud-analytics startups and reagent vendors underscore a trend toward platform ecosystems rather than stand-alone products.
Early-stage firms focus on workflow automation, promising 20–30% gains in slide quality and up to 90% error reduction through digital-twin pathology labs. As hospitals embrace integrated diagnostics, strategic partnerships and targeted acquisitions will likely intensify, consolidating a landscape now characterized by mid-double-digit numbers of active suppliers.
Tissue Clearing Industry Leaders
Danaher
LifeCanvas Technologies
Miltenyi Biotec
Thermo Fisher Scientific
ClearLight Biotechnologies
- *Disclaimer: Major Players sorted in no particular order

Recent Industry Developments
- June 2025: PathPresenter received FDA 510(k) clearance for its Clinical Viewer, enabling primary diagnosis with the Hamamatsu NanoZoomer S360MD slide scanner and paving the way for advanced digital pathology in routine diagnostics.
- April 2025: Leinco Technologies launched the ADAPT-3D Tissue Clearing Kit, a reagent suite designed to enhance fluorescence depth imaging for research laboratories.


Global Tissue Clearing Market Report Scope
| Reagents & Kits |
| Instruments |
| Consumables |
| Software & Services |
| Hydrophobic / Solvent-based |
| Hydrophilic / Aqueous-based |
| Hydrogel-based |
| Hybrid & Emerging Protocols |
| Neuroscience |
| Oncology & Cancer Research |
| Developmental Biology |
| Immunology & Inflammation |
| Organoid & Stem-Cell Research |
| Pathology & Diagnostics |
| Academic & Research Institutes |
| Pharmaceutical & Biotechnology Companies |
| Contract Research Organizations (CROs) |
| Hospitals & Diagnostic Laboratories |
| North America | United States |
| Canada | |
| Mexico | |
| Europe | Germany |
| United Kingdom | |
| France | |
| Italy | |
| Spain | |
| Rest of Europe | |
| Asia-Pacific | China |
| Japan | |
| India | |
| Australia | |
| South Korea | |
| Rest of Asia-Pacific | |
| Middle East and Africa | GCC |
| South Africa | |
| Rest of Middle East and Africa | |
| South America | Brazil |
| Argentina | |
| Rest of South America |
| By Product Type | Reagents & Kits | |
| Instruments | ||
| Consumables | ||
| Software & Services | ||
| By Clearing Method | Hydrophobic / Solvent-based | |
| Hydrophilic / Aqueous-based | ||
| Hydrogel-based | ||
| Hybrid & Emerging Protocols | ||
| By Application | Neuroscience | |
| Oncology & Cancer Research | ||
| Developmental Biology | ||
| Immunology & Inflammation | ||
| Organoid & Stem-Cell Research | ||
| Pathology & Diagnostics | ||
| By End User | Academic & Research Institutes | |
| Pharmaceutical & Biotechnology Companies | ||
| Contract Research Organizations (CROs) | ||
| Hospitals & Diagnostic Laboratories | ||
| By Geography | North America | United States |
| Canada | ||
| Mexico | ||
| Europe | Germany | |
| United Kingdom | ||
| France | ||
| Italy | ||
| Spain | ||
| Rest of Europe | ||
| Asia-Pacific | China | |
| Japan | ||
| India | ||
| Australia | ||
| South Korea | ||
| Rest of Asia-Pacific | ||
| Middle East and Africa | GCC | |
| South Africa | ||
| Rest of Middle East and Africa | ||
| South America | Brazil | |
| Argentina | ||
| Rest of South America | ||


Key Questions Answered in the Report
What is the projected value of the tissue clearing market by 2030?
The tissue clearing market is forecast to reach USD 209.16 million by 2030, expanding at a 9.59% CAGR.
Which product category is growing fastest within tissue clearing?
Software & Services is advancing at a 13.69% CAGR as laboratories prioritize turnkey data-analysis solutions.
Why are hydrogel clearing protocols gaining traction?
Hydrogel methods preserve tissue integrity and support reversible clearing, driving a 12.48% CAGR that challenges solvent-based dominance.
Which application area is seeing the highest growth?
Organoid & stem-cell research leads with a 13.78% CAGR, reflecting pharma’s shift toward physiologically relevant 3-D models.
Which region is expanding most rapidly?
Asia-Pacific shows the fastest growth at 11.44% CAGR, propelled by large-scale biotechnology investments in China and Japan.
Page last updated on:


