Cybersecurity As A Service Market Size and Share
Market Overview
| Study Period | 2020 - 2031 |
|---|---|
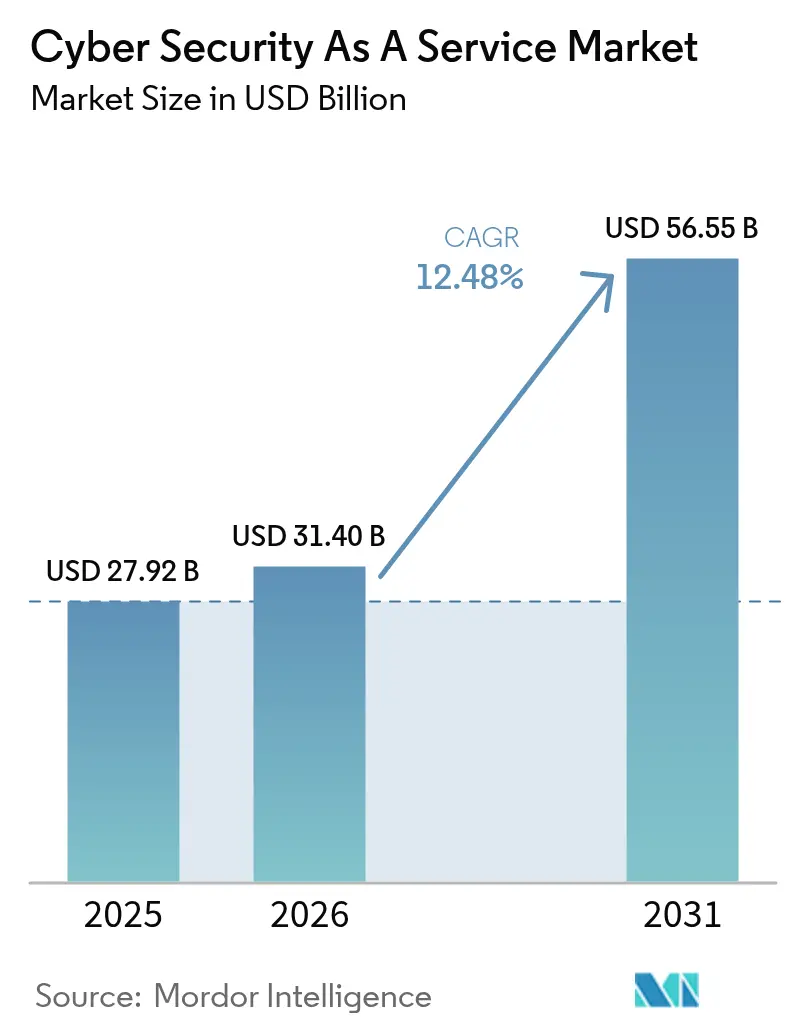
| Market Size (2026) | USD 31.4 Billion |
| Market Size (2031) | USD 56.55 Billion |
| Growth Rate (2026 - 2031) | 12.48% CAGR |
| Fastest Growing Market | Asia Pacific |
| Largest Market | North America |
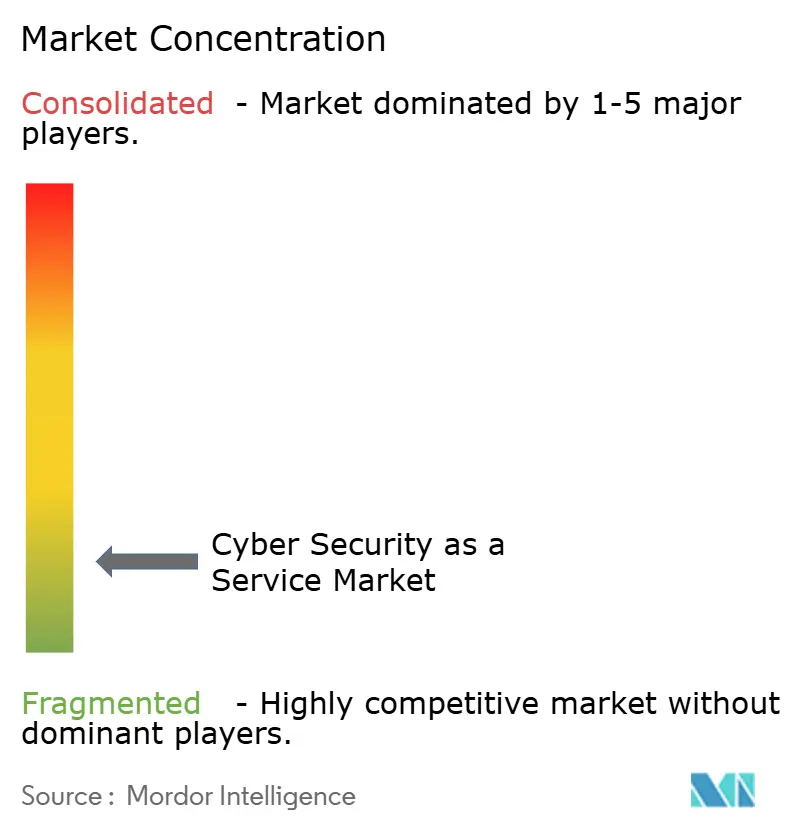
| Market Concentration | Low |
Major Players *Disclaimer: Major Players sorted in no particular order Image © Mordor Intelligence. Reuse requires attribution under CC BY 4.0. | |
Cybersecurity As A Service Market Analysis by Mordor Intelligence
The Cybersecurity As A Service Market size is expected to grow from USD 27.92 billion in 2025 to USD 31.4 billion in 2026 and is forecast to reach USD 56.55 billion by 2031 at 12.48% CAGR over 2026-2031. Rising breach costs averaging USD 4.88 million per incident in 2024 and the need for specialized expertise amid a 4 million-person skills gap are pushing organizations toward external security partners.[1]IBM, “Cost of Data Breaches: The Business Case for Security AI Automation,” IBM.com Large enterprises still drive spending, yet small and medium enterprises are accelerating service adoption as cloud and remote-work models magnify attack surfaces. Heightened regulatory scrutiny from frameworks such as NIS2 and growing cyber-insurance requirements are embedding 24/7 threat monitoring into core governance practices. Competitive intensity has intensified as platform-driven providers consolidate capabilities through landmark deals, while cloud hyperscalers weave native protections deeper into their ecosystems.
Key Report Takeaways
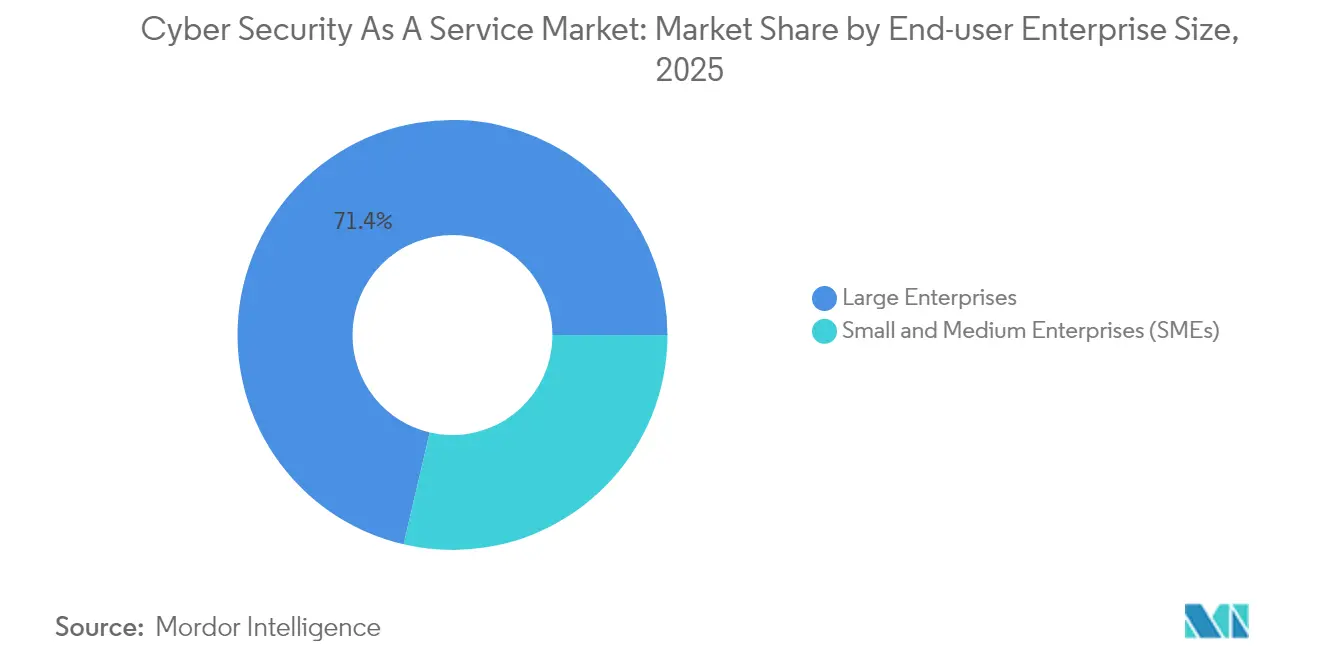
- By end-user enterprise size, large enterprises held 71.35% of the Cybersecurity As A Service Market share in 2025, whereas SMEs are forecast to grow at 13.98% CAGR through 2031.
- By service model, managed detection and response led with 29.10% share in 2025; SOC as a Service is advancing at 16.95% CAGR to 2031.
- By security type, risk and vulnerability assessment accounted for a 30.85% share of the Cybersecurity As A Service Market size in 2025, while threat intelligence and analytics are on a 14.35% CAGR trajectory.
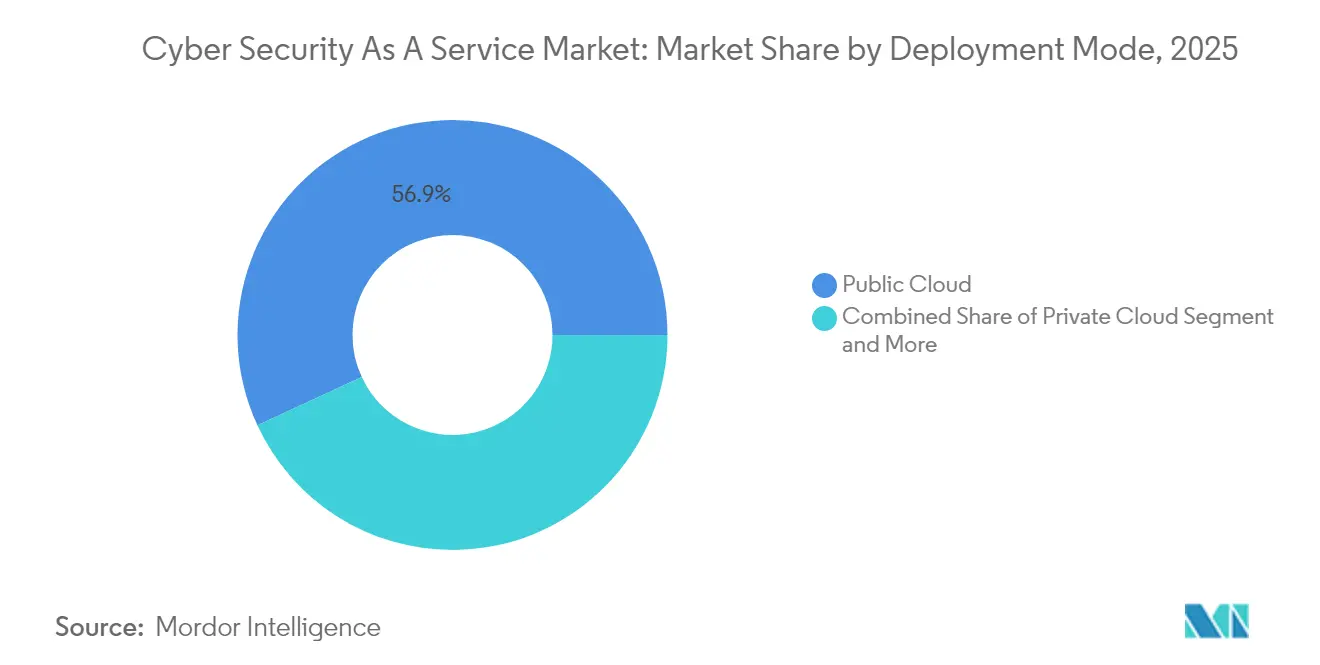
- By deployment mode, public cloud captured 56.90% revenue in 2025; hybrid cloud is expanding at a 12.62% CAGR through 2031.
- By end-user industry, BFSI recorded a 24.40% share in 2025, whereas healthcare is set to widen at 13.55% CAGR to 2031.
- By geography, North America commanded 34.10% share in 2025; Asia Pacific is forecast to register the highest 14.95% CAGR to 2031.
Note: Market size and forecast figures in this report are generated using Mordor Intelligence’s proprietary estimation framework, updated with the latest available data and insights as of 2026.
Global Cybersecurity As A Service Market Trends and Insights
Drivers Impact Analysis*
| Driver | (~) % Impact on CAGR Forecast | Geographic Relevance | Impact Timeline |
|---|---|---|---|
| Rising cost and frequency of data breaches | +3.2% | Global, highest in North America and EU | Medium term (2-4 years) |
| SME demand amid cyber-skills shortage | +2.8% | Global, strong in Asia-Pacific and emerging markets | Long term (≥ 4 years) |
| Cloud and remote-work attack-surface expansion | +2.5% | Global, concentrated in digitally mature regions | Short term (≤ 2 years) |
| Cyber-insurance clauses mandating monitoring | +1.9% | North America and EU core, expanding to Asia Pacific | Medium term (2-4 years) |
| Identity-centric security for API/M2M | +1.7% | Early adoption in North America and EU | Long term (≥ 4 years) |
| NIS2 24×7 SOC requirements | +1.4% | EU primary with spillover elsewhere | Short term (≤ 2 years) |
| Source: Mordor Intelligence | |||
Rising Cost and Frequency of Data Breaches Drive Service Adoption
Average breach expenses climbed to USD 4.88 million in 2024, a 10% year-over-year jump, pressuring boards to fund continuous monitoring and rapid containment services.[2]SecurityWeek, “Cost of Data Breach in 2024: USD 4.88 Million, Says Latest IBM Study,” SecurityWeek.com Healthcare breaches cost USD 9.77 million and represented 79% of reported incidents, while AI- and automation-enabled organizations saved USD 2.2 million and shortened containment by 54 days. As 70% of breached firms experience material business disruption, regulatory frameworks such as ISO 27001 elevate real-time detection and response to a baseline requirement.
SME Cybersecurity Demand Accelerates Amid Skills Crisis
SMEs suffer 43% of cyberattacks, yet 18% still lack formal defenses; a further 44% rely on basic tools.[3]OECD, “SME Digitalisation to Manage Shocks and Transitions,” OECD.org With 60% of impacted SMEs folding within six months, service providers are tailoring subscription-based offerings that bundle 24/7 SOC oversight, compliance guidance, and cyber-insurance facilitation. Government schemes like the U.K.’s Cyber Essentials and lower-cost SOC bundles priced from USD 10,000 per month are expanding addressable demand.
Cloud Migration Expands Attack Surfaces and Service Requirements
Ninety-one percent of organizations report blind spots from fragmented toolsets, and 54% cite complexity as their largest cloud-data challenge.[4]Palo Alto Networks, “2024 State of Cloud Native Security Report,” PaloAltoNetworks.com Machine identities now outnumber human ones by 40:1 in AI-driven estates, elevating identity-centric security to a strategic imperative. Providers offering unified visibility across hybrid estates are gaining share, especially where compliance frameworks stipulate continuous control validation.
Cyber-Insurance Evolution Mandates Continuous Monitoring
Underwriters increasingly tie policy eligibility to evidence of 24/7 monitoring, MFA, and incident-response playbooks. Although U.S. cyber-insurance rates fell 5% in Q4 2024, carriers tightened technical prerequisites, driving organizations toward managed detection and response contracts bundled with breach-response retainers.
Restraints Impact Analysis*
| Restraint | (~) % Impact on CAGR Forecast | Geographic Relevance | Impact Timeline |
|---|---|---|---|
| Data-sovereignty / vendor-lock-in concerns | -1.8% | EU and Asia-Pacific core, regulatory spillover | Long term (≥ 4 years) |
| Visibility gaps in multi-cloud environments | -1.5% | Global, acute in North America and EU | Medium term (2-4 years) |
| Targeted attacks on MSSP supply chain | -1.2% | Global | Short term (≤ 2 years) |
| Talent-cost inflation eroding margins | -0.9% | North America and EU primary | Medium term (2-4 years) |
| Source: Mordor Intelligence | |||
Data Sovereignty Concerns Create Service Delivery Challenges
NIS2 pushes 350,000 European entities to tighten supply-chain oversight, compelling providers to host telemetry inside the bloc to satisfy residency mandates. Similar rules in Singapore and India force global MSSPs to replicate infrastructure regionally, raising capex and complicating threat-intelligence sharing. Enterprises wary of vendor lock-in increasingly demand contractual exit clauses and open-standards telemetry to mitigate switching barriers.
Multi-Cloud Visibility Gaps Undermine Service Effectiveness
Fragmented tooling leaves 91% of businesses with blind spots, and 64% report more breaches after rushed cloud migrations. Service partners lacking unified telemetry struggle to enforce policy consistency across AWS, Azure, Google Cloud, and on-premise estates. Providers that integrate cloud-native application protection platforms with legacy SIEM data are winning contracts by demonstrating end-to-end visibility.
*Our forecasts treat driver/restraint impacts as directional, not additive. The impact forecasts reflect baseline growth, mix effects, and variable interactions.
Segment Analysis
By End-user Enterprise Size: Enterprise Dominance Meets SME Acceleration
Large enterprises accounted for 71.35% of Cybersecurity As A Service Market share in 2025, driven by budgets that support multi-layered MDR, threat-hunting, and compliance orchestration engagements. Contract values routinely surpass USD 500,000 per year for holistic coverage that includes incident-response retainers and breach-insurance alignment. The SME segment, however, is forecast to grow at 13.98% CAGR, fueled by turnkey SOC-as-a-Service bundles and regulatory programs that extend NIS2 obligations to smaller supply-chain partners.
Cost-effective cloud delivery models, flat-fee subscription pricing, and insurer-linked discounts are lowering barriers for SMEs, especially in Asia Pacific, where SMB cloud adoption is surging. Providers tailoring language-localized dashboards and compliance templates are capturing outsized share among first-time buyers of managed security services.


By Service Model: MDR Leadership Amid SOC Service Surge
Managed detection and response held 29.10% of the Cybersecurity As A Service Market size in 2025, reflecting enterprises’ preference for proactive threat-hunting fused with rapid remediation. CrowdStrike’s platform model illustrates competitive advantage achieved through endpoint, identity, and cloud telemetry convergence. SOC as a Service is expanding at 16.95% CAGR, supported by AI-driven triage and pay-as-you-grow licensing that resonates with resource-constrained organizations.
Identity-as-a-Service is also climbing as machine-to-machine traffic explodes in AI workflows, prompting firms to outsource credential lifecycle management. Vulnerability testing and compliance assessment remain foundational, yet differentiation now hinges on continuous validation capabilities that map directly to insurance and board-level risk metrics.
By Security Type: Risk Assessment Leadership Shifts Toward Intelligence Analytics
Risk and Vulnerability Assessment controlled 30.85% of revenue in 2025, driven by mandatory baseline audits under ISO 27001, SOC 2, and sectoral rules such as DORA for financial institutions. However, threat intelligence and analytics is the fastest-growing at a 14.35% CAGR as sophisticated adversaries turn to AI-enabled attack methods. Organizations deploying AI-embedded analytics report USD 2.2 million lower breach costs, underscoring ROI for predictive defense.
Continuous monitoring and encryption services are gaining steady traction as insurers tie premium discounts to evidence of around-the-clock oversight and data-at-rest protection. Identity management, incident response, and centralized logging services round out layered offerings designed to close dwell-time gaps now averaging 258 days globally.
By Deployment Mode: Public Cloud Dominance Faces Hybrid Challenge
Public cloud captured 56.90% of Cybersecurity As A Service Market share in 2025, buoyed by hyperscalers bundling native security tools within broader IaaS contracts. Yet hybrid cloud is projected to widen at 12.62% CAGR because sovereignty rules and latency-sensitive workloads force enterprises to retain sensitive data on-premise while tapping cloud analytics.
Providers with cloud-agnostic control planes that normalize logs across Kubernetes clusters and legacy data centers are differentiating. Private cloud remains essential in regulated verticals like healthcare, where breach costs average USD 9.77 million and encryption mandates drive localized hosting.
By End-user Industry: BFSI Leadership Challenged by Healthcare Surge
BFSI firms held 24.40% of 2025 revenue, propelled by stringent DORA standards and above-average breach costs of USD 6.08 million. Banks and insurers adopt layered MDR, fraud analytics, and policy-as-code controls to meet board-level resilience metrics. Healthcare is poised for the quickest expansion at a 13.55% CAGR as ransomware frequency and regulatory fines mount; HIPAA-linked penalties and medical-device vulnerabilities underpin outsourcing to sector-specialist MSSPs.
IT and Telecom operators leverage in-house expertise to co-develop service offerings, while government entities comply with NIS2’s 24/7 SOC directive. Manufacturing, retail, and energy players increasingly procure identity-centric and OT-focused monitoring as digital twins and IIoT deployments widen the perimeter.
Geography Analysis
North America generated 34.10% of 2025 revenue, supported by the world’s highest breach costs U.S. organizations pay USD 9.8 million per incident and by stringent SEC disclosure mandates that prioritize continuous detection and reporting. Spending growth remains healthy as boards favor single-platform vendors that cut tool overlap and simplify audit readiness. Venture capital continues to fund AI-centric disruptors, sustaining a vibrant partner ecosystem.
Asia Pacific is the fastest-growing region, advancing at 14.95% CAGR to 2031 as enterprises rush to secure multi-cloud migrations and online-payment channels. India’s technology expenditure is set to reach INR 5 trillion (USD 60.4 billion) in 2025, stimulating demand for hybrid-cloud security consulting, while the region’s cyber-insurance market grows almost 50% annually. Local regulations ranging from Singapore’s Cybersecurity Act to China’s Personal Information Protection Law are spurring localized SOC buildouts that blend global threat intelligence with in-country data processing.
Europe maintains steady expansion underpinned by NIS2, which extends mandatory 24/7 SOC coverage to roughly 350,000 critical entities. Data-sovereignty sensitivities drive preference for providers that operate regional clouds and support privacy-enhancing technologies. Economic incentives are emerging as insurers lower premiums for organizations demonstrating adherence to ENISA guidance, further embedding service consumption across mid-market and enterprise segments.


Competitive Landscape
The Cybersecurity As A Service Market features moderate concentration. Top providers pursue platform consolidation; Palo Alto Networks alone executed 17 acquisitions since 2018, culminating in its USD 25 billion CyberArk deal that fuses network, cloud, and identity domains. Such breadth appeals to buyers looking to cut vendor count and achieve unified policy engines.
Cloud hyperscalers intensify competition by embedding native protections Microsoft Defender, AWS GuardDuty, and Google Cloud Security Command Center within broader consumption commitments. Their scale pressures independent MSSPs on price, yet specialists respond with sector-specific expertise, zero-trust blueprints, and deep SOC automation to defend margins. AI capabilities now shape differentiation; organizations using automated threat-containment shaved 54 days off response cycles in 2024.
White-space opportunities persist in healthcare and OT-environment security. Firms like Fortinet report 32% annualized growth in security-operations ARR, signaling demand for converged network-plus-SOC propositions. Emerging innovators such as Wiz attract multibillion-dollar bids by refining cloud-native posture management, proving room for disruptive entrants even as incumbents scale through M&A.
Cybersecurity As A Service Industry Leaders
Armor Defense, Inc.
McAfee Inc.
IBM Corporation
Forcepoint LLC
FireEye Inc.
- *Disclaimer: Major Players sorted in no particular order

Recent Industry Developments
- February 2025: DISA Global Solutions breach affected over 3.3 million individuals, underscoring supply-chain exposure within managed services relationships.
- March 2025: IBM altered revenue categories, grouping identity security under its Automation segment to reflect integrated-platform demand.
- May 2025: Kyndryl posted USD 18.2 billion in fiscal-year signings, 46% higher year over year, with security a standout line of business.
- July 2025: Palo Alto Networks agreed to acquire CyberArk for USD 25 billion, the largest cybersecurity buyout on record.


Global Cybersecurity As A Service Market Report Scope
Cyber security refers to preventive techniques utilized to protect and safeguard an organization's information system from cyber warfare espionage and terrorism. Nowadays businesses outsource their cyber security which is known as cyber security as a service (CSaaS). In CSaaS, a team of independent experts is constantly monitoring for unusual behavior on the organization’s systems, warning of threats and keeping the systems patched and backed up.
| Small and Medium Enterprises (SMEs) |
| Large Enterprises |
| Managed Detection and Response (MDR) |
| SOC as a Service |
| Identity and Access Management as a Service |
| Vulnerability and Pen-Test as a Service |
| Compliance and Risk Assessment as a Service |
| Data Loss Prevention as a Service |
| Risk and Vulnerability Assessment |
| Threat Intelligence and Analytics |
| Auditing and Logging |
| Continuous Monitoring and Encryption |
| Identity and Access Management |
| Incident Response and Disaster Recovery aaS |
| Public Cloud |
| Private Cloud |
| Hybrid Cloud |
| BFSI |
| Healthcare and Life Sciences |
| IT and Telecom |
| Government and Defense |
| Energy and Utilities |
| Retail and E-commerce |
| Manufacturing |
| North America | United States | |
| Canada | ||
| Mexico | ||
| South America | Brazil | |
| Argentina | ||
| Rest of South America | ||
| Europe | United Kingdom | |
| Germany | ||
| France | ||
| Russia | ||
| Rest of Europe | ||
| Asia-Pacific | China | |
| India | ||
| Japan | ||
| South Korea | ||
| Rest of Asia-Pacific | ||
| Middle East and Africa | Middle East | GCC |
| Turkey | ||
| Israel | ||
| Rest of Middle East | ||
| Africa | South Africa | |
| Nigeria | ||
| Kenya | ||
| Rest of Africa | ||
| By End-user Enterprise Size | Small and Medium Enterprises (SMEs) | ||
| Large Enterprises | |||
| By Service Model | Managed Detection and Response (MDR) | ||
| SOC as a Service | |||
| Identity and Access Management as a Service | |||
| Vulnerability and Pen-Test as a Service | |||
| Compliance and Risk Assessment as a Service | |||
| Data Loss Prevention as a Service | |||
| By Security Type | Risk and Vulnerability Assessment | ||
| Threat Intelligence and Analytics | |||
| Auditing and Logging | |||
| Continuous Monitoring and Encryption | |||
| Identity and Access Management | |||
| Incident Response and Disaster Recovery aaS | |||
| By Deployment Mode | Public Cloud | ||
| Private Cloud | |||
| Hybrid Cloud | |||
| By End-user Industry | BFSI | ||
| Healthcare and Life Sciences | |||
| IT and Telecom | |||
| Government and Defense | |||
| Energy and Utilities | |||
| Retail and E-commerce | |||
| Manufacturing | |||
| Geography | North America | United States | |
| Canada | |||
| Mexico | |||
| South America | Brazil | ||
| Argentina | |||
| Rest of South America | |||
| Europe | United Kingdom | ||
| Germany | |||
| France | |||
| Russia | |||
| Rest of Europe | |||
| Asia-Pacific | China | ||
| India | |||
| Japan | |||
| South Korea | |||
| Rest of Asia-Pacific | |||
| Middle East and Africa | Middle East | GCC | |
| Turkey | |||
| Israel | |||
| Rest of Middle East | |||
| Africa | South Africa | ||
| Nigeria | |||
| Kenya | |||
| Rest of Africa | |||


Key Questions Answered in the Report
What was the global value of the Cybersecurity As A Service Market in 2026 and what is it expected to reach by 2031?
Spending totaled USD 31.4 billion in 2026 and is forecast to climb to USD 56.55 billion by 2031 on a 12.48% CAGR.
How quickly is demand from small and medium-size enterprises growing?
The SME segment is projected to expand at a 13.98% CAGR through 2031 outpacing every other customer group as skills shortages and regulatory pressure accelerate outsourcing.
Which service model currently commands the largest revenue share?
Managed detection and response leads with 29.10% of 2025 global revenue, reflecting enterprise preference for proactive threat-hunting and rapid remediation.
Why are insurers influencing purchases of managed security services?
Underwriters increasingly require 24/7 monitoring, multi-factor authentication, and incident-response playbooks as conditions for coverage, pushing organizations toward bundled MDR and SOC-as-a-Service contracts.
Which region is poised for the fastest expansion through 2031?
Asia Pacific is projected to record a 14.95% CAGR, powered by rapid cloud adoption, rising technology budgets in markets such as India, and the region’s fast-growing cyber-insurance ecosystem.
Page last updated on:


