Taiwan Solid Waste Management Market Size and Share
Market Overview
| Study Period | 2020 - 2031 |
|---|---|
| Forecast Data Period | 2026 - 2031 |
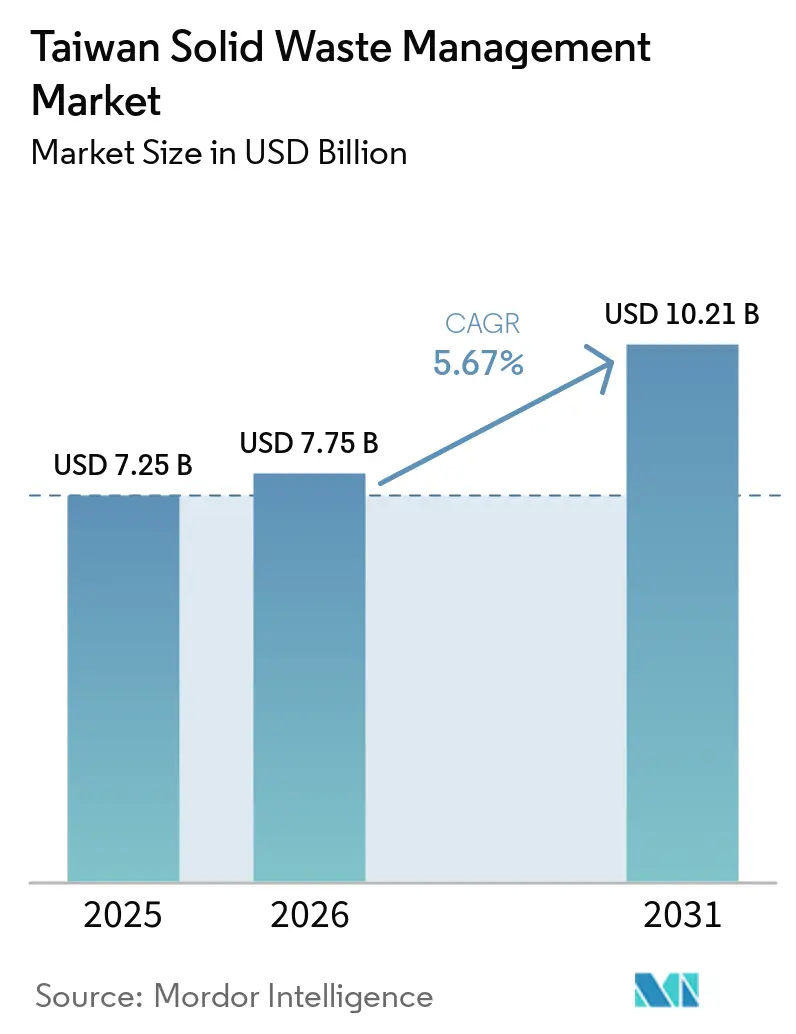
| Base Year Market Size (2025) | USD 7.25 Billion |
| Market Size (2026) | USD 7.75 Billion |
| Market Size (2031) | USD 10.21 Billion |
| Growth Rate (2026 - 2031) | 5.67% CAGR |
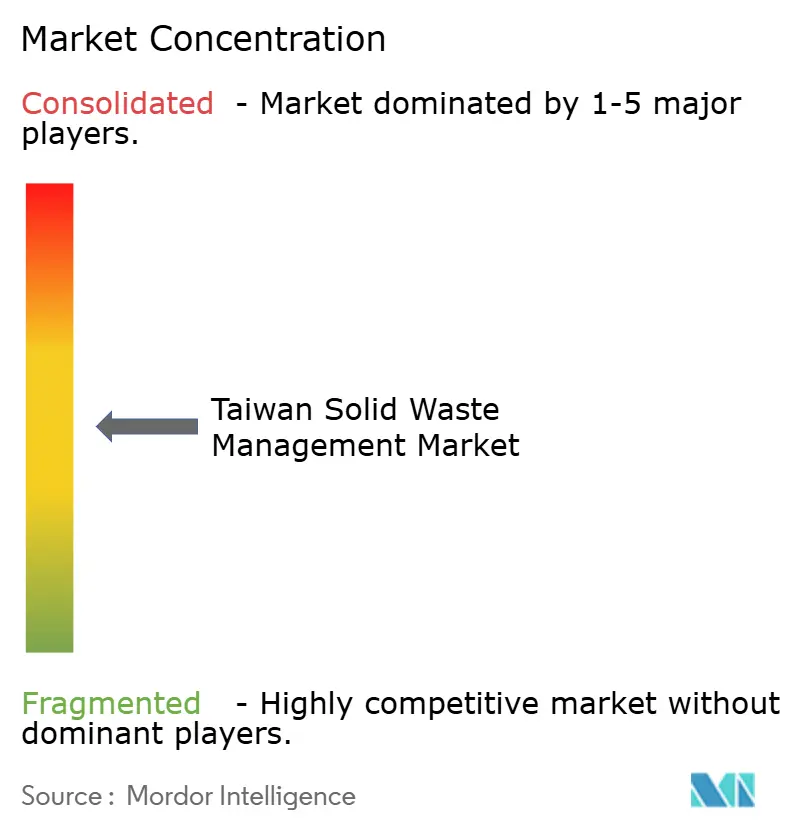
| Market Concentration | Medium |
Major Players *Disclaimer: Major Players sorted in no particular order Image © Mordor Intelligence. Reuse requires attribution under CC BY 4.0. | |
Taiwan Solid Waste Management Market Analysis by Mordor Intelligence
The Taiwan Solid Waste Management Market size is projected to expand from USD 7.25 billion in 2025 and USD 7.75 billion in 2026 to USD 10.21 billion by 2031, registering a CAGR of 5.67% between 2026 to 2031.
The Taiwan solid waste management market is entering a more mature phase of routine municipal handling. Yet it continues to drive demand through hazardous-waste treatment, circular-economy infrastructure, and incineration modernization driven by stricter compliance requirements. Taiwan’s dense concentration of semiconductor and display manufacturing keeps the Taiwan solid waste management market more specialized than many regional peers, as high-value industrial clusters generate complex waste streams that require licensed treatment and monitored transport rather than simple disposal. The regulatory model also keeps demand non-discretionary, with producer responsibility systems, incineration audits, GPS-based manifest tracking, and expanding resource circulation rules supporting service spending across operator tiers. Revenue models are also shifting in the Taiwan solid waste management market, as operators pair disposal services with electricity sales and recovered materials. At the same time, 25 large incineration plants handle 6.5 million metric tons of waste each year and generate 3.3 billion kWh of electricity for the grid. Near-term growth is supported by ASF-driven food waste diversion, legal changes in April 2026 that add solar panels and wind turbine blades to regulated waste categories, and stricter digital measures against illegal disposal. These factors expand the addressable service scope through 2031.
Key Report Takeaways
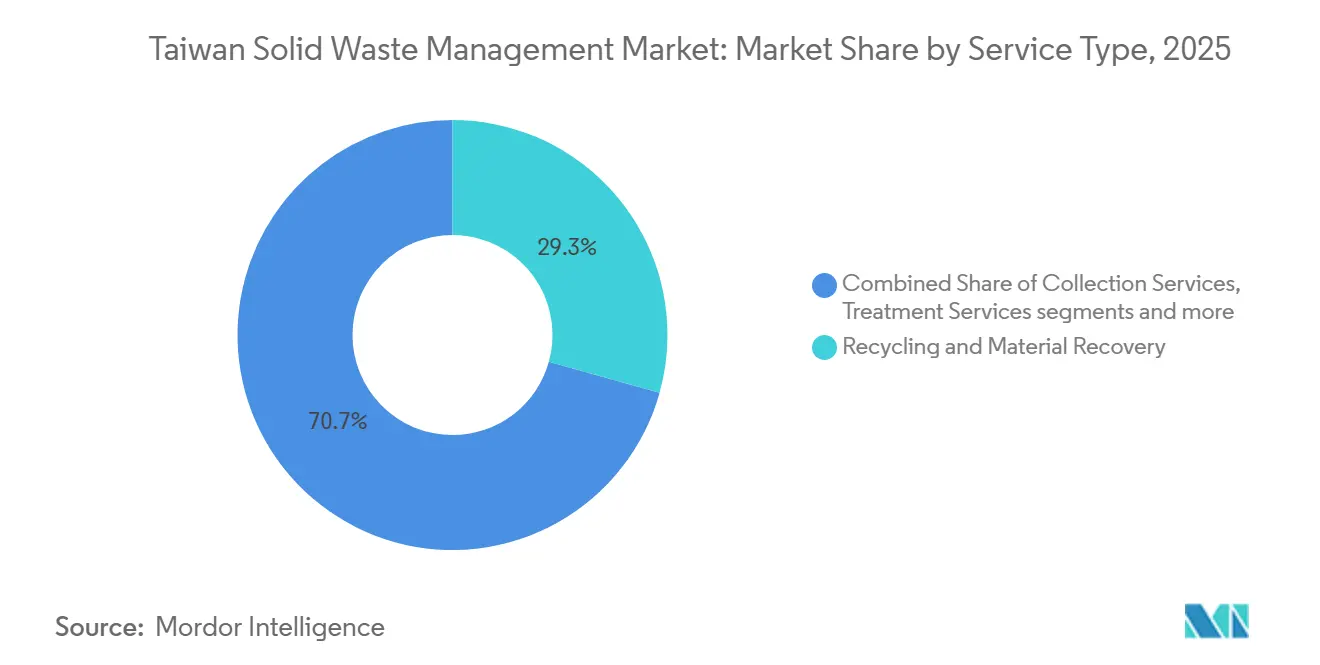
- By service type, recycling and material recovery led with 29.3% of the Taiwan solid waste management market share in 2025, while treatment services is projected to expand at 7.1% CAGR through 2031.
- By waste type, industrial waste accounted for 34.8% in 2025, while hazardous waste recorded the highest projected CAGR of 7.3% through 2031.
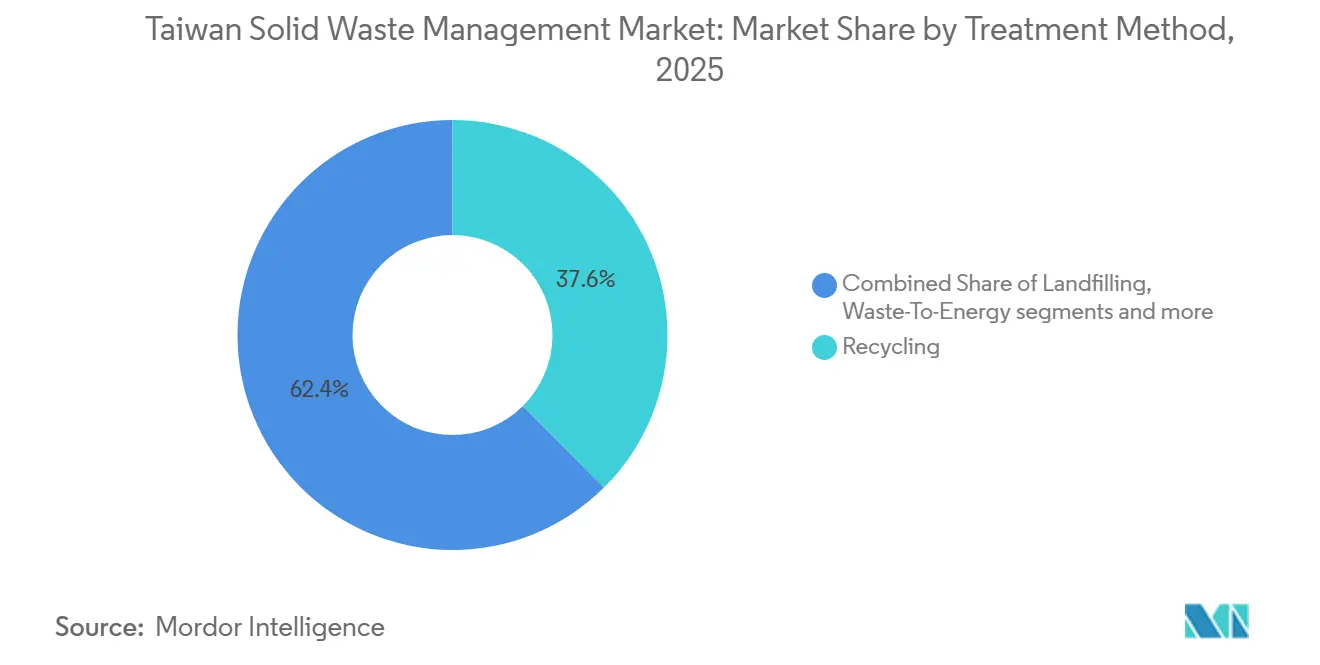
- By treatment method, recycling accounted for 37.6% of the Taiwan solid waste management market size in 2025, while incineration and waste-to-energy are advancing at 6.5% CAGR through 2031.
- By source, the industrial source held 32.4% market share in 2025, while the commercial source is projected to grow at 6.1% CAGR through 2031.
- By technology, automated sorting systems led with a 34.8% share in 2025, while AI and IoT-enabled waste monitoring is projected to expand at 8.3% CAGR through 2031.
Note: Market size and forecast figures in this report are generated using Mordor Intelligence’s proprietary estimation framework, updated with the latest available data and insights as of January 2026.
Taiwan Solid Waste Management Market Trends and Insights
Drivers Impact Analysis*
| Driver | (~) % Impact on CAGR Forecast | Geographic Relevance | Impact Timeline |
|---|---|---|---|
| Taiwan's Globally Unique "4-in-1 Recycling Program" Institutionally Embedded Demand Creation | +1.3% | National, with the highest density in Taipei, New Taipei, Taichung, and Kaohsiung | Long term (≥ 4 years) |
| African Swine Fever (ASF) Ban on Food Waste as Pig Feed Urgent Capacity Gap Market | +1.1% | National, concentrated in Taipei, New Taipei, Taichung, Tainan, and Kaohsiung | Short term (≤ 2 years) |
| Mandatory upgrade of 25-plant incineration network under Taiwan's waste treatment program | +0.9% | National, distributed across 22 counties and cities | Medium term (2-4 years) |
| Taiwan's 2050 net-zero-emission pathway requires a circular-economy transformation of waste facilities | +0.8% | National, with early gains in Hsinchu, Taichung, and Tainan science park corridors | Long term (≥ 4 years) |
| Semiconductor and high-tech industries generate high volumes of hazardous industrial waste | +0.6% | Concentrated in Hsinchu County and City, Taoyuan, Taichung, and Tainan science park clusters | Medium term (2-4 years) |
| Mandatory waste-to-energy integration with Taipower grid offers revenue incentives for operators | +0.4% | National, across 25 designated incineration plant municipalities | Long term (≥ 4 years) |
| Source: Mordor Intelligence | |||
Taiwan's Globally Unique "4-in-1 Recycling Program" Institutionally Embedded Demand Creation
Taiwan’s 4-in-1 system keeps the Taiwan solid waste management market anchored to a stable regulatory demand base because recyclables continue to move through licensed operators under a formal national framework. In 2025, total general waste generation reached 11.74 million metric tons, resource recyclables accounted for 6.57 million metric tons, and food waste recovery reached 521,830 metric tons, showing the scale of material flow already embedded in the system.[1]Ministry of Environment Taiwan, “National General Waste Generation,” Environmental Data Open Platform, data.moenv.gov.tw That structure matters because service demand does not depend only on rising waste volumes; it also depends on the continued routing, reporting, and certified treatment of recoverable materials through compliant channels. The current resource circulation program for 2023-2027 also links operator participation more closely to carbon reduction and circularity outcomes, broadening the economic role of licensed recycling beyond basic collection and sorting. As a result, the Taiwan solid waste management market creates a stable baseline demand supported by regulatory requirements rather than from cyclical waste generation alone.
African Swine Fever (ASF) Ban on Food Waste as Pig Feed Urgent Capacity Gap Market
The October 2025 confirmation of Taiwan’s first ASF case prompted an immediate operational shift in the Taiwan solid waste management market, as food waste previously sent to pig feeding is now being redirected to formal treatment channels.[2]Ministry of Environment Taiwan, “MOENV Implements Nationwide Emergency Measures for Food Waste to Prevent the Spread of African Swine Fever,” Ministry of Environment, moenv.gov.tw The Cabinet approved a phased ban in December 2025, with household food waste pig feeding prohibited from January 1, 2026, and a full ban on all food waste pig feeding taking effect from January 1, 2027. Official capacity plans show that treatment facilities will reach 1,720 metric tons per day by the end of 2026 and 2,119 metric tons per day by the end of 2027, calibrated to absorb the redirected volume. To ensure compliance with the ASF-driven food waste diversion policy, the Ministry of Environment (MOENV) has also added AIoT temperature monitoring, GPS tracking for transport vehicles, and quarterly interagency inspections, so the demand increase is tied to both new volume and tighter compliance requirements.
Mandatory Upgrade of 25-Plant Incineration Network under Taiwan's Waste Treatment Program
The upgrade cycle for Taiwan’s large incineration fleet is a key growth driver for the Taiwan solid waste management market because it adds capacity, extends asset life, and increases electricity output from existing waste volumes. As of 2024, 17 of Taiwan’s 25 large-scale incineration plants were undergoing upgrade programs, adding 330,000 metric tons of processing capacity and improving the operational efficiency of the monitoring system from 85% to 95%. The commercial significance is evident in current project commitments: the Tainan Chengxi BOT requires NTD 7.2 billion (USD 226.9 million), and the Yilan Lize ROT commits NTD 1.3 billion (USD 40.9 million), supporting equipment, engineering, and long-term operations management demand through the forecast period. For operators, that means the Taiwan solid waste management market is not only adding contract volume but also improving the profitability and revenue diversification of incineration assets that can combine treatment fees with electricity generation.
Taiwan's 2050 Net-Zero Emission Pathway Requires Circular-Economy Transformation of Waste Facilities
Taiwan’s climate policy is expanding the role of Taiwan's solid waste management market from a focus on disposal to a measurable part of industrial decarbonization and resource circulation. The Climate Change Response Act supports the 2050 net-zero pathway, and carbon fee collection begins in May 2026 for fiscal year 2025 emissions, which gives industrial clients a stronger reason to prioritize traceable, lower-emission waste treatment solutions. Nationally Determined Contribution (NDC) 3.0, submitted in November 2025, commits to a 28% ± 2% net reduction in greenhouse gas emissions by 2030 relative to 2005 levels, while Strategy 8 in the national transition plan centers on resource circulation and zero waste. This is already changing procurement behavior, because carbon footprint labels, circularity reporting, and verifiable environmental performance are becoming more relevant in industrial waste treatment contracts than simple disposal price alone. The scale of aligned activity is also meaningful: Taiwan’s green industries generated more than NTD 512.3 billion (USD 16.3 billion) in value added in 2024, indicating that the market benefits from broader national investments in circular economy and environmental infrastructure rather than a narrow compliance program. That keeps the Taiwan solid waste management market exposed to long-duration demand from both environmental regulation and industrial transition spending.
Restraints Impact Analysis*
| Restraint | (~) % Impact on CAGR Forecast | Geographic Relevance | Impact Timeline |
|---|---|---|---|
| Land Scarcity & Near-Zero New Landfill Siting Possibility | -1.1% | National, acute in Northern, Central, and Southern Taiwan | Long term (≥ 4 years) |
| Organized Crime Infiltration of Industrial Waste Disposal & Systemic Illegal Dumping | -0.9% | National, concentrated in Miaoli, Taoyuan, Hsinchu, and Rural central Taiwan | Medium term (2-4 years) |
| Recycled Material Price Volatility & International Commodity Dependency | -0.5% | Global commodity exposure is highest in plastics, metals, and wastepaper | Medium term (2-4 years) |
| Complex Multi-Regulatory Framework & Cross-Ministerial Coordination Failure Risk | -0.4% | National, especially high-tech park corridors and construction surplus management zones | Long term (≥ 4 years) |
| Source: Mordor Intelligence | |||
Land Scarcity & Near-Zero New Landfill Siting Possibility
Land scarcity remains a constraint on Taiwan solid waste management market, as new landfill development faces physical and political constraints that cannot be addressed through routine policy adjustments. By September 2024, 734,000 metric tons of exposed, temporarily stored waste remained at 53 landfills nationwide, even after subsidy-backed cleanup efforts, showing that disposal pressure persists despite remedial action.[3]Environmental Management Administration, “Operation and Management for Waste Incineration Plants,” Environmental Management Administration, ema.gov.tw The constraint is more severe because construction surplus soil reached 43.57 million m³ in 2024, adding pressure on sites and creating overlap in management between waste administration and construction oversight. In practice, the near-zero probability of greenfield landfills redirects investment toward incineration, mechanical biological treatment, and anaerobic digestion, all of which require higher capital, tighter permitting, and more technical operating standards. That raises costs for smaller providers and gradually favors operators in the Taiwan solid waste management market that already control licensed treatment assets and compliance-heavy service platforms.
Organized Crime Infiltration of Industrial Waste Disposal & Systemic Illegal Dumping
Illegal dumping continues to distort the Taiwan solid waste management market, as compliant operators must compete with disposal chains that skirt treatment standards, reporting requirements, and proper site management. MOENV’s July 2025 enforcement action against a waste-dumping ring in Taoyuan and Hsinchu showed how agricultural land could be leased under the guise of development. Then it was backfilled with untreated waste, leading to charges against 11 individuals and 4 companies under the Waste Disposal Act. The April 2026 amendments introduced AI-enabled electronic fences, expanded digital tracking, and criminal penalties of up to 7 years in prison and fines of NTD 15 million (USD 0.47 million), which should strengthen formal enforcement over time. Even so, enforcement does not eliminate the cost burden immediately, because industrial clients still face delays, due diligence risks, and tighter contract screening when selecting licensed handlers. This creates a drag on pricing quality and margin stability in the Taiwan solid waste management market, especially for industrial, construction, and remediation services that are most exposed to disposal fraud.
*Our forecasts treat driver/restraint impacts as directional, not additive. The impact forecasts reflect baseline growth, mix effects, and variable interactions.
Segment Analysis
By Service Type: Recycling Commands the Largest Share as Hazardous Treatment Drives Value Growth
Recycling and material recovery held 29.3% of the Taiwan solid waste management market share in 2025, making it the largest service category by value. That position reflects how Taiwan’s licensed recycling channels turn formal collection and material recovery into a recurring service rather than a residual activity. The segment also benefits from higher-value industrial recovery streams, especially in electronics and semiconductor supply chains, where recovered solvents and by-products carry stronger economics than basic municipal recyclables. ECOVE’s semiconductor solvent recycling unit processed 13,000 metric tons of high-tech waste solvents in 2025 and achieved IPA recovery purity above 99.9%, demonstrating how industrial recovery is enhancing service value in the Taiwan solid waste management market.
Treatment services are projected to grow at 7.1% CAGR through 2031, supported by expanding fab capacity, stricter manifest controls, and more complex chemical waste profiles. This segment is less sensitive to routine municipal waste trends because its demand is tied to regulated industrial activity, transport traceability, and treatment certification under the Waste Disposal Act and related declaration systems. Owing to GPS tracking and digital reporting, designated waste vehicles now operate in a more data-driven environment, leading to steady gains in the collection services, transportation, and logistics segment. Composting and organic waste processing should see the sharpest near-term volume increase as the ASF policy transition redirects former pig-feed volumes into formal treatment routes. At the same time, waste-to-energy remains more mature in terms of volume but continues to generate attractive upgrade and operations contracts.


By Waste Type: Industrial Waste Anchors Volume While Hazardous Waste Accelerates on High-Tech Expansion
Industrial waste accounted for 34.8% share of the Taiwan solid waste management market size in 2025, reflecting the island’s manufacturing-heavy economic structure and the depth of its regulated industrial base. This category remains the anchor for commercial volumes because steel, petrochemical, electronics, and semiconductor facilities generate continuous flows that require formal declaration, transport, treatment, or reuse. In the first half of 2024, industrial waste reuse accounted for 81.79% of total reported clearance volume, demonstrating that recovery and reuse are deeply embedded in operating practice rather than treated as peripheral functions. The regional concentration is also clear, with Kaohsiung City reporting 21,349 metric tons of industrial waste self-treatment declarations in December 2025, compared with 16,594 metric tons in Taoyuan City and 15,463 metric tons in Tainan City.
Hazardous waste is forecast to record the fastest CAGR of 7.3% through 2031, as advanced manufacturing continues to expand the need for specialized treatment, monitored logistics, and documented end-of-life handling. April 2026 amendments that expand regulated waste categories to include solar panels and wind turbine blades also widen the future service envelope for complex end-of-life materials. Municipal solid waste remains the largest public-service stream by handled tonnage, with total waste generation at 11.74 million metric tons in 2025 and per-capita daily generation at 1.377 kg. Still, mandatory separation continues to limit faster growth in mixed municipal disposal volumes. Construction and demolition waste is also moving up the priority list because January 2026 GPS tracking requirements for surplus soil vehicles and tighter chain-of-custody rules are increasing compliance demand across the construction segment.
By Treatment Method: Recycling Leads While Incineration and Waste-To-Energy Plant Upgrades Drive Growth
Recycling-led treatment methods with a 37.6% share in 2025, confirming that Taiwan’s treatment mix is built more around recovery and controlled processing than around simple disposal. This leading position reflects strong source separation, a formal recycling framework, and the commercial role of licensed operators in routing materials into recovery channels. The treatment pattern also means the Taiwan solid waste management market has less room to rely on low-cost landfill expansion than many other Asian systems, which keeps higher-value processing methods central to market growth. Incineration and waste-to-energy are forecast to grow at a 6.5% CAGR through 2031, supported by the national plant upgrade cycle and efficiency improvements rather than a sharp rise in untreated waste volumes.
Treatment economics also improved, as the calorific value of municipal solid waste reached 3,081 kcal/kg in 2024, supporting higher energy recovery per processed ton. Composting and Anaerobic Digestion should see the strongest demand acceleration through 2027 as food waste is redirected out of pig feeding and into controlled treatment pathways. The reconstructed Yilan Lize project also shows how facilities are moving toward integrated processing, combining incineration with bottom ash screening, food waste processing, and fly ash washing in a single circular park model. Mechanical Biological Treatment remains smaller, but it should gain ground where direct incineration or direct composting is less suitable, keeping the Taiwan solid waste management market tilted toward capital-intensive, technology-backed treatment platforms.
By Source: Industrial Source Dominates While Commercial Waste Gains Momentum
Industrial sources commanded a dominant 32.4% share in 2025, underscoring the premium value of business waste streams. These streams demand specialized handling, meticulous manifest filing, transport oversight, and certified treatment. Positioned at the heart of Taiwan's solid waste management landscape, this source category directly interfaces with science parks, export manufacturing zones, and heavy industrial estates, all of which treat compliance as non-negotiable. The driving force behind this demand is robust: Taiwan's resource regeneration sector boasts companies with a collective production value of NTD 81.4 billion (USD 2.6 billion), as highlighted by the latest official development data. Such figures not only cement industrial source waste as the most valuable stream but also underscore its pivotal role in bolstering a diverse vendor ecosystem that encompasses reuse, treatment, transport, and reporting functions.
The commercial source is forecast to grow at a 6.1% CAGR through 2031, driven by expanding hospitality, logistics, retail, and data center activity, as well as tighter collection requirements for restaurant food waste under the new ASF-linked policy environment. This creates a wider addressable base for segregated collection, organic waste processing, and compliance-oriented service packages in cities with dense service-sector activity. Residential source generated 4.64 million metric tons of general waste in 2025, so urban collection density remains important even as per-capita waste generation trends soften. Construction and demolition sources are also broadening the licensed service opportunity, as the April 2026 amendments require fuller supply-chain tracking for construction surplus materials, which favors operators in the Taiwan solid waste management market that can combine transport control with approved downstream treatment.
By Technology: Automated Sorting Leads, While AI and IoT Monitoring Expand the Fastest
Automated sorting systems held the largest share of technology at 34.8% in 2025, reflecting their already mature role across major incinerators and recycling facilities. These systems are established because they improve combustible quality, remove non-target materials, and help operators handle larger throughputs with more consistent output control. In that sense, automation is already a core operating layer rather than an emerging add-on within the Taiwan solid waste management market. The next wave of spending is shifting toward AI and IoT-enabled waste monitoring, which is projected to grow at 8.3% CAGR through 2031 as surveillance, reporting, and traceability move deeper into daily plant and transport operations.
MOENV’s 2025 plan to deploy AI monitoring at 1,200 environmental crime hotspots, together with the April 2026 legal authorization for electronic fence systems, gives this technology segment a direct policy push. The 2026 rollout of AIoT temperature and image recognition systems at remaining food-waste pig farms adds another immediate demand stream tied to the food waste transition. Solid Waste Incinerator Management System (SWIMS) reporting requirements for all 25 large incineration plants also make digital monitoring a compliance necessity rather than a discretionary upgrade. Waste-to-fuel and broader smart waste systems remain at a smaller scale. Still, the January 2025 SRF quality management rules have formalized the control environment needed for more disciplined growth in those technology-linked services.
Geography Analysis
Northern Taiwan remains the most densely populated operating zone in the Taiwan solid waste management market because it combines high municipal waste volumes, high-tech industrial activity, and strong regulatory enforcement capacity. Taipei City, New Taipei City, Taoyuan City, and Hsinchu County and City form the core northern cluster, which concentrates a large share of both public service waste flows and specialized industrial waste demand. New Taipei City and Taipei City together generated 250,000 metric tons of general waste in December 2025, while both maintained recycling rates above 59%, which shows that scale and sorting intensity coexist in the northern urban system. The same region also faces infrastructure pressure, especially as science park activity increases, industrial waste intensity grows faster than local treatment capacity can expand. That is why northern Taiwan remains important not only for volume, but also for higher-value services linked to hazardous waste handling, tracked transport, and licensed recovery.
Central and southern Taiwan account for much of the heavy industrial and construction-related workload in the Taiwan solid waste management market, supported by petrochemical, steel, electronics, and semiconductor activity. Kaohsiung City posted 21,349 metric tons of industrial waste self-treatment declarations in December 2025, ahead of Taoyuan City at 16,594 metric tons and Tainan City at 15,463 metric tons, underlining how the main industrial corridors shape regional demand. Tainan and Kaohsiung are also leading the response to the transition from pig-feed disposal to regulated treatment pathways, because redirected organic waste volumes create immediate demand for composting, anaerobic digestion, and bioenergy capacity. Taichung’s Wenshan BOT renovation and Tainan’s Chengxi BOT project make the central-south corridor the most active infrastructure spending zone through the forecast period, with Taichung targeting higher plant efficiency and Tainan adding a new high-capacity waste-to-energy asset. Science park corridors in Taichung and Tainan also reinforce demand for hazardous waste treatment and solvent recovery services, which carry higher average contract values than standard municipal handling.
Eastern Taiwan and the offshore islands operate under a different logistics model because distance, lower waste density, and transport constraints make a mainland-style treatment setup impractical. Kinmen relies on a mix of incineration and composting because limited connectivity makes diversified local handling more important than long-haul transfer. Lienchiang depends more on composting and alternative treatment pathways for similar geographic reasons. Across the full map, the Taiwan solid waste management market favors operators that can combine local collection reach with access to licensed regional treatment assets, digital tracking capability, and the regulatory capacity to manage different municipal and industrial waste rules across counties.
Competitive Landscape
The Taiwan solid waste management market is moderately consolidated. Long-duration BOT and ROT structures create clear barriers in waste-to-energy and large treatment assets, because new entrants need capital, technical track record, and local government access to compete for contracts that often run 20 to 25 years. ECOVE is one of the clearest examples of scale, operating 11 resource recovery centers in Taiwan and 2 in Macau, giving it a strong base in large-scale treatment and circular service operations. This concentration is reinforced by the fact that advanced treatment assets are now expected to provide not only disposal, but also energy recovery, environmental reporting, and industrial circularity services. Veolia’s Taiwan Cement joint venture in Yilan shows that foreign-affiliated players can participate, but usually through partnership structures and concession-based entry rather than broad standalone expansion.
Competitive strategy is shifting away from simple disposal scale and toward technology-backed service breadth. ECOVE’s 2024 Chiayi BOT win shows that incumbents are still expanding the treatment base with new, high-standard assets rather than relying solely on older facilities. JFE Engineering’s equipment order for the same Chiayi project also shows that international engineering partners still see Taiwan as a credible destination for high-specification waste-to-energy investment. Taichung’s Wenshan BOT renovation adds another example of modernization being used to boost efficiency and reduce pollutants, rather than merely extending the life of existing capacity. These moves point to a Taiwan solid waste management market where incumbents compete through compliance depth, engineering capability, digital operations, and the ability to serve industrial clients with more demanding reporting needs.
Emerging opportunities exist in food waste carbon projects, lithium battery recycling, solar panel and wind turbine blade end-of-life management, and asbestos-related disposal services. The April 2026 legal amendments expand the regulatory scope for several of these streams, while the innovation experiment sandbox under the Resource Circulation Promotion Act lowers the hurdle for differentiated service models to be tested within the formal system. As local collection remains scattered but treatment assets are capital-intensive, partnerships between municipal contractors, niche recyclers, and licensed plant operators are expected to remain a common route to growth. Overall, the Taiwan solid waste management market should remain competitive in day-to-day service bidding, while concession ownership and hazardous treatment capability preserve stronger structural advantages for the larger treatment operators.
Taiwan Solid Waste Management Industry Leaders
Cleanaway Co., Ltd.
ECOVE Environment Corporation
Veolia Taiwan
Chung Tai Resource Technology Corp.
Enrestec, Inc.
- *Disclaimer: Major Players sorted in no particular order

Recent Industry Developments
- April 2026: Taiwan's Executive Yuan amended the Resource Recycling Act (now the Resource Circulation Promotion Act) and the Waste Disposal Act, adding solar panels and wind turbine blades to the list of regulated waste, introducing AI surveillance of waste flows, increasing penalties, and mandating a 5-year review of the national resource circulation plan.
- December 2025: Taichung City Government formally signed the Wenshan Incinerator BOT renovation project with TCC Wenshan Environmental Technology, projecting a 50% increase in daily capacity to 900 metric tons, improvements in power generation efficiency from approximately 15% to 25%+, and reductions in air pollutants of 44-90% upon completion by end-2029.


Taiwan Solid Waste Management Market Report Scope
The Taiwan Solid Waste Management Market Report is Segmented by Service Type (Collection Services, Transportation & Logistics, and more), by Waste Type (MSW, Industrial, and more), by Treatment Method (Landfilling, Recycling, and more), by Source (Residential, Commercial, and more), and by Technology (Smart Waste Management, AI & IoT Monitoring, and more). The Market Forecasts are Provided in Terms of Value (USD) and Volume (Tons)
| Collection Services |
| Transportation & Logistics |
| Recycling & Material Recovery |
| Composting & Organic Waste Processing |
| Waste-to-Energy (WtE) |
| Landfill Management & Final Disposal |
| Treatment Services |
| Others |
| Municipal Solid Waste (MSW) |
| Industrial Waste |
| Hazardous Waste |
| Construction & Demolition (C&D) Waste |
| Agricultural Waste |
| Medical/Biohazard Waste |
| Others |
| Landfilling |
| Recycling |
| Incineration / Waste-To-Energy |
| Composting & Anaerobic Digestion |
| Mechanical Biological Treatment (MBT) |
| Residential |
| Commercial |
| Industrial |
| Institutional |
| Construction & Demolition |
| Smart Waste Management |
| AI & IoT-enabled Waste Monitoring |
| Automated Sorting Systems |
| Waste-to-Fuel Technologies |
| Others |
| By Service Type | Collection Services |
| Transportation & Logistics | |
| Recycling & Material Recovery | |
| Composting & Organic Waste Processing | |
| Waste-to-Energy (WtE) | |
| Landfill Management & Final Disposal | |
| Treatment Services | |
| Others | |
| By Waste Type | Municipal Solid Waste (MSW) |
| Industrial Waste | |
| Hazardous Waste | |
| Construction & Demolition (C&D) Waste | |
| Agricultural Waste | |
| Medical/Biohazard Waste | |
| Others | |
| By Treatment Method | Landfilling |
| Recycling | |
| Incineration / Waste-To-Energy | |
| Composting & Anaerobic Digestion | |
| Mechanical Biological Treatment (MBT) | |
| By Source | Residential |
| Commercial | |
| Industrial | |
| Institutional | |
| Construction & Demolition | |
| By Technology | Smart Waste Management |
| AI & IoT-enabled Waste Monitoring | |
| Automated Sorting Systems | |
| Waste-to-Fuel Technologies | |
| Others |


Key Questions Answered in the Report
What is the 2026 value and 2031 outlook for Taiwan solid waste management?
The Taiwan solid waste management market is valued at USD 7.75 billion in 2026 and is projected to reach USD 10.21 billion by 2031, with a 5.67% CAGR.
Which service area is growing the fastest in Taiwan?
Treatment Services is the fastest-growing service segment, with a projected 7.1% CAGR through 2031, supported by semiconductor expansion and tighter compliance rules.
Why is food waste becoming a bigger business opportunity after 2025?
The ASF-related ban on food waste pig feeding is redirecting 731 metric tons per day into composting, black soldier fly processing, anaerobic digestion, and bioenergy facilities.
Which waste stream holds the largest share by type?
Industrial Waste leads by type with a 34.8% share in 2025, reflecting Taiwan’s manufacturing-heavy base and the need for regulated treatment and reuse channels.
What is driving investment in waste-to-energy facilities?
Plant upgrades, stronger waste calorific value, and electricity monetization are supporting investment, while 17 of 25 large incinerators were already under upgrade programs as of 2024.
How concentrated is competition in this space?
Competition is mixed, with moderate concentration in large treatment assets under BOT and ROT contracts, and much more fragmentation in collection, transport, and smaller organic waste services.
Page last updated on:


