Market Overview
| Study Period | 2020 - 2031 |
|---|---|
| Forecast Data Period | 2026 - 2031 |
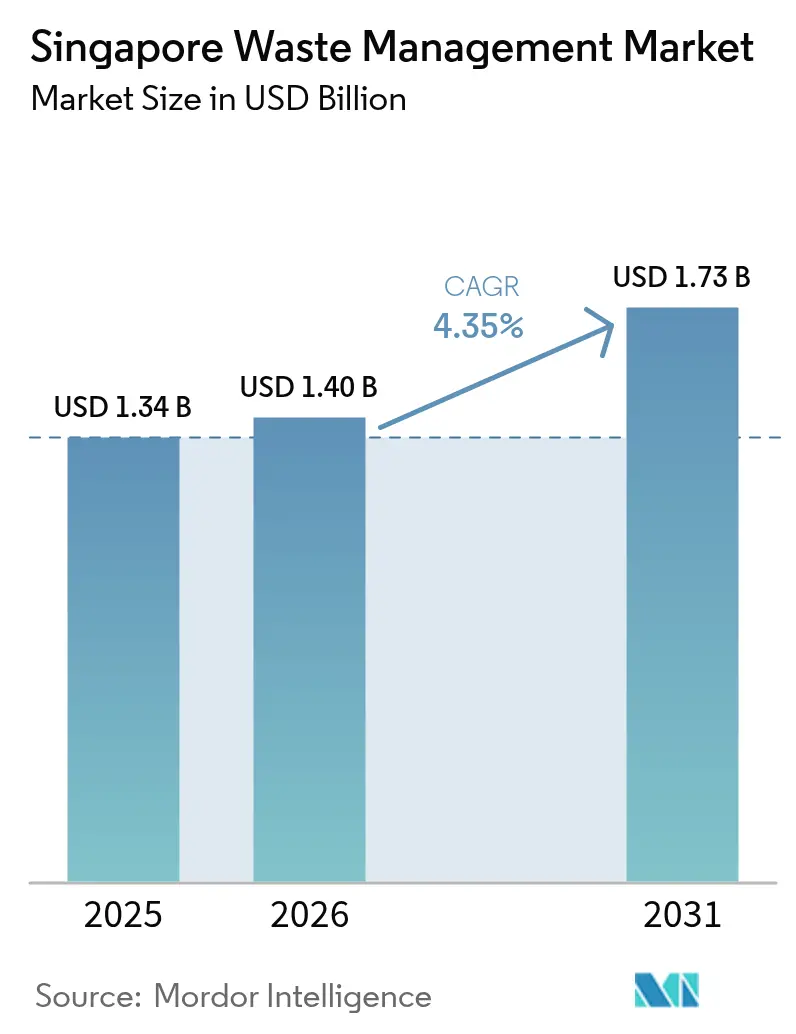
| Base Year Market Size (2025) | USD 1.34 Billion |
| Market Size (2026) | USD 1.4 Billion |
| Market Size (2031) | USD 1.73 Billion |
| Growth Rate (2026 - 2031) | 4.35% CAGR |
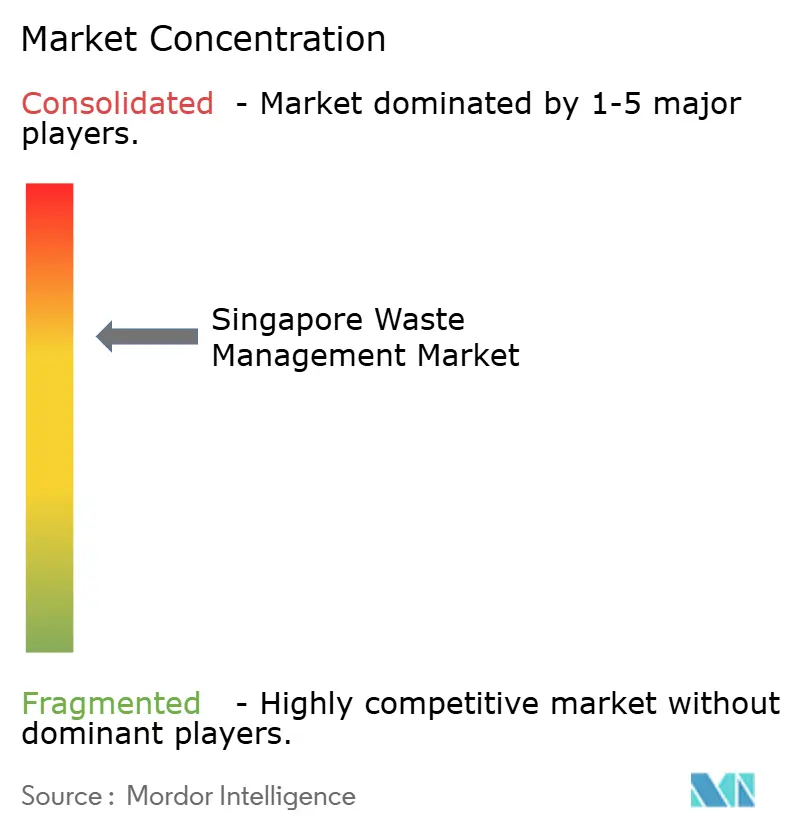
| Market Concentration | Medium |
Major Players *Disclaimer: Major Players sorted in no particular order Image © Mordor Intelligence. Reuse requires attribution under CC BY 4.0. | |
Singapore Waste Management Market Analysis by Mordor Intelligence
The Singapore Waste Management Market size is expected to grow from USD 1.34 billion in 2025 to USD 1.4 billion in 2026 and is forecast to reach USD 1.73 billion by 2031 at 4.35% CAGR over 2026-2031. This steady expansion reflects Singapore’s pivot toward circular-economy practices that prize material recovery over disposal. Tight land availability reinforces investment in waste-to-energy (WTE) assets, while the Resource Sustainability Act (RSA) and the Zero-Waste Masterplan create compulsory demand for recycling capacity across food, packaging, and electronic waste streams. Private operators gain ground as public agencies outsource specialized services, and national hydrogen ambitions underpin research into waste-derived fuels. Rising operating costs, fuel, labor, and carbon taxes are nudging the market toward automation, data-driven route optimization, and integrated processing complexes[1]National Environment Agency, “Waste Statistics and Overall Recycling,” nea.gov.sg.
Key Report Takeaways
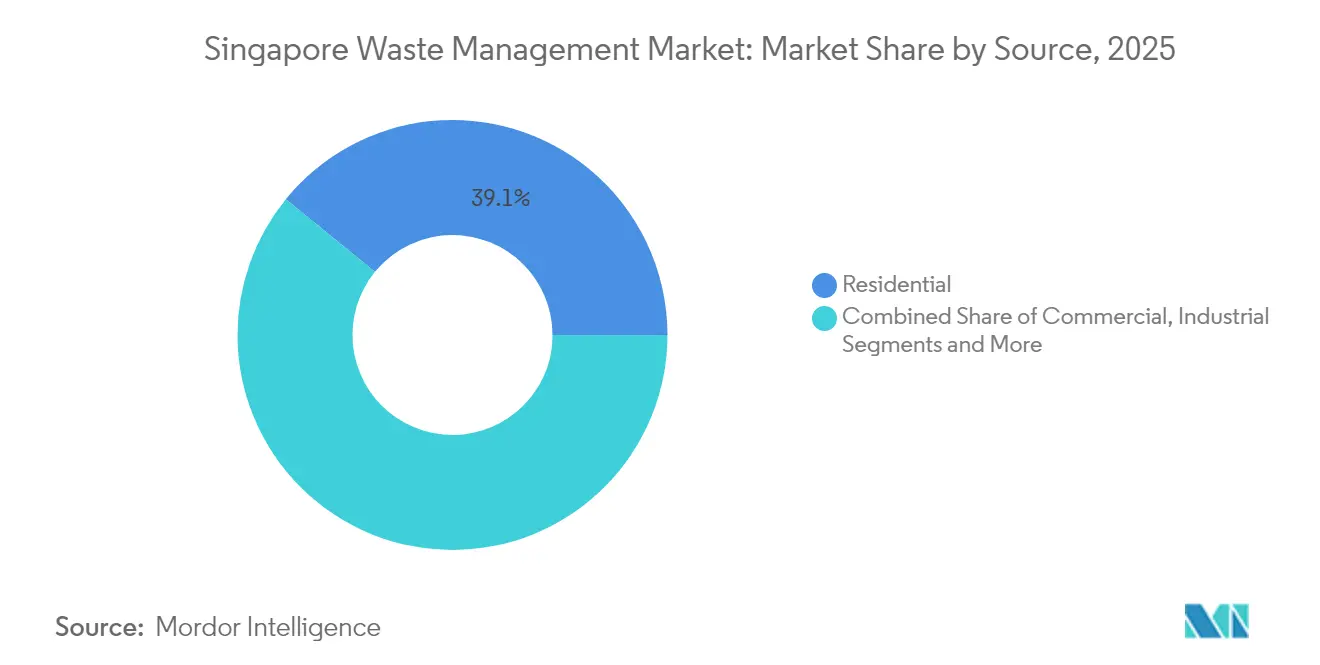
- By source, residential waste retained 39.12% of Singapore's waste management market share in 2025; commercial waste is the fastest-growing source at a 6.31% CAGR through 2031.
- By service type, collection, transport, and sorting held 47.15% revenue share in 2025, while recycling and resource recovery are projected to advance at a 6.42% CAGR to 2031.
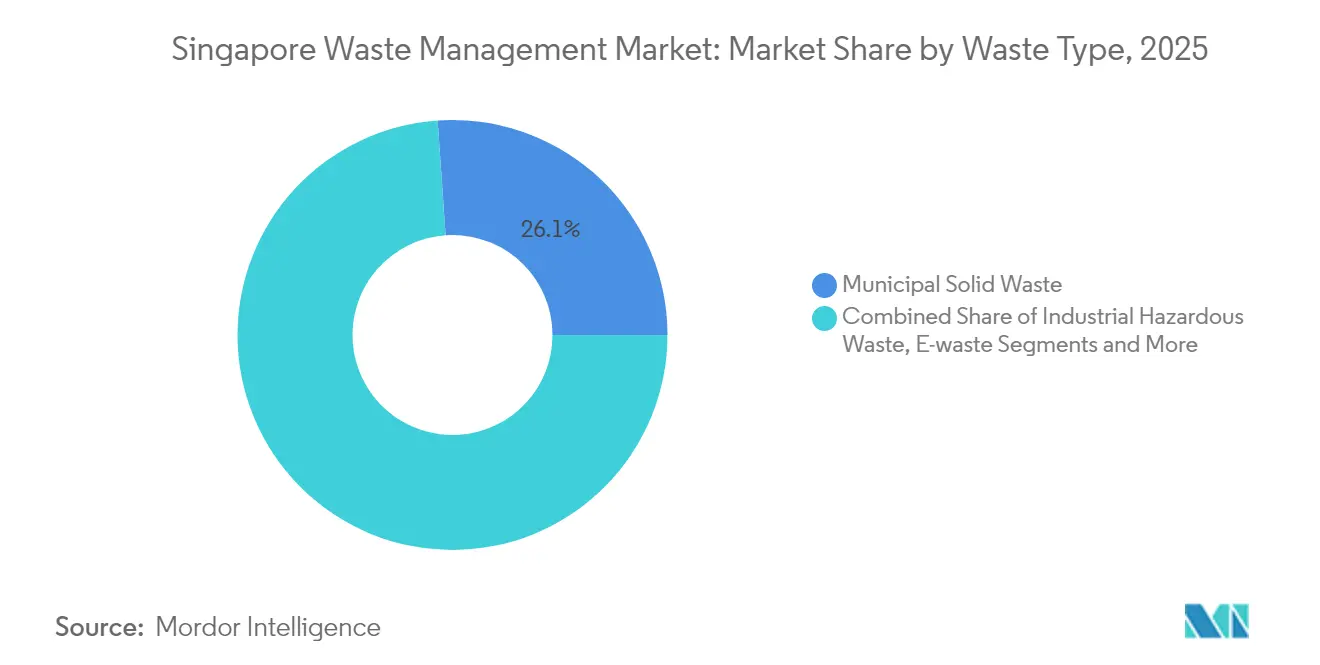
- By waste type, municipal solid waste led with 26.10% share of the Singapore waste management market size in 2025, and e-waste is forecast to expand at a 5.32% CAGR through 2031.
- By contract model, public agreements accounted for a 73.05% share in 2025; private contracts are projected to grow at a 5.04% CAGR over the same period.
Note: Market size and forecast figures in this report are generated using Mordor Intelligence’s proprietary estimation framework, updated with the latest available data and insights as of 2026.
Singapore Waste Management Market Trends and Insights
Drivers Impact Analysis*
| Driver | (~) % Impact on CAGR Forecast | Geographic Relevance | Impact Timeline |
|---|---|---|---|
| Zero-Waste Masterplan and circular-economy mandates | +1.2% | National | Long term (≥ 4 years) |
| Limited landfill capacity that accelerates incineration and recycling | +1.0% | National | Long term (≥ 4 years) |
| Mandatory Extended Producer Responsibility schemes | +0.8% | National | Medium term (2-4 years) |
| NEA incentive grants that expand private recycling capacity | +0.6% | National | Medium term (2-4 years) |
| Deployment momentum of pneumatic waste conveyance systems | +0.4% | Urban districts | Short term (≤ 2 years) |
| Tuas Nexus waste-to-hydrogen pilot projects | +0.3% | Tuas Industrial Zone | Long term (≥ 4 years) |
| Source: Mordor Intelligence | |||
Zero-Waste Masterplan and Circular-Economy Mandates
The Zero-Waste Masterplan sets a mandatory 70% national recycling rate and orders a 30% cut in landfill waste by 2030, reshaping the cash-flow logic of the Singapore waste management market. Three priority streams, e-waste, food waste, and packaging, together generate more than 40% of total waste, so compliance drives demand for sorting, composting, and advanced recycling kits. The RSA makes food-waste segregation compulsory for large premises from 2024, funneling business toward on-site digesters and bio-pulpers. A new build must now reserve space for such equipment, guaranteeing pipeline projects for technology vendors. Revenue predictability rises because enforcement includes mandatory monthly reporting and escalating penalties. Operators that supply integrated WTE and water recovery, as seen in the Tuas Nexus concept, sit in the policy sweet spot[2]National Environment Agency, “Resource Sustainability Act,” nea.gov.sg.
Limited Landfill Capacity Driving Incineration and Recycling Demand
Semakau Landfill may reach its design limit by 2035, so the island republic must divert waste or miniaturize it. Four WTE plants currently vaporize 3.8 million t annually and supply 2% of the grid, while the 2021-commissioned TuasOne unit processes 3,600 t per day and delivers 120 MW to the network. The coming Integrated Waste Management Facility (IWMF) at Tuas Nexus will be able to handle 5,800 t per day, becoming the largest single waste complex worldwide. Each incremental tonne incinerated frees scarce land, so feedstock certainty underwrites private-sector appetite for long-term build-operate-transfer deals.
Mandatory Extended Producer Responsibility Schemes
EPR now shifts disposal fees from taxpayers to manufacturers. Since 2021, the e-waste plan has enabled licensed Producer Responsibility Organizations to process 22,300 t of gadgets by September 2024, underpinning new collection routes and treatment plants. A beverage-container return program goes live in 2025 with a USD 0.07 deposit that targets an 80% take-back rate. Packaging EPR follows in stages through 2025, forcing large users to file Reduce-Reuse-Recycle plans. The approach secures long-term service contracts for recyclers, attracts project finance for plastics sorting lines, and telegraphs a stable revenue model that multinational players favor. Singapore’s early EPR adoption also gives local firms a reference track record for export consulting across Southeast Asia.
NEA Incentive Grants Accelerating Private-Sector Recycling Capacity
Grants lower financial barriers for new entrants. The 3R Fund reimburses up to USD 0.74 million (80% of project value) for novel waste-reduction pilots, and the Food Waste Fund subsidizes on-site digesters up to USD 74,000 per applicant. Several chemical-recycling start-ups rely on the Closing the Waste Loop program to prove technology readiness. Because co-funding neutralizes first-loss risk, small and medium enterprises can move into niches like optical sorting, anaerobic digestion, or plastics pyrolysis. A competitive grant cycle also shortens the time from lab prototype to commercial plant, pulling innovation into the mainstream of the Singapore waste management market.
Restraints Impact Analysis*
| Restraint | (~) % Impact on CAGR Forecast | Geographic Relevance | Impact Timeline |
|---|---|---|---|
| Scarcity of land for new facilities | -0.9% | National | Long term (≥ 4 years) |
| High capital expenditure of advanced treatment assets | -0.7% | National | Medium term (2-4 years) |
| Rising operating costs from labor, fuel, and carbon taxes | -0.6% | National | Short term (≤ 2 years) |
| Volatile recyclables prices in a small domestic market | -0.4% | National | Short term (≤ 2 years) |
| Source: Mordor Intelligence | |||
Scarcity of Land for New Facilities
Competing land uses raise opportunity costs, and only a handful of industrial plots remain zoned for odorous or potentially hazardous activities. Multi-story or subterranean designs can compress footprints but raise capex and O&M intricacy. Operators must design for higher throughput in the same envelope, which in turn raises technology risk and insurance premiums. Recycling centers need lay-down yards for baled goods, yet affordable space near collection zones is scarce, limiting new entrants.
High Capital Expenditure of Advanced Treatment Assets
Modern incinerators and chemical recyclers cost hundreds of millions of dollars to build, which narrows the field to firms with deep balance sheets or sovereign backing. TuasOne exceeded USD 740 million for a 3,600 t-per-day line, and the IWMF rings in above USD 3.7 billion. Smaller companies struggle to raise that scale of debt, and protracted permitting rounds stretch payback periods. Public-private partnerships defray risk but add complexity and extend tender cycles, slowing innovation adoption in the Singapore waste management market.
*Our forecasts treat driver/restraint impacts as directional, not additive. The impact forecasts reflect baseline growth, mix effects, and variable interactions.
Segment Analysis
By Source: Residential Waste Dominates, Commercial Waste Accelerates
Residential streams captured a commanding 39.12% share of the Singapore waste management market in 2025 as Housing Development Board estates and condominiums generated steady daily tonnage. Commercial waste is the fastest riser, expanding at a 6.31% CAGR on the back of RSA-mandated food-waste segregation, electronics take-back kiosks, and green-lease requirements that compel malls to file waste-reduction plans. The residential backbone ensures base-load demand for public-sector collection routes, yet private haulers now court hotels and business parks with pay-as-you-throw schemes that bundle composters and real-time bin-level sensors.
Growth in the commercial slice also reflects aggressive service diversification. Chain eateries have begun installing 2 t-per-day digesters sourced from local start-ups such as Westcom Bio-Chem, shrinking disposal volumes at source. Office towers adopt Bluetooth-enabled compactors to unlock data that feeds ESG dashboards. Because these innovations go beyond traditional curbside pickup, operators secure higher-margin contracts that underpin the future value of the Singapore waste management market.


By Service Type: Collection Rules Revenue, Resource Recovery Leads Growth
Collection, transport, and sorting still represent 47.15% of 2025 revenue, embodying the logistics backbone of the Singapore waste management market. Trucks make short urban hops to transfer stations, supported by Telematics that cut idle time. Yet the recycling and resource-recovery cluster is on a 6.42% CAGR trajectory through 2031. One example is REMEX’s bottom-ash processing plant that recovers 90% of ferrous metals from incinerator ash, monetizing an otherwise wasted stream.
Technology upgrades lift margins in recycling. Shell’s new pyrolysis oil upgrader turns 50,000 t of hard-to-recycle plastics into cracker feedstock at Pulau Bukom, signaling how resource recovery will dominate incremental dollar value. These moves reposition Singapore as a regional node for high-value circular materials, and they embed the Singapore waste management market size into the petrochemical supply chain.
By Waste Type: Municipal Solid Waste Leads, E-waste Picks Up Pace
Municipal solid waste retained 26.10% of the 2025 volume, giving it the largest slice of the Singapore waste management market. Households supply paper, plastics, and organics that flow into centralized bins under the National Recycling Program. E-waste is the clear growth leader at 5.32% CAGR. Extended Producer Responsibility and Alba’s doorstep bulky-item pick-ups, starting in 2025, add predictable tonnage. White-goods and IT peripherals now enter disassembly lines equipped with robotic arms that retrieve copper and precious metals.
Industry groups note that smartphones achieve more than 90% material recovery once manually pre-sorted, lifting the revenue per tonne above USD 800. In contrast, municipal mixed waste yields less than USD 30 per tonne after incineration. This divergence in value density underscores why e-waste will gradually tilt revenue mix away from bulk refuse within the Singapore waste management market.
By Contract Model: Public Collectors Still Dominate, Private Deals Advance
Public contracts, assigned to six sector monopolies via the NEA tender process, accounted for 73.05% market share in 2025. They ensure uniform service quality and city-wide coverage. Private arrangements, however, are growing 5.04% annually because industrial estates, shopping centers, and event venues can appoint any licensed General Waste Collector. Private service menus include on-site shredders, weighbridge integration into ERP systems, and carbon-offset packages.
The private surge benefits technology-first entrants who differentiate on data analytics and traceability. For example, Blue Planet Environmental deploys RFID-tagged bins that feed dashboards for corporate ESG disclosures. Coupled with favorable grant schemes, such features accelerate client conversion and dilute the concentration of the Singapore waste management market share held by legacy players.
Geography Analysis
Singapore’s entire nation acts as one integrated market, yet spatial waste patterns reflect land use clusters. High-rise residential zones around Tampines and Punggol create predictable household streams that anchor collection route density. Industrial belts in Jurong and Tuas discharge solvents, by-products, and scrap metals that require specialized transport permits. Tourist corridors downtown push retailers toward seven-day collection cycles to manage food residue amid dense foot traffic.
The Tuas industrial corridor houses WTE plants, ash treatment, and a new hydrogen pilot, turning the west of the island into a processing nucleus. Having core assets side by side slashes internal haulage and enables shared utilities like seawater intake and grid interconnection. That proximity sets Singapore apart from sprawling land-rich nations and binds the Singapore waste management market size tightly to a single logistics hub.
Regional logistics capabilities create export potential. The port handles 37 million TEUs annually, so backhaul routes can carry processed scrap to Indonesia or Vietnam, where metal smelters pay higher premiums. Nevertheless, strict transboundary waste controls limit raw refuse imports, ensuring domestic flows remain self-contained and traceable.
Competitive Landscape
The field is moderately concentrated. SembWaste, Veolia Singapore, and ALBA W&H Smart City secure multiyear municipal concessions and invest in automated sorting lines. SembWaste co-owns WTE assets that provide baseload revenue, yet its parent plans a strategic refocus on renewables, hinting at potential divestments that could shift ownership patterns. Veolia applies global hazardous-waste know-how to win petrochemical contracts in Jurong Island.
Tech-led challengers are emerging. Magorium converts unrecyclable plastics into road-grade NEWBitumen and quadrupled output to 8 t per day in 2024. Westcom Bio-Chem installs modular digesters in food courts. Blue Planet installs AI vision systems that sort recyclables by polymer type at 4 t per hour. These niches carve out profitable lanes without directly colliding with incumbent residential collectors.
Foreign OEMs also play a role. Mitsubishi Heavy Industries runs TuasOne under a 25-year BOO concession, showcasing turnkey incinerator packages that include air-quality systems. Such deployments raise the technological bar, forcing smaller local players to ally with equipment vendors or risk obsolescence within the Singapore waste management market.
Singapore Waste Management Industry Leaders
SembWaste (Sembcorp)
Veolia Singapore
ALBA W&H Smart City
Colex Holdings Ltd.
800 Super Holdings
- *Disclaimer: Major Players sorted in no particular order

Recent Industry Developments
- March 2025: Sembcorp Industries began a strategic review that may include privatization, following a USD 300 million sale of its waste arm in 2024.
- February 2025: NEA expanded the Climate Friendly Households Programme to USD 296 vouchers for 90% of households, boosting demand for energy-efficient appliances that reduce waste.
- August 2024: Magorium scaled up NEWBitumen production from unrecyclable plastics, diverting 8 t from incineration weekly.
- July 2024: NEA licensed Beverage Container Return Scheme Ltd. to administer the national deposit system from Apr 2026, with 1,000 return points targeting 80% recovery.


Singapore Waste Management Market Report Scope
Waste management or waste disposal includes the processes and actions required to manage waste from its inception to its final disposal. This includes the collection, transport, treatment, and disposal of waste, together with monitoring and regulation of the waste management process and waste-related laws, technologies, and economic mechanisms.
A complete background analysis of the Singapore waste management market, which includes an assessment of the economy and contribution of sectors in the economy, market overview, market size estimation for key segments, and emerging trends in the market segments, market dynamics, is covered in the report.
The Singapore waste management market is segmented by waste type (industrial waste, municipal solid waste, hazardous waste, e-waste, plastic waste, and bio-medical waste), and by disposal methods (collection, landfills, incineration, and recycling). The report offers market size and forecasts in (USD) values for all the above segments.
By Source
| Residential |
| Commercial (retail, office, etc.) |
| Industrial |
| Medical (Health and Pharmaceutical) |
| Construction & Demolition |
| Others (institutional, agricultural, etc) |
By Service Type
| Collection, Transportation, Sorting & Segregation | |
| Disposal / Treatment | Landfill |
| Recycling & Resource Recovery | |
| Incineration & Waste-to-Energy | |
| Others (Chemical Treatment, Composting, etc.) | |
| Others (Consulting, Audit & Training, etc.) |
By Waste Type
| Municipal Solid Waste |
| Industrial Hazardous Waste |
| E-waste |
| Plastic Waste |
| Biomedical Waste |
| Construction & Demolition Waste |
| Agricultural Waste |
| Other Specialized Waste (radio active, etc) |
By Contract Model
| Public |
| Private |
| By Source | Residential | |
| Commercial (retail, office, etc.) | ||
| Industrial | ||
| Medical (Health and Pharmaceutical) | ||
| Construction & Demolition | ||
| Others (institutional, agricultural, etc) | ||
| By Service Type | Collection, Transportation, Sorting & Segregation | |
| Disposal / Treatment | Landfill | |
| Recycling & Resource Recovery | ||
| Incineration & Waste-to-Energy | ||
| Others (Chemical Treatment, Composting, etc.) | ||
| Others (Consulting, Audit & Training, etc.) | ||
| By Waste Type | Municipal Solid Waste | |
| Industrial Hazardous Waste | ||
| E-waste | ||
| Plastic Waste | ||
| Biomedical Waste | ||
| Construction & Demolition Waste | ||
| Agricultural Waste | ||
| Other Specialized Waste (radio active, etc) | ||
| By Contract Model | Public | |
| Private | ||


Key Questions Answered in the Report
How big is the Singapore waste management market in 2026?
The market is valued at USD 1.4 billion in 2026 and is projected to reach USD 1.73 billion by 2031.
What is the main growth driver for Singapore’s waste sector?
The Zero-Waste Masterplan, which mandates a 70% recycling rate and caps landfill volumes, is the leading catalyst.
Which waste stream is growing the fastest?
E-waste is the fastest-expanding stream, advancing at a 5.32% CAGR due to Extended Producer Responsibility rules and free doorstep collections.
Why are grants important in Singapore’s waste market?
NEA grants reimburse up to 80% of project costs, enabling SMEs to adopt advanced recycling and treatment technologies with lower capital risk.
How will Tuas Nexus reshape the sector?
Tuas Nexus integrates waste, water, and energy systems, lifting processing capacity to 5,800 t daily and piloting waste-derived hydrogen production.
What risks do operators face in the next two years?
Rising labor costs, escalating carbon taxes, and volatile recyclables prices threaten margins, pressuring firms to automate and diversify revenue streams.
Page last updated on:


