Tablet Hardness Testers Market Size and Share
Market Overview
| Study Period | 2019 - 2030 |
|---|---|
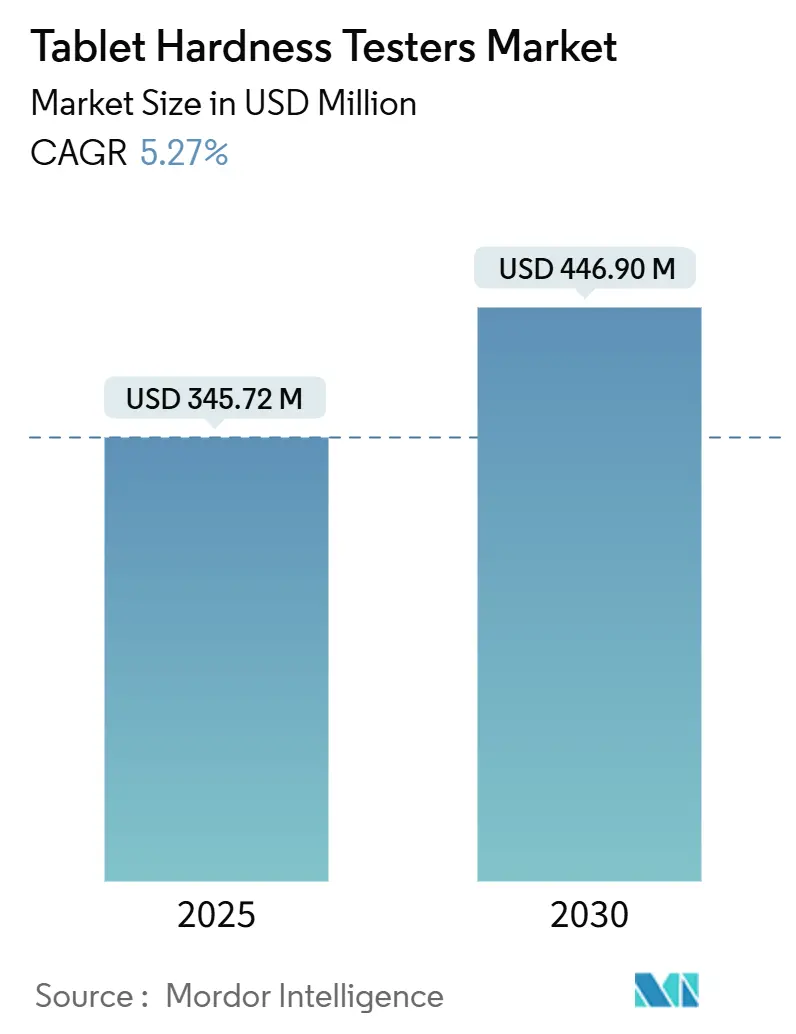
| Market Size (2025) | USD 345.72 Million |
| Market Size (2030) | USD 446.90 Million |
| Growth Rate (2025 - 2030) | 5.27% CAGR |
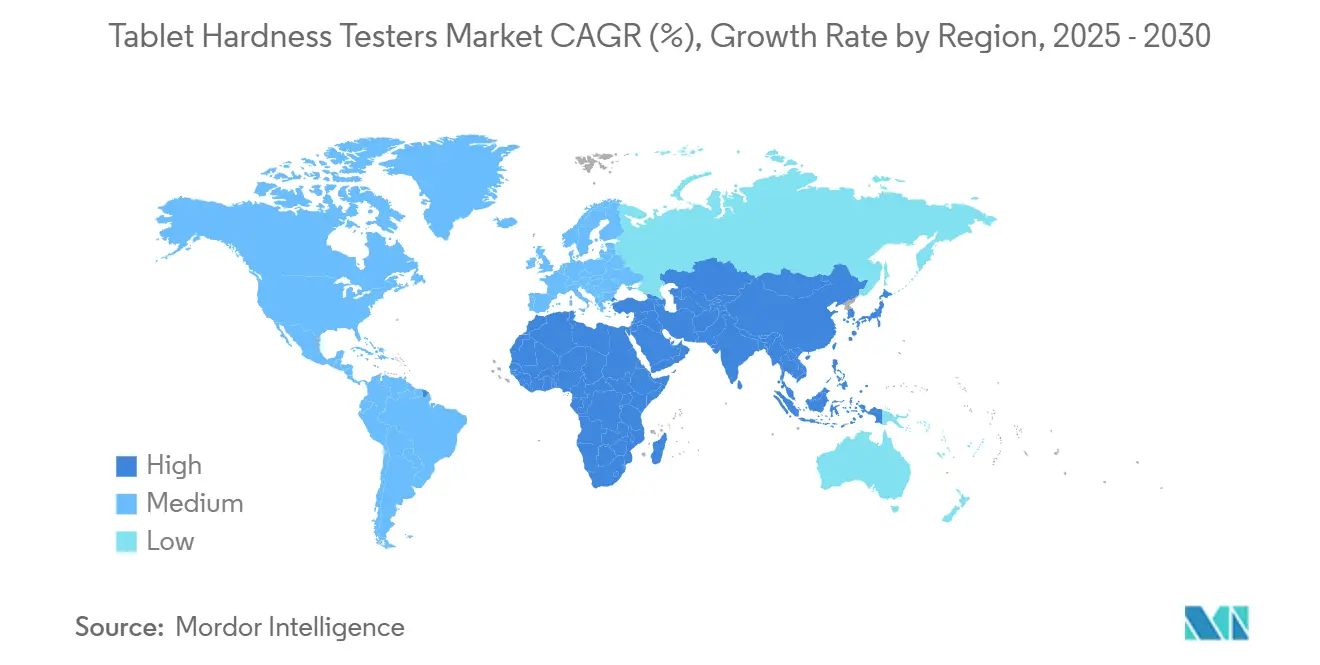
| Fastest Growing Market | Asia Pacific |
| Largest Market | Asia Pacific |
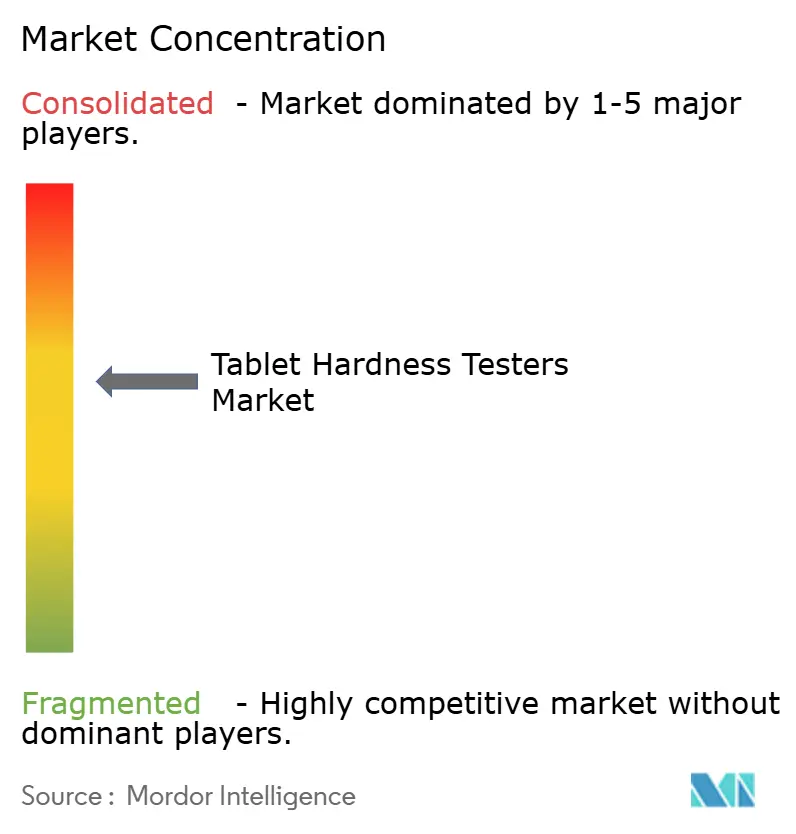
| Market Concentration | Medium |
Major Players *Disclaimer: Major Players sorted in no particular order Image © Mordor Intelligence. Reuse requires attribution under CC BY 4.0. | |
Tablet Hardness Testers Market Analysis by Mordor Intelligence
The tablet hardness testers market size stands at USD 345.72 million in 2025 and is forecast to reach USD 446.90 million by 2030, advancing at a 5.27% CAGR through the period. Sustained growth reflects pharmaceutical manufacturers’ emphasis on reliable, repeatable quality-control parameters that underpin tablet integrity and regulated drug-release profiles.[1]UNITED STATES PHARMACOPEIA, “Bulk Density of Powders,” USP.orgAutomated inspection lines, tightening global pharmacopeial rules, and wider adoption of continuous manufacturing collectively widen the installed base of tablet hardness testers market equipment in both mature and emerging production hubs. Asia-Pacific’s manufacturing expansion, North America’s early uptake of digital compliance tools, and Europe’s enforcement of updated European Pharmacopoeia chapters create a balanced demand landscape. Load-cell-based technologies, cloud-connected data managers, and multi-parameter integration now shape competitive differentiation as firms seek to align instrument design with evolving 21 CFR Part 11 data-integrity expectations.
Key Report Takeaways
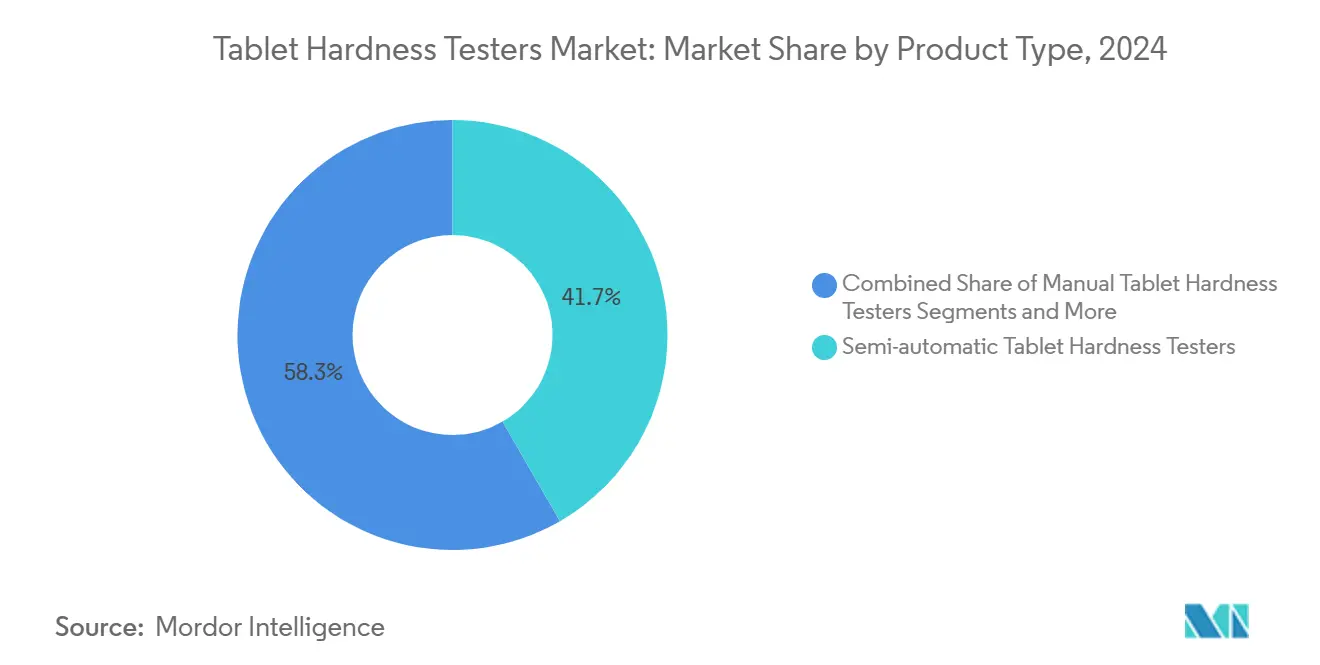
- By product type, semi-automatic testers held 41.66% of tablet hardness testers market share in 2024 while fully automatic systems are posting a 9.77% CAGR through 2030.
- By measurement principle, load-cell instruments led with 46.52% tablet hardness testers market share in 2024 and remain the fastest-growing at an 8.37% CAGR.
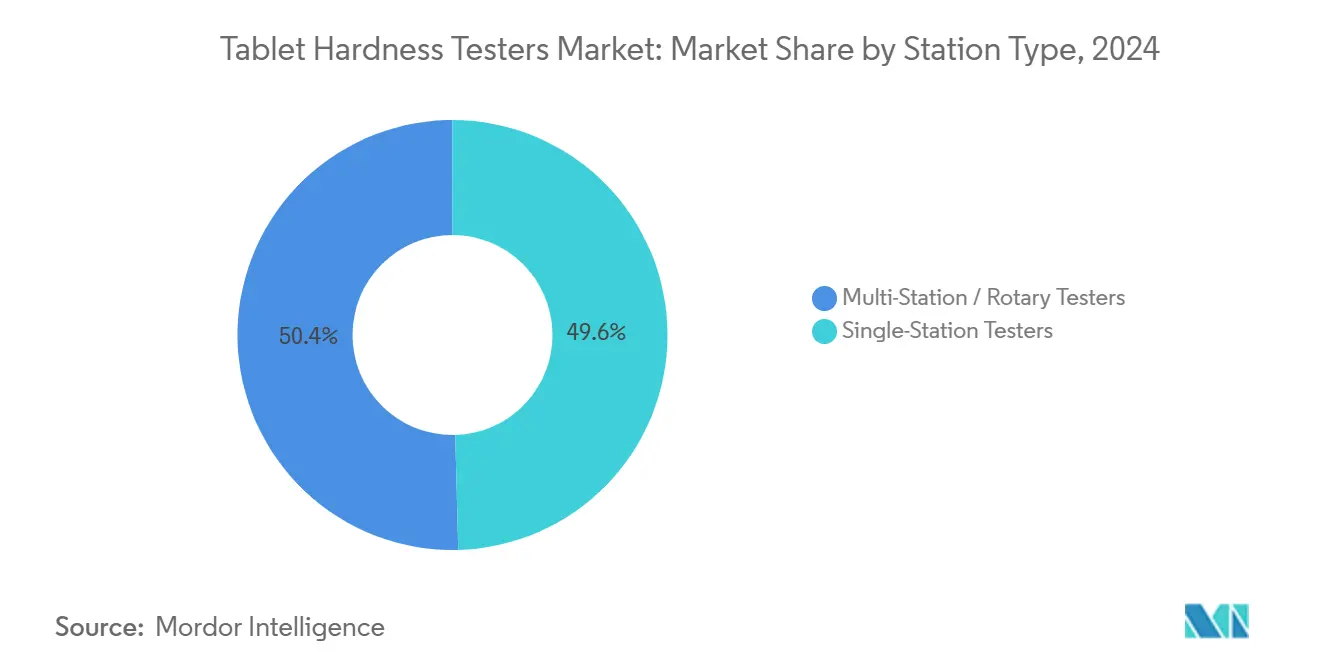
- By station configuration, single-station models accounted for 49.58% of the tablet hardness testers market size in 2024; multi-station units are projected to expand at 9.12% CAGR to 2030.
- By end user, pharmaceutical manufacturers contributed 61.23% revenue in 2024, whereas CMOs represent the highest-growth cohort at an 8.33% CAGR.
- By geography, Asia-Pacific commanded 34.27% revenue in 2024 and is set to grow at a 7.46% CAGR to 2030.
Global Tablet Hardness Testers Market Trends and Insights
Drivers Impact Analysis*
| Driver | (~) % Impact on CAGR Forecast | Geographic Relevance | Impact Timeline |
|---|---|---|---|
| Stringent pharmacopeial regulations mandating routine hardness testing | +1.2% | North America, EU, global spill-over | Medium term (2-4 years) |
| Growing global tablet production volumes | +0.8% | Asia-Pacific core, MEA extension | Long term (≥ 4 years) |
| Shift toward automated quality control in pharma manufacturing | +0.6% | North America & EU spearhead, Asia-Pacific uptake | Medium term (2-4 years) |
| Rising demand for multi-parameter integrated testers | +0.4% | Premium adoption in developed markets | Long term (≥ 4 years) |
| Adoption of continuous manufacturing requiring in-line hardness monitoring | +0.3% | Regulated North American & EU plants | Short term (≤ 2 years) |
| Need for tamper-evident abuse-deterrent formulations with higher hardness accuracy | +0.2% | U.S. abuse-deterrent opioid segment | Medium term (2-4 years) |
| Source: Mordor Intelligence | |||
Stringent Pharmacopeial Regulations Mandating Routine Hardness Testing
Global harmonization of testing chapters—such as USP 1217 updates effective August 2025 and European Pharmacopoeia Supplement 11.7 in force from April 2025—continues to tighten acceptance limits and documentation requirements for tablet hardness readings.[2]UNITED STATES PHARMACOPEIA, “Pharmacopeial Forum: 5 Things You Should Know,” USP.org North American and European plants have already embedded automated transmit-and-archive functionality to satisfy 21 CFR Part 11 audit trails, prompting equipment retrofits in Asia-Pacific as exported batches must meet identical release criteria. FDA site-inspection intensity and the financial penalty of non-compliance reinforce the business case for compliant hardware that minimizes operator variability and secures validated calibration workflows. Manufacturers adopting certified testers lower audit risk, accelerate time-to-market, and reduce re-testing costs. This rule-driven replacement cycle sustains demand even in otherwise mature facilities.
Growing Global Tablet Production Volumes
Surging chronic-disease prevalence and government-backed generics policies continue to lift unit output, especially in India and China where new large-volume lines raise daily throughput benchmarks beyond 200,000 tablets per press shift. Each additional rotary press triggers proportional purchases of precision testers, creating a direct multiplier effect on the tablet hardness testers market. Lower labor costs and expanded GMP zones in Southeast Asia further amplify equipment deployment, while burgeoning nutraceutical facilities in the region adopt pharmaceutical-grade instrumentation to attract export contracts. The link between higher batch sizes and statistical sampling mandates ensures steady baseline demand irrespective of macroeconomic cycles.
Shift Toward Automated Quality Control in Pharma Manufacturing
Industry 4.0 initiatives prioritize closed-loop controls that pair in-line sensors with manufacturing execution systems. Fully automatic tablet hardness testers fitted with load-cells and robotic arms now transmit every result directly to cloud repositories, trimming manual transcription errors and enabling predictive maintenance analytics. Return on investment is bolstered through reduced operator hours and faster batch-release approvals. Early adopters in North America report double-digit reductions in deviation investigations, prompting copy-cat investments in Europe and, increasingly, Asia-Pacific. Vendors differentiating via open communication protocols and cyber-security certification gain an edge as IT teams demand seamless system validation.
Rising Demand for Multi-Parameter Integrated Testers
Quality units seek compact workstations that deliver hardness, thickness, diameter, and weight in a single automated cycle. Integrated modules reduce sample handling, improve cross-parameter correlation, and shorten laboratory turnaround times, features especially prized in high-speed continuous manufacturing lines. Premium-priced multi-parameter platforms thus outperform overall market averages, aided by regulatory encouragement to map Design of Experiments (DoE) data across multiple critical quality attributes. Vendors offering retrofit kits for legacy testers capture budget-constrained customers seeking incremental, not wholesale, upgrades.
Restraints Impact Analysis*
| Restraint | (~) % Impact on CAGR Forecast | Geographic Relevance | Impact Timeline |
|---|---|---|---|
| High capital cost of fully automatic testers for small manufacturers | -0.7% | Cost-sensitive Asia-Pacific & MEA | Short term (≤ 2 years) |
| Availability of alternative non-destructive testing methods | -0.5% | R&D-intensive U.S., EU labs | Long term (≥ 4 years) |
| Compliance challenges with 21 CFR Part 11 data integrity in emerging markets | -0.4% | Asia-Pacific, Latin America | Medium term (2-4 years) |
| Calibration inconsistencies across brands impacting reproducibility | -0.3% | Multi-site global operations | Medium term (2-4 years) |
| Source: Mordor Intelligence | |||
High Capital Cost of Fully Automatic Testers for Small Manufacturers
List-price tags surpassing USD 100,000 for six-station robotic models deter smaller generic producers that operate thin margins, especially in markets where pay-back periods exceed three years. These firms often opt for semi-automatic units that satisfy basic GMP sampling using a single load-cell with manual tablet placement. Financing options and vendor leasing programs can offset sticker shock, yet credit constraints and volatile exchange rates postpone widespread upgrades in lower-income countries. As a result, the premium segment’s growth, while robust, remains skewed toward top-tier multinationals rather than the broader SME base.
Availability of Alternative Non-Destructive Testing Methods
Near-infrared spectroscopy (NIRS) and acoustic-emission tools offer real-time, non-invasive strength proxies, preserving valuable high-potency tablets for sale while achieving 100% inspection coverage. Early adopters in specialty oncology lines now offset part of their destructive-test frequency with inline NIRS mappings. Although regulatory guidelines still require destructive confirmation at defined intervals, incremental substitution curbs overall tester demand growth in advanced facilities. Long term, wider validation of non-destructive hardness surrogates could erode replacement cycles for physical testers.
*Our forecasts treat driver/restraint impacts as directional, not additive. The impact forecasts reflect baseline growth, mix effects, and variable interactions.
Segment Analysis
By Product Type: Automation Drives Premium Growth
Semi-automatic instruments delivered 41.66% tablet hardness testers market share in 2024, confirming their appeal to mid-scale formulators who balance throughput against spend limits. The fully automatic cohort, while smaller, is expanding at a 9.77% CAGR as top-10 pharmaceutical companies lean on end-to-end robotics to shrink cycle times and strengthen audit readiness. Manual testers now occupy niche territory in R&D benches where single-tablet proof studies precede scale-up. Meanwhile, demand for multi-parameter rigs—combining hardness, weight, diameter, and thickness—intensifies as plants push for lean-lab footprints and unified data historians.
The automation wave dovetails with wider Industry 4.0 roadmaps. Digital twin pilots illustrate how real-time hardness feeds can inform press-roller gap adjustments, cutting reject ratios in continuous lines by up to 30%. Vendors promoting predictive maintenance dashboards witness lower service-contract churn, signaling customer preference for analytics-rich ecosystems. Although capital-heavy, automatic testers unlock staffing efficiencies that resonate in regions facing skilled-labor shortages, underpinning their above-average growth track.


By Measurement Principle: Load-Cell Technology Dominance
Load-cell machines controlled 46.52% of 2024 revenue, out-performing strain-gauge designs that still populate older pilot plants. Precision to ±0.5 N, temperature stability, and minimal hysteresis underpin their 8.37% CAGR outlook through 2030. Strain-gauge devices persist where budget supersedes high-resolution needs, yet even cost-focused buyers increasingly migrate as comparison studies favor load-cell repeatability.
The technological pivot stems from regulatory insistence on tighter acceptance ranges and traceable calibration certificates. Adoption of digital conditioning electronics reduces noise and extends service intervals, enhancing total cost-of-ownership arguments. Suppliers integrating Bluetooth-enabled reference weights streamline daily check routines, another plus for lean laboratories seeking to minimize downtime.
By Station Type: Multi-Station Systems Gain Momentum
Single-station testers still dominated in 2024 with 49.58% share, valued for modularity and ease of validation. Nonetheless, multi-station and rotary benches are advancing at 9.12% CAGR as mega-plants standardize high-capacity sampling to match presses yielding over 250,000 tablets per hour. Parallel testing shortens batch-release timelines, a decisive competitive factor in crowded generic launches where first-to-market advantage secures price premiums.
Innovation centers on automatic carousel loaders that eliminate manual transfer errors while keeping footprint compact. Integration with barcode-scanning modules enhances traceability, a feature welcomed by auditors. Capital-cost hurdles remain, but leasing models and pay-per-use analytics platforms lower entry barriers for regional contract manufacturers.
By End User: CMO Segment Accelerates
Pharmaceutical originators retained 61.23% of global spend in 2024, reflecting their responsibility for final-dose quality. Contract manufacturing organizations, however, are the fastest-growing buyers, delivering an 8.33% CAGR through 2030 because brand-owners increasingly outsource tablet production to focus on discovery pipelines. India’s CDMO sector, buoyed by geopolitical supply-chain shifts, accelerates equipment procurement to satisfy multinational compliance audits.
Nutraceutical plants—once content with basic hardness checks—now mimic pharmaceutical standards as export markets tighten supplement regulations. Research laboratories round out demand for high-precision single-tablet studies, favoring flexible software that supports Design-of-Experiments protocols.
Geography Analysis
Asia-Pacific led the tablet hardness testers market with 34.27% revenue in 2024 and posts the fastest 7.46% CAGR to 2030. Surging generics output in India and ongoing modernization of Chinese factories headline growth catalysts, while Southeast Asian contract sites rise as cost-competitive alternatives. Government incentives that subsidize GMP capital goods amplify purchasing power, and the planned launch of Shimadzu’s Karnataka analytical-instrument factory in 2027 further entrenches regional supply resilience.
North America, though mature, remains a technology frontrunner, driven by FDA scrutiny and early adoption of fully automatic, data-integrity-compliant rigs. Recent reshoring initiatives, coupled with restrictions on certain overseas biotech partnerships, channel fresh capex toward domestic plants that demand advanced hardness testers with cyber-secure audit logs. Europe holds solid share thanks to established innovators in Germany and Switzerland. Impending European Pharmacopoeia revisions spur laboratory upgrades, and energy-efficiency preferences steer purchasing toward low-wattage drive systems.[3]EUROPEAN DIRECTORATE FOR THE QUALITY OF MEDICINES, “Implementation of Ph. Eur. 11.7,” Edqm.eu
Middle East & Africa and South America presently trail but exhibit double-digit unit growth off a small base. Government push for local drug manufacturing and donor-funded capacity-building projects aid gradual procurement upticks. Multinational suppliers partnering with local distributors to provide after-sales calibration services win early contracts, fostering long-term brand loyalty.

Competitive Landscape
The tablet hardness testers market is moderately fragmented. Core incumbents—Sotax AG, Erweka GmbH, and Shimadzu Corporation—defend share via continuous product refreshes. Shimadzu’s analytical-measuring segment clocked record net sales of JPY 539,047 million in fiscal 2025, underscoring strong uptake of its load-cell series. European rivals leverage long-standing reputations for mechanical robustness and comprehensive IQ/OQ documentation packs that appeal to GMP auditors.
Strategic thrusts revolve around integrating artificial-intelligence modules capable of trend-analysis alerts, plus subscription-based calibration monitoring that yields recurring revenue. U.S.-based instrument majors extend reach via bolt-on acquisitions of specialty CDMOs, bundling hardware with process-analytics consulting. Smaller Asian challengers compete on price, targeting semi-automatic niches. Overall, top-five vendors collectively command an estimated 45% revenue share, leaving room for nimble entrants with differentiated value propositions in niche end markets such as veterinary pharmaceuticals or chewable nutraceuticals.
Tablet Hardness Testers Industry Leaders
Sotax AG
Erweka GmbH
Charles Ischi AG
Kraemer Elektronik GmbH
Pharma Test Apparatebau AG
- *Disclaimer: Major Players sorted in no particular order

Recent Industry Developments
- July 2025: ERWEKA unveiled the redesigned PTB 330 tablet hardness tester featuring a 7-inch color touchscreen and upgraded electronics, slated for Q3 2025 launch.
- November 2024: ERWEKA introduced the portable PTB-M100 manual tester, which is compliant with USP (1217) and EP (2.9.8) and capable of measuring up to 500 N.


Global Tablet Hardness Testers Market Report Scope
| Manual Tablet Hardness Testers |
| Semi-automatic Tablet Hardness Testers |
| Fully Automatic Tablet Hardness Testers |
| Multi-parameter Integrated Testers |
| Strain-Gauge Based |
| Load-Cell Based |
| Others |
| Single-Station Testers |
| Multi-Station / Rotary Testers |
| Pharmaceutical Manufacturers |
| Contract Manufacturing Organizations (CMOs) |
| Nutraceutical Companies |
| Research & Academic Laboratories |
| Others |
| North America | United States |
| Canada | |
| Mexico | |
| Europe | Germany |
| United Kingdom | |
| France | |
| Italy | |
| Spain | |
| Rest of Europe | |
| Asia-Pacific | China |
| Japan | |
| India | |
| Australia | |
| South Korea | |
| Rest of Asia-Pacific | |
| Middle East and Africa | GCC |
| South Africa | |
| Rest of Middle East and Africa | |
| South America | Brazil |
| Argentina | |
| Rest of South America |
| By Product Type | Manual Tablet Hardness Testers | |
| Semi-automatic Tablet Hardness Testers | ||
| Fully Automatic Tablet Hardness Testers | ||
| Multi-parameter Integrated Testers | ||
| By Measurement Principle | Strain-Gauge Based | |
| Load-Cell Based | ||
| Others | ||
| By Station Type | Single-Station Testers | |
| Multi-Station / Rotary Testers | ||
| By End User | Pharmaceutical Manufacturers | |
| Contract Manufacturing Organizations (CMOs) | ||
| Nutraceutical Companies | ||
| Research & Academic Laboratories | ||
| Others | ||
| By Geography | North America | United States |
| Canada | ||
| Mexico | ||
| Europe | Germany | |
| United Kingdom | ||
| France | ||
| Italy | ||
| Spain | ||
| Rest of Europe | ||
| Asia-Pacific | China | |
| Japan | ||
| India | ||
| Australia | ||
| South Korea | ||
| Rest of Asia-Pacific | ||
| Middle East and Africa | GCC | |
| South Africa | ||
| Rest of Middle East and Africa | ||
| South America | Brazil | |
| Argentina | ||
| Rest of South America | ||


Key Questions Answered in the Report
What is the projected value of the tablet hardness testers market by 2030?
The market is forecast to reach USD 446.90 million by 2030.
Which region is growing fastest for tablet hardness testers?
Asia-Pacific leads growth with a 7.46% CAGR driven by expanding pharmaceutical production.
Why are load-cell based testers preferred?
They offer superior accuracy, repeatability, and easier digital integration compared with strain-gauge alternatives.
How does automation influence purchasing decisions?
Fully automatic testers cut operator labor, speed batch release, and provide 21 CFR Part 11-ready data trails.
Which end-user segment is expanding at the highest rate?
Contract manufacturing organizations post the fastest uptake, growing at an 8.33% CAGR through 2030.
Page last updated on:


