
Test Strip Market Size and Share
Market Overview
| Study Period | 2020 - 2031 |
|---|---|
| Market Size (2026) | USD 17.29 Billion |
| Market Size (2031) | USD 20.66 Billion |
| Growth Rate (2026 - 2031) | 3.63 % |
| Fastest Growing Market | Asia Pacific |
| Largest Market | North America |
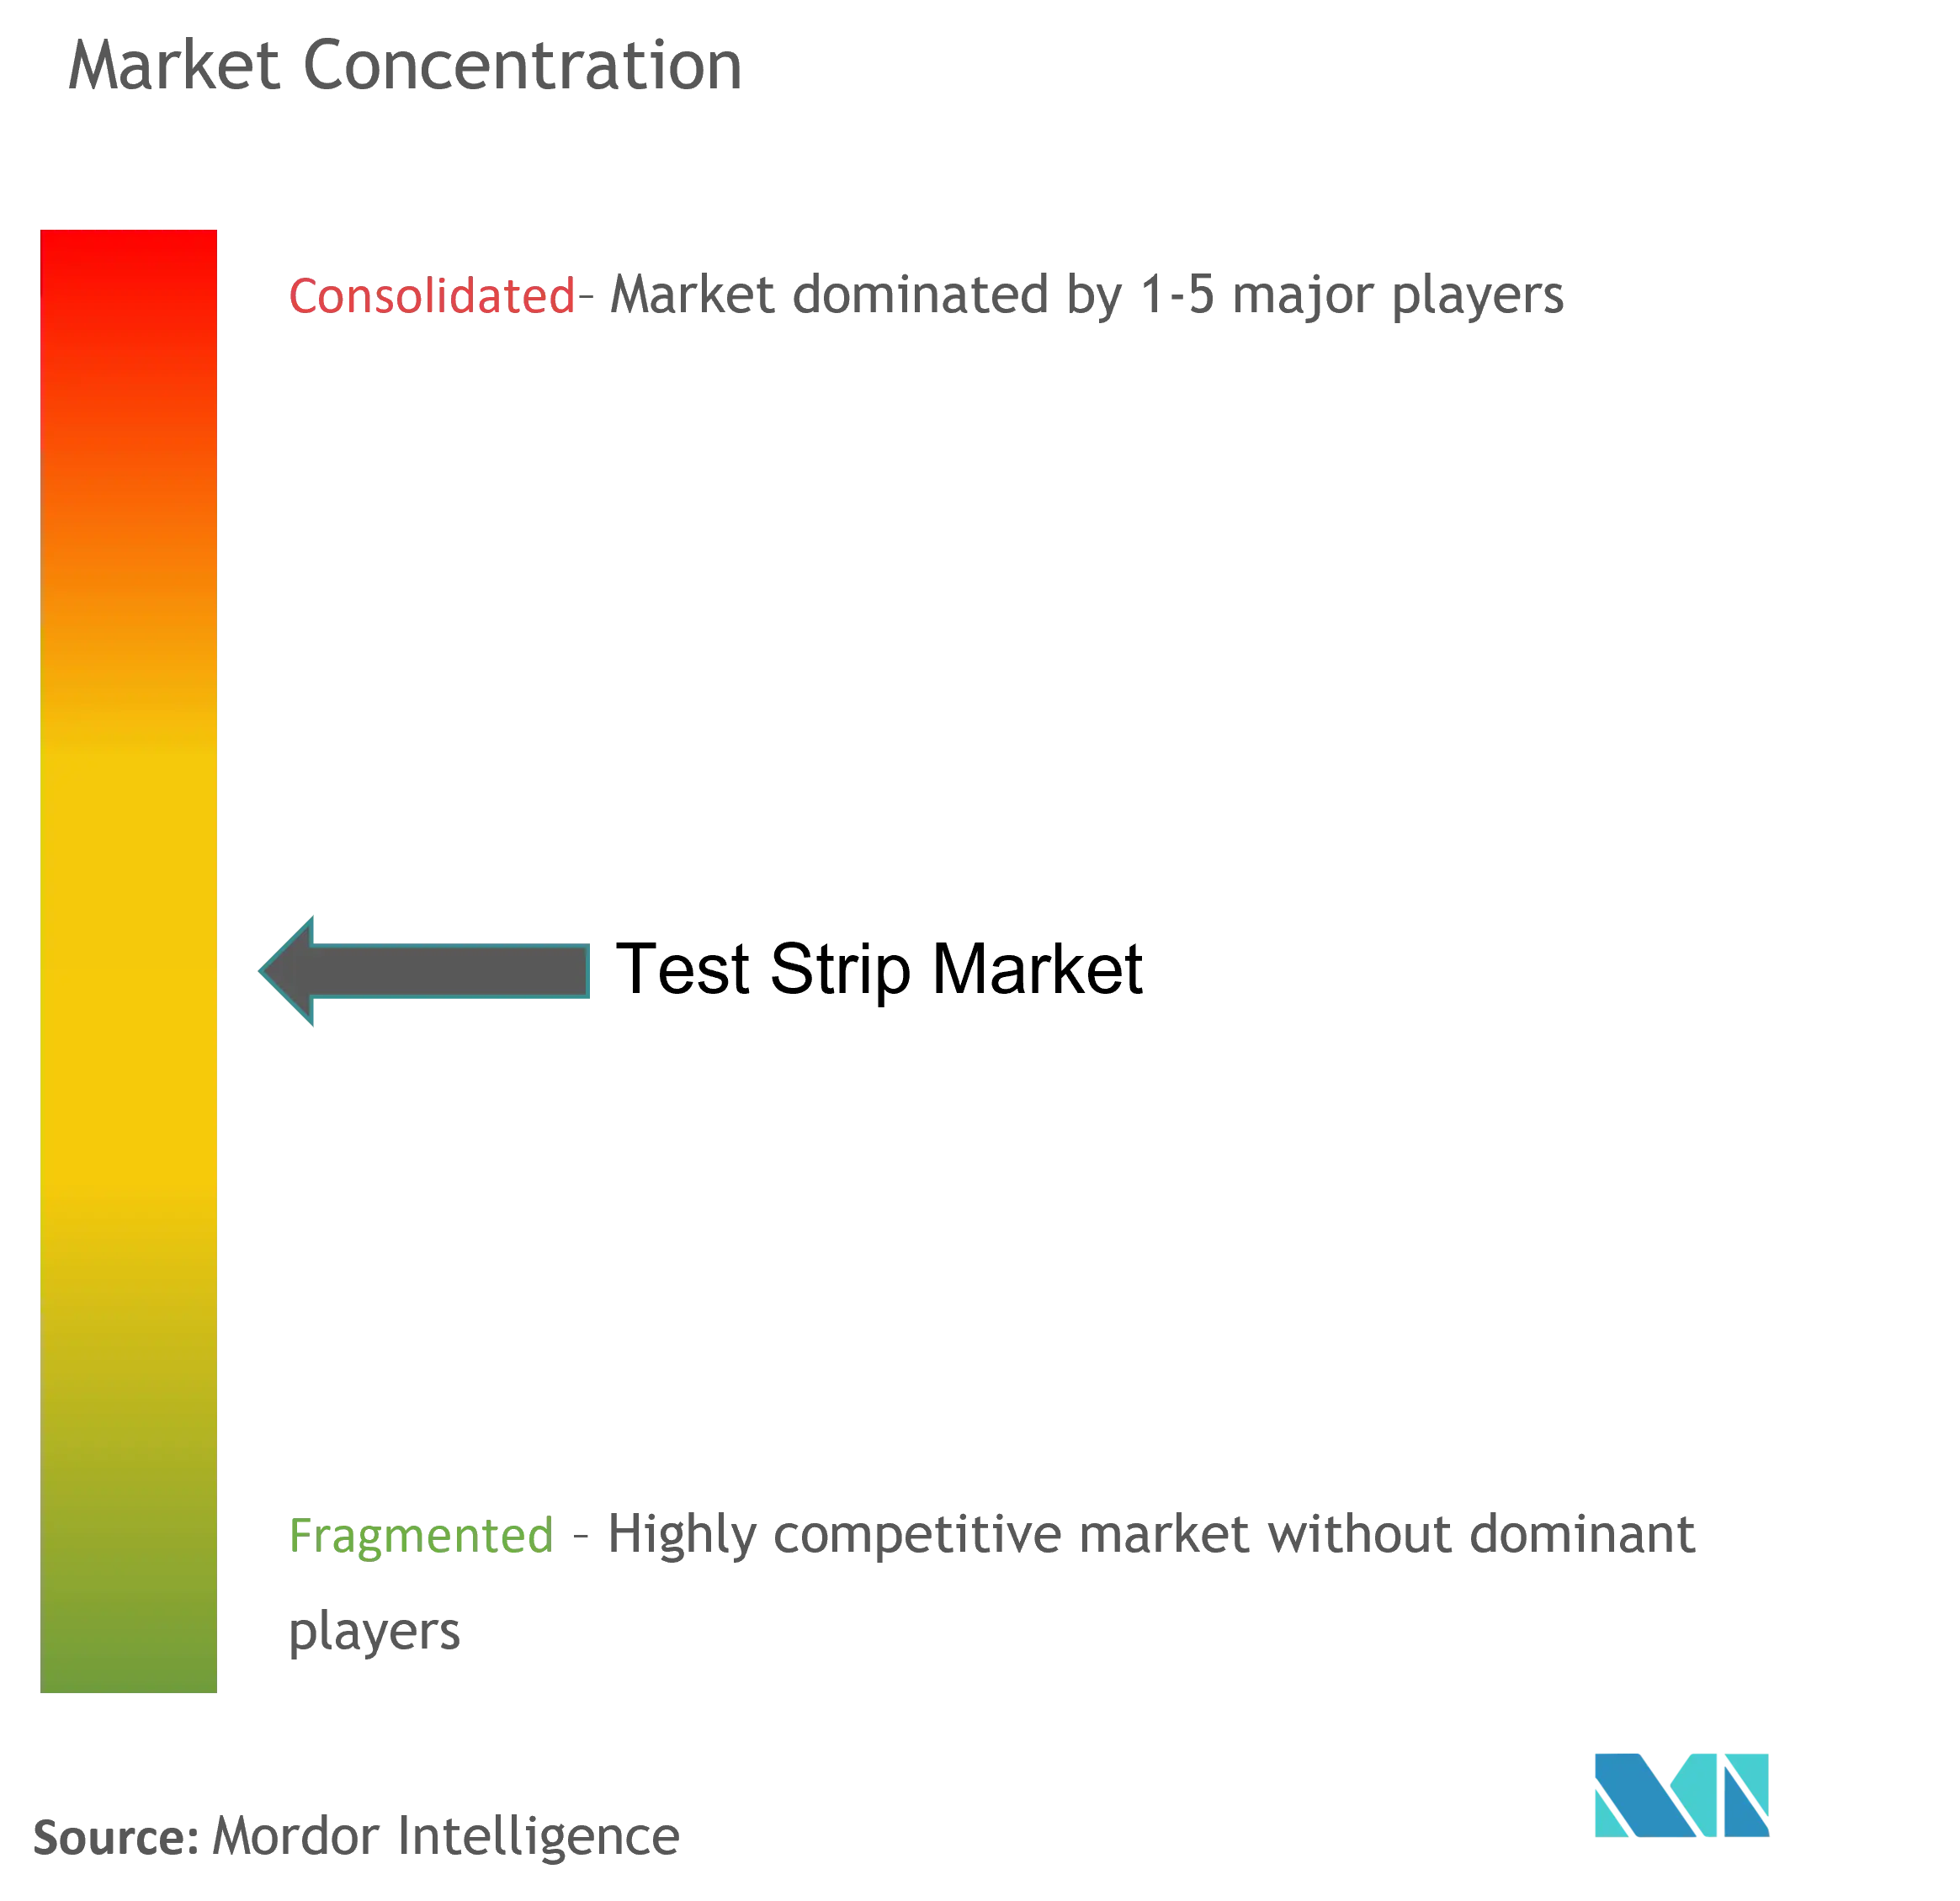
| Market Concentration | Medium |
Major Players *Disclaimer: Major Players sorted in no particular order Image © Mordor Intelligence. Reuse requires attribution under CC BY 4.0. | |
Test Strip Market Analysis by Mordor Intelligence
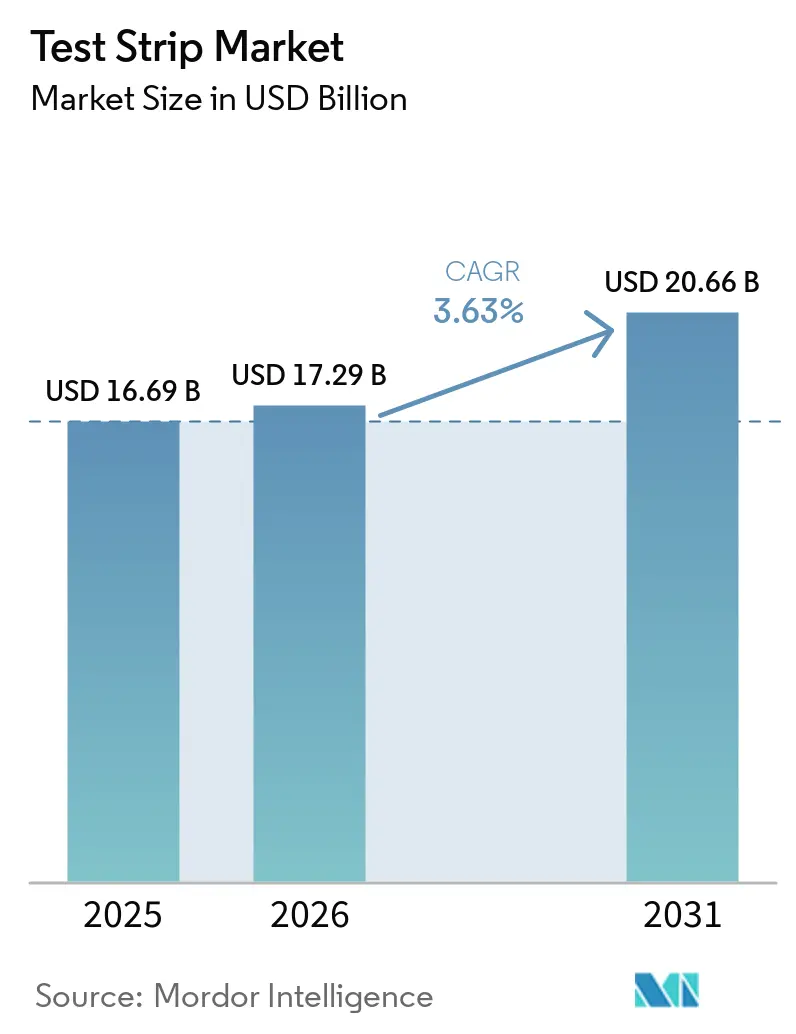
Test Strip market size in 2026 is estimated at USD 17.29 billion, growing from 2025 value of USD 16.69 billion with 2031 projections showing USD 20.66 billion, growing at 3.63% CAGR over 2026-2031. The trajectory reflects a sector balancing the gradual contraction of glucose-only demand against rising sales in multi-analyte, preventive, and home-based diagnostics. Blood glucose strips still represent the largest revenue pool, yet the swift uptake of urine panels, ketone checks, and pregnancy assays signals broader clinical utility. Regionally, North America anchors current revenue while Asia-Pacific supplies incremental volume growth, powered by rising diabetes prevalence and digital health adoption. Competitive intensity remains moderate as established brands respond to continuous glucose monitoring (CGM) cannibalization with technology upgrades and bundled digital ecosystems. Strategic risk centers on enzyme-coated substrate supply chains, although recombinant alternatives promise cost and quality gains.
Key Report Takeaways
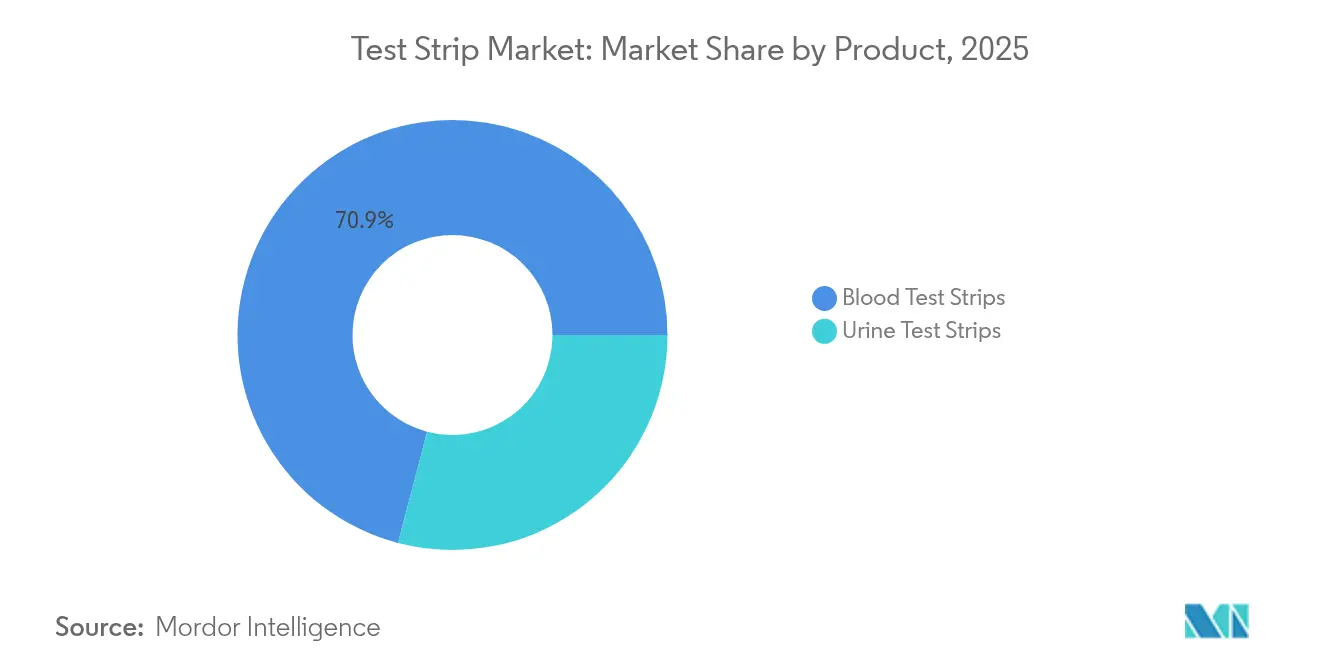
- By product, blood strips led with 70.92% revenue share in 2025, while urine strips are projected to advance at a 4.89% CAGR to 2031.
- By application, diabetes maintained 65.31% share of the test strip market size in 2025, whereas urinary tract infection screening is expanding at a 4.48% CAGR through 2031.
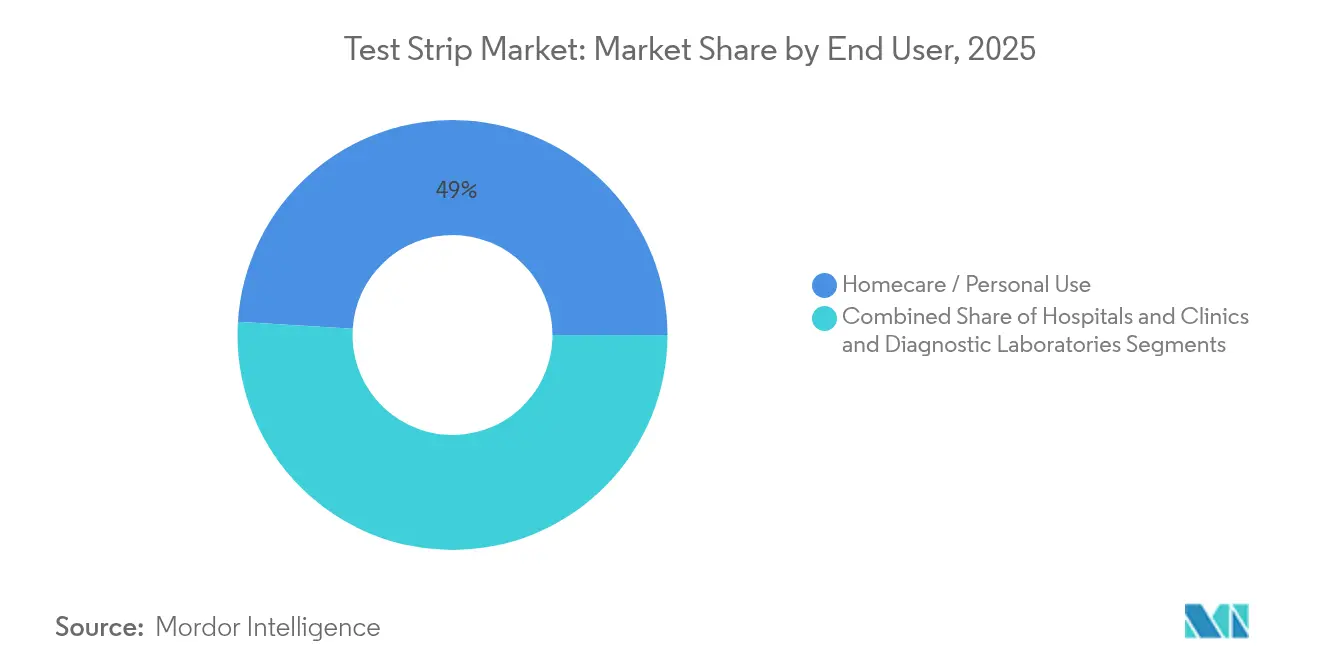
- By end user, the homecare segment captured 49.02% of the test strip market share in 2025 and is progressing at a 3.98% CAGR.
- By distribution channel, retail pharmacies held 60.58% of the test strip market size in 2025; online pharmacies register the fastest growth at 4.75% CAGR.
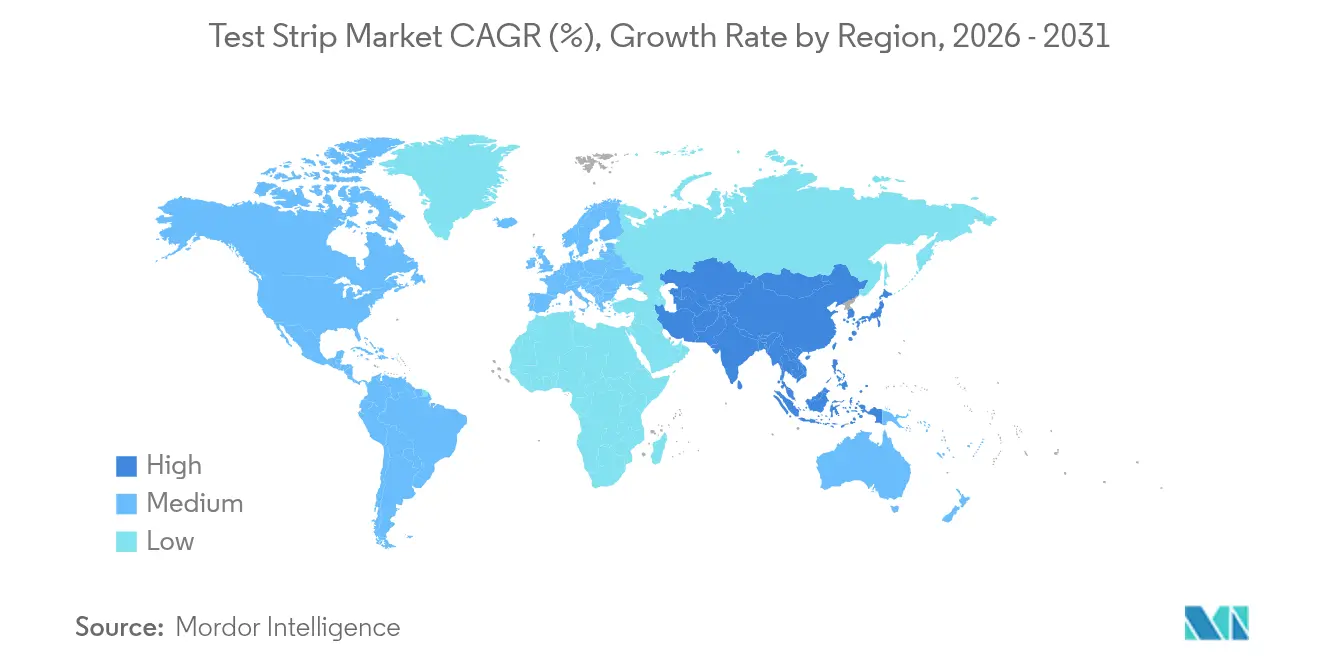
- North America dominated with 37.72% revenue share in 2025, yet Asia-Pacific will record the highest regional CAGR at 5.12% through 2031.
Note: Market size and forecast figures in this report are generated using Mordor Intelligence’s proprietary estimation framework, updated with the latest available data and insights as of 2026.
Market Trends and Insights
Drivers Impact Analysis of Test Strip Market*
| Driver | (~) % Impact on CAGR Forecast | Geographic Relevance | Impact Timeline |
|---|---|---|---|
| Surging Global Diabetes Prevalence | +0.8% | Global, with highest impact in Asia-Pacific and Middle East | Long term (≥ 4 years) |
| Preference Shift to Point-Of-Care Diagnostics | +0.6% | North America & EU, expanding to emerging markets | Medium term (2-4 years) |
| Continuous Technology Upgrades in Enzymatic Chemistries | +0.4% | Global, led by developed markets | Medium term (2-4 years) |
| Smartphone-Enabled Optical Strip Readers Gain Regulatory Green-Lights | +0.3% | North America & EU initially, global rollout | Short term (≤ 2 years) |
| Expanded Applications - UTIs, Pregnancy, etc. | +0.5% | Global, with faster adoption in developed markets | Medium term (2-4 years) |
| Supportive Healthcare Policies and Awareness | +0.4% | Global, varying by healthcare system maturity | Long term (≥ 4 years) |
| Source: Mordor Intelligence | |||
Surging Global Diabetes Prevalence
International Diabetes Federation models indicate that 783.2 million adults will have diabetes by 2045, up 46% from 2021 numbers.[1]Source: Sun Hong et al., “IDF Diabetes Atlas,” cdc.gov This epidemiological swell secures a large addressable base for self-monitoring tools. While higher caseloads support the test strip market, CGM uptake in high-income countries tempers per-patient strip volumes, with German data showing 40% usage declines post CGM initiation. This cannibalization effect suggests that while diabetes prevalence drives overall market expansion, the per-patient consumption of traditional test strips may decline in developed markets with high CGM penetration.
Preference Shift to Point-Of-Care Diagnostics
Point-of-care (POC) testing is growing annually, reinforcing healthcare moves toward decentralized, rapid results. FDA clearance of a hepatitis C RNA POC test and expanding EHR integrations,[2]Source: U.S. Food and Drug Administration, “FDA permits marketing of first POC hepatitis C RNA test,” fda.gov such as Abbott’s Epic linkage, strengthen clinical confidence in strip-based assays. The trend particularly benefits urine test strips for UTI screening, where 20 commercially available POC tests now provide results within hours compared to traditional 24-48 hour culture methods.
Continuous Technology Upgrades in Enzymatic Chemistries
Enzymatic chemistry innovations drive test strip accuracy improvements and expand measurable analyte ranges, with glucose dehydrogenase-based systems offering enhanced specificity over traditional glucose oxidase methods. Transition from glucose oxidase to dehydrogenase enhances specificity, while recombinant horseradish peroxidase secures supply continuity and cost stability. Microfluidics have dropped blood volume needs to 0.25 microliters as shown in the POGO Automatic system, lifting adherence among pediatric and geriatric populations. These technological advances support premium pricing strategies while improving patient compliance through reduced discomfort and enhanced convenience.
Smartphone-Enabled Optical Strip Readers Gain Regulatory Green-Lights
Smartphone convergence is progressing through patented optical technologies that address accuracy concerns and provide consumer-friendly analytics. FDA clearance of a home sexually transmitted infection test and AI-enhanced glucose apps confirms regulatory acceptance of mobile-linked strip readers. Digital integration enables advanced data analytics and AI-powered insights, as exemplified by Dexcom's generative AI platform that provides personalized glucose management recommendations.
Restraints Impact Analysis of Test Strip Market*
| Restraint | (~) % Impact on CAGR Forecast | Geographic Relevance | Impact Timeline |
|---|---|---|---|
| Sparse Reimbursement for OTC Strip Purchases | -0.7% | Global, most severe in emerging markets | Medium term (2-4 years) |
| Accuracy Concerns Versus Lab-Based Reference Tests | -0.4% | Global, regulatory scrutiny highest in developed markets | Short term (≤ 2 years) |
| Enzyme-Coated Substrate Supply Volatility | -0.3% | Global, supply chain concentrated in Asia | Short term (≤ 2 years) |
| CGM Uptake Cannibalising Glucose-Strip Volumes | -0.9% | Developed markets initially, expanding globally | Long term (≥ 4 years) |
| Source: Mordor Intelligence | |||
Sparse Reimbursement for OTC Strip Purchases
Coverage gaps limit retail uptake, particularly among non-insulin users who receive only 100 strips per quarter under United States Medicare guidelines.[3]Source: American Diabetes Association, “Medicare,” diabetes.org Emerging economies face heavier out-of-pocket burdens, prompting domestic innovators like Morepen Labs to push low-priced meters for India’s potential 100 million diabetic population. The reimbursement gap particularly affects continuous monitoring adoption, where CGM devices receive coverage while traditional strips face increasing restrictions, creating a bifurcated market where insured patients migrate to CGM while uninsured populations rely on cost-constrained traditional testing.
CGM Uptake Cannibalising Glucose-Strip Volumes
Germany reports daily strip use halved after intermittent CGM adoption, and FDA clearance of the first OTC CGM in 2024 broadens the substitution threat. Abbott’s Libre Rio launch targets wellness consumers, further diverting demand away from traditional strips. The cannibalization effect varies by patient segment, with insulin-dependent users showing higher CGM adoption rates while cost-sensitive populations maintain strip dependency, creating a market stratification that challenges traditional volume projections.
*Our forecasts treat driver/restraint impacts as directional, not additive. The impact forecasts reflect baseline growth, mix effects, and variable interactions.
Test Strip Market Segment Analysis
By Product:
Blood Strips Dominate Despite Urine GrowthBlood glucose test strips generated 70.92% of 2025 revenue for the test strip market, anchored by entrenched therapeutic guidelines and insurance coverage. The segment benefits from enzymatic refinements that enable 0.5 microliter samples and 7-second reads, showcased by ARKRAY’s GLUCOCARD Vital platform. Yet, urine panels are expanding at a 4.89% CAGR as healthcare providers promote early screening for urinary tract infections, kidney disease, and pregnancy. ARKRAY’s 11-parameter AUTION line illustrates the multi-analyte advantage, encouraging physicians to replace single-purpose strips with comprehensive urinalysis.
Growth momentum in urine diagnostics hinges on preventive medicine trends. Digital telehealth platforms in urban China integrate home urine strips with cloud analytics, enabling remote physician oversight and medication adherence tracking. Blood-strip makers counter by embedding Bluetooth and EHR connectivity to preserve relevance.



By Application:
Diabetes Leadership Faces UTI ChallengeDiabetes care produced 65.31% of 2025 revenue for the test strip market, yet its growth is moderating to 2.96% annually as CGM substitution accelerates in high-income markets. Conversely, urinary tract infection screening is accelerating at 4.48% CAGR, supported by primary-care protocols that favor rapid POC urinalysis to curb antibiotic misuse. Pregnancy testing maintains steady demand, aided by dual fertility functions and smartphone readers that improve result interpretation.
Clinical guidelines recommending quarterly HbA1c POC tests extend strip-based HbA1c opportunities in both urban and rural China, where cost-utility ratios fall well below local GDP per capita thresholds. The test strip industry also witnesses crossover innovation. Researchers adapted glucometers to quantify SARS-CoV-2 antibodies, proving the platform’s flexibility for future multiplex infectious disease panels.
By End User:
Homecare Dominance Reflects Patient EmpowermentHome users accounted for 49.02% of revenue in 2025 and will continue outpacing institutional channels. Simplified sample handling, automated lancet-strip combinations, and mobile dashboards give consumers real-time decision support. Medicare’s mail-order program further cements home supply continuity. POGO Automatic’s integrated cartridge system exemplifies friction-free operation, drawing adoption among tech-savvy younger cohorts.
Hospitals and clinics remain vital for complex case management and perioperative monitoring. BD’s MiniDraw fingertip device delivers venous-equivalent results, strengthening the case for strip-based assays in acute settings. Diagnostic laboratories leverage high-throughput auto-readers for chronic disease panels, yet their share erodes as payers favor decentralized care models.
By Distribution Channel:
Retail Pharmacy Strength Meets Online GrowthRetail pharmacies held 60.58% of the test strip market in 2025 due to immediate availability and pharmacist counseling. Loyalty programs and Medicare copay handling preserve foot traffic. Online pharmacies, however, are scaling 4.75% annually through subscription refills, predictive shipping algorithms, and lower overhead costs. Direct-to-consumer models provide manufacturers with margin gains and data insights that inform future device design.
Regulatory continuity assists both channels. The FDA’s Laboratory Developed Test rule creates unified quality expectations and stabilizes distribution planning through a four-year phase-in. Retailers and e-commerce operators alike align with emerging Unique Device Identifier requirements, facilitating recalls and counterfeit mitigation.
Geography Analysis
North America Test Strip Market
North America generated 37.72% of 2025 revenue for the test strip market, enabled by well-established insurance coverage and widespread chronic disease management programs. Medicare’s 300-strip quarterly limit for insulin users ensures baseline demand, and the 2024 USD 35 insulin copay cap frees consumer cash for ancillary supplies. Yet, CGM expansion moderates volume growth as Abbott and Medtronic push OTC sensors to retail shelves. Federal Laboratory Developed Test policy changes introduce predictable compliance pathways, encouraging multinational entrants to sustain investment.
APAC Test Strip Market
Asia-Pacific delivers the fastest regional CAGR at 5.12%, driven by climbing diabetes prevalence, urban dietary shifts, and expanding middle-class purchasing power. China’s integrated digital management initiatives cut average fasting glucose by 1.68 mmol/L in Tianjin pilots, underscoring demand for connected home testing. India’s domestic manufacturing scale-up from 2.5 million to 5 million glucometers annually lifts supply resilience, while lower per-capita income keeps price elasticity high. Point-of-care HbA1c screening in rural China also proves cost-effective, demonstrating the appeal of compact strip readers in resource-constrained settings.
EMEA and South America Test Strip Market
Europe sustains moderate expansion under the In Vitro Diagnostic Regulation transitional timelines to 2027-2029, which maintain device availability during recertification. Partnership-led growth emerges as A. Menarini secures exclusive Sinocare CGM rights across more than 20 jurisdictions, blending continuous and strip-based portfolios. Meanwhile, Middle East, Africa, and South America represent nascent demand pools where limited reimbursement favors low-priced strips over premium CGM hardware.

Regulatory Landscape
Test strips are regulated primarily as in vitro diagnostic (IVD) medical devices, with compliance increasingly aligned to harmonized quality and performance standards. In the United States, the FDA is progressing the phaseout of enforcement discretion for laboratory developed tests (LDTs), with Stage 2 compliance (registration, listing, and labeling) beginning May 6, 2026, adding operational requirements for entities offering strip-based assays in decentralized and near-patient settings. The FDA Quality Management System Regulation (QMSR) took effect on February 2, 2026, aligning 21 CFR Part 820 more closely with ISO 13485:2016 and reinforcing supplier controls and traceability expectations relevant to high-volume strip manufacturing.
In Europe, the In Vitro Diagnostics Regulation (EU) 2017/746 (IVDR) continues to govern market access, with transitional timelines shaping recertification and notified-body capacity planning for legacy products. Key cutoffs include the 26 May 2026 deadline to lodge conformity assessment applications for many Class C legacy devices to maintain access under transition provisions, alongside requirements for an IVDR-compliant QMS. Product-level progress under IVDR continues, illustrated by Cypress Diagnostics receiving CE approval under IVDR in March 2026 for its CYDXStrips urine analysis line; for blood glucose systems, ISO 15197:2013 remains a core performance benchmark influencing design verification and post-market surveillance expectations.
Competitive Landscape
Competition in the test strip market shows moderate fragmentation. Abbott, Roche, and LifeScan control leading channel relationships and invest in integrated ecosystems to offset CGM substitution. Abbott’s Libre data feed into Epic electronic records locks in provider loyalty, while Roche released an AI-enabled CGM predictive tool to keep engagement high. LifeScan leverages OneTouch Reveal cloud analytics to maintain relevance despite shrinking strip volumes.
Mid-tier players differentiate through multi-parameter innovation. ARKRAY pairs blood and urine lines with temperature correction features that boost accuracy across climate zones. Siemens Healthineers integrates strip autoloaders into lab informatics suites, bridging point-of-care and core-lab workflows. Regional specialists such as Sinocare scale cost-advantaged production for emerging markets, while Morepen Labs expands domestically to meet Indian demand peaks.
Supply chain strategy is an emerging competitive metric. Vienna University of Technology’s E.coli-derived horseradish peroxidase opens licensing opportunities to reduce agriculture risk. Companies securing such bioprocessing know-how gain margin and risk advantages. Strategic moves also include portfolio rationalization: Asahi Kasei divested certain diagnostics lines to concentrate on high-growth segments. Partnerships, such as Abbott–Medtronic data-sharing agreements, highlight a broader shift toward ecosystem interoperability that blurs company boundaries.
Test Strip Industry Leaders
ARKRAY, Inc.
Ascensia Diabetes Care Holdings AG
Abbott
F. Hoffmann-La Roche
LifeScan
- *Disclaimer: Major Players sorted in no particular order
Test Strip Market Companies Covered in this Report
- Abbott Laboratories
- Acon Laboratories
- Ascensia
- Arkray
- B. Braun
- Lifescan
- Roche
- Siemens Healthineers
- TaiDoc
- Trividia Health
- Nova Biomedical
- Danaher
- Medtronic
- Beckton Dickinson
- Orasure Technologies
- QuidelOrtho
- CoaguSense

Market Opportunities and Future Outlook
The most visible white-space is concentrated in non-glucose, multi-analyte, and home-based screening use cases, where strips provide low-cost decentralization without the hardware burden of many continuous systems. Urinalysis panels and infection-related point-of-care workflows benefit from ongoing regulatory formalization of near-patient testing and from digital connectivity that improves interpretation and longitudinal tracking. This broadens the addressable set beyond diabetes-only self-monitoring and supports bundling with smartphone-enabled readers and telehealth pathways.
Manufacturing and supply-chain upgrades are also creating opportunities in contract production and semi-finished materials that reduce time-to-market for diagnostic brands and help stabilize quality across high-volume runs. In February 2026, TANAKA Precious Metal Technologies established a total solutions system for contract manufacturing of in vitro diagnostics, with additional automated assembly lines and dispensing equipment planned by March 2026, reflecting momentum toward automated, scalable strip production. The FDA QMSR effective February 2, 2026, further supports multi-region operating models by converging quality expectations toward ISO 13485:2016, which can reduce friction for manufacturers distributing the same strip platforms across major markets while maintaining compliance.
Recent Industry Developments in Test Strip Market
- May 2026: Abbott secured CE Mark for its dual glucose-ketone sensing technology (Libre Duo and Libre Duo 10 Day). The move broadens the monitoring proposition beyond glucose-only use cases and increases competitive pressure on conventional glucose strip portfolios in Europe. It also reinforces a shift toward bundled sensing and digital workflows that can change how users allocate daily testing across strips and sensors.
- May 2025: Roche announced an investment of up to USD 550 million to expand its Indianapolis diagnostics manufacturing hub, a site that produces Accu-Chek test strips and has been positioned for future CGM production. The expansion strengthens supply resilience for high-volume consumables while enabling a single campus to support both strip-based products and adjacent continuous solutions. This increases the strategic value of domestic manufacturing for channel continuity and scale economics.
- November 2024: Beurer India launched the GL 22 blood glucose monitor along with companion strips. The launch expands meter-plus-strip availability in a price-sensitive market where out-of-pocket purchasing shapes channel dynamics, supporting broader access to self-monitoring. It also adds competitive intensity in retail and pharmacy-led distribution where bundled consumables sustain recurring revenue.


Test Strip Market Report Scope and Research Methodology
Market Definition and Coverage
For this methodology, the test strip market covers disposable reagent strips used with readers or visually to detect and monitor analytes, mainly across blood glucose testing and urine chemistry testing in clinical and home settings.
Scope exclusions: We exclude reusable meters and analyzers, lancets, and broader in-vitro diagnostic instruments that do not generate recurring strip revenues.
Segments Covered in This Report
- By Product
- Blood Test Strips
- Urine Test Strips
- By Application
- Diabetes
- Pregnancy Detection
- Urinary Tract Infection
- Other Applications
- By End User
- Hospitals & Clinics
- Homecare / Personal Use
- Diagnostic Laboratories
- By Distribution Channel
- Hospital Pharmacies
- Retail Pharmacies
- Online Pharmacies
- By Geography
- North America
- United States
- Canada
- Mexico
- Europe
- Germany
- United Kingdom
- France
- Italy
- Spain
- Rest of Europe
- Asia-Pacific
- China
- Japan
- India
- Australia
- South Korea
- Rest of Asia-Pacific
- Middle East and Africa
- GCC
- South Africa
- Rest of Middle East and Africa
- South America
- Brazil
- Argentina
- Rest of South America
- North America
Data Sources, Market Sizing, and Validation
Desk Research
Desk research starts with building the demand pool and setting product boundaries using public healthcare statistics and diagnostics standards. We reference sources such as the US CDC for diabetes prevalence and monitoring needs, the WHO for global disease burden signals, and the International Diabetes Federation for population level trends that help estimate strip usage intensity.
To anchor supply and pricing logic, we also review sources such as the US FDA (clearances and labeling that affect strip types), peer reviewed clinical journals on self testing adherence and testing frequency, and trade data series where applicable through an import/export shipment level database (to sanity check volumes and country mix). Company filings, investor presentations, and reputable press releases are used to understand revenue mix and channel shifts. The sources listed here are illustrative, and many other public and paid references were also used to collect data, confirm assumptions, and clarify gaps.
Primary Interviews and Surveys
Primary work is used to stress test the model assumptions that desk research cannot pin down cleanly, especially on testing frequency, channel mix, and average selling price movement by strip type. We spoke with a mix of manufacturers, distributors, diagnostic labs, pharmacists, and care providers across major regions so regional reimbursement patterns and home testing behavior were reflected in the final output.
Distribution of primary research fieldwork respondents
| Company type | Respondent position | Region |
|---|---|---|
| Top tier: 34% | CXOs: 16% | APAC: 45% |
| Mid tier: 48% | Functional/Unit leaders: 25% | EMEA: 36% |
| Smaller Players: 18% | Managers: 59% | Americas: 19% |
Market-Sizing & Forecasting
We sized the market using a top-down build that reconstructs demand from the patient pool and routine testing behavior, then converts it into annual strip consumption and spending. In practice, diabetes prevalence, treated population, average tests per patient per day, urine test utilization in clinics, and channel level price points are used to form the value totals, and the outputs are checked against supply side signals.
Selective bottom-up approximations are used as a cross-check, where sampled company revenues attributable to strips, product mix splits, and distributor channel checks help confirm whether the implied volumes and ASPs look realistic. When company disclosures are incomplete, we handle gaps by using peer set ranges validated by interviews and then adjusting for region and channel mix.
For forecasting, we used scenario analysis supported by variable level views from primary experts, since strip demand is influenced by a few moving parts that can shift at different speeds. Key forecast drivers included diabetes population growth, adoption of home testing, reimbursement stability, price erosion or premiumization by strip type, and any substitution effects from alternative monitoring approaches, applied consistently across regions before rolling up to the global totals.
Data Validation & Update Cycle
Model outputs are validated through multiple checks before sign-off, including variance testing versus implied per patient consumption, regional per capita healthcare spend direction, and company level revenue reality checks. When an output looks off, we re-check the underlying assumptions, re-run sensitivity ranges, and re-contact relevant interviewees to confirm the driver creating the swing.
The report is refreshed annually, and interim updates are made when material events occur, such as major regulatory changes, reimbursement adjustments, or noticeable pricing moves. Before delivery, a final analyst pass is completed so clients receive the latest updated view aligned to the most recent public information and interview feedback.
Mordor Intelligence's Test Strip Market Estimate Compared With Other Published Estimates
Published market sizes for test strips can differ even when studies appear to cover the same topic, because each study sets its own product inclusions, pricing logic, and timing assumptions. Differences also come from how homecare demand is treated versus institutional testing, and from how quickly pricing is assumed to change for high volume glucose strips.
The main gap comes from whether non-glucose strip categories and broader rapid test strip uses are counted inside the same total. Mordor Intelligence counts blood and urine test strips within a defined diagnostics use case and keeps pricing tied to channel mix and annual refresh checks rather than a single blended ASP.
Benchmark comparison
| Source | Market Size | Gaps in Research Methodology |
|---|---|---|
| Mordor Intelligence | USD 16.69 B (2025) | |
| Regional Consultancy A | USD 16.87 B (2025) | Often uses a wider strip definition that can include additional rapid test strip applications, and it may apply a smoother price trend across types instead of separating blood glucose and urine strip ASP behavior by channel. |
| Industry Publisher B | USD 14.20 B (2025) | Typically narrows scope toward glucose meter strips and may undercount urine chemistry strips, and the estimate can be more sensitive to assumed price erosion without anchoring to regional channel mix and validation interviews. |
The spread is mainly explained by scope choices and how prices are averaged across strip types and channels. By keeping the demand pool tied to real testing behavior and then cross-checking it with supplier and distributor signals, our estimate stays traceable to clear variables and repeatable steps.


Key Questions Answered in the Report
What is the projected value of the test strip market in 2031?
The test strip market is forecast to reach USD 20.66 billion by 2031 based on a 3.63% CAGR.
Which product segment is growing fastest?
Urine test strips are the fastest-growing segment, expanding at a 4.89% CAGR as healthcare shifts toward preventive screening.
How is CGM adoption affecting traditional strip demand?
In developed markets, CGM users cut daily strip use nearly in half, leading to a −0.9% impact on overall CAGR despite rising diabetes incidence.
Which region will contribute most to incremental growth?
Asia-Pacific will supply the largest share of new volume, with a 5.12% regional CAGR driven by rising prevalence and digital health programs.
What role do retail pharmacies play in distribution?
Retail pharmacies account for 60.58% of 2025 revenue, but online channels are growing faster at 4.75% CAGR due to subscription refill models.
Page last updated on:


 Your data is secure and never sold or shared.


