
Pharmaceutical Analytical Testing Market Size and Share
Market Overview
| Study Period | 2022 - 2031 |
|---|---|
| Market Size (2026) | USD 10.55 Billion |
| Market Size (2031) | USD 15.67 Billion |
| Growth Rate (2026 - 2031) | 8.30 % |
| Fastest Growing Market | Asia Pacific |
| Largest Market | North America |
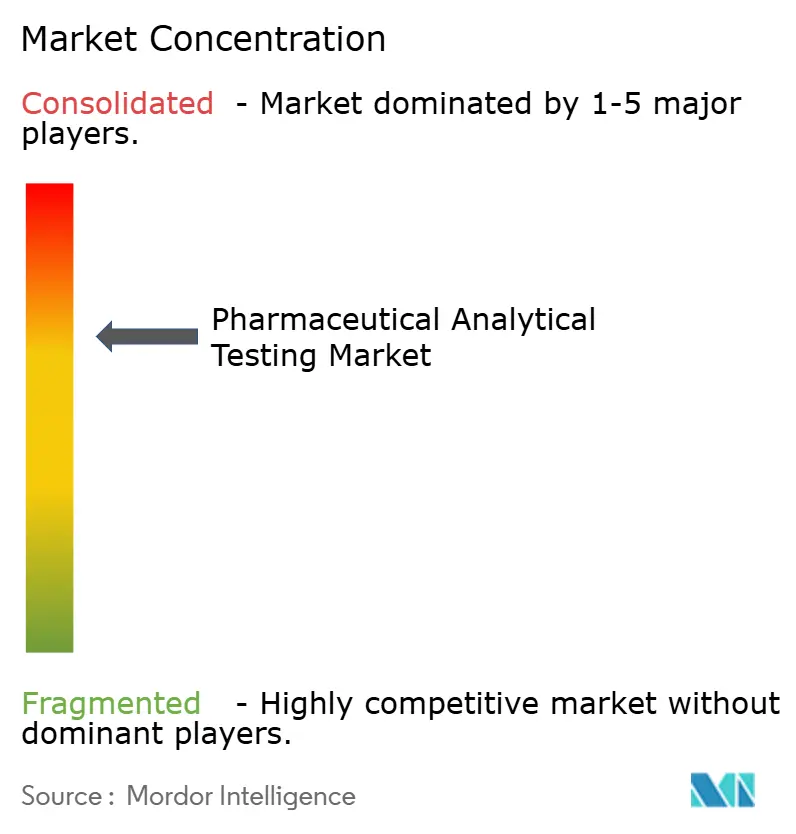
| Market Concentration | Medium |
Major Players
*Disclaimer: Major Players sorted in no particular order Image © Mordor Intelligence. Reuse requires attribution under CC BY 4.0. |
|
Pharmaceutical Analytical Testing Market Analysis by Mordor Intelligence
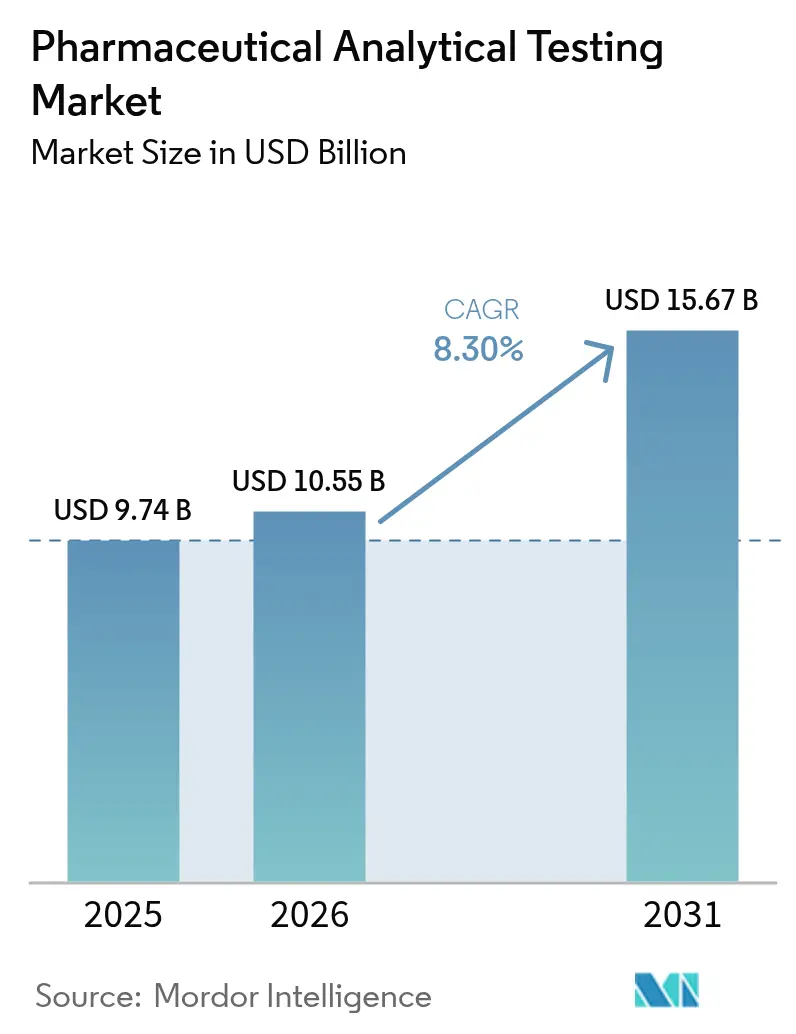
The pharmaceutical analytical testing market size in 2026 is estimated at USD 10.55 billion, growing from 2025 value of USD 9.74 billion with 2031 projections showing USD 15.67 billion, growing at 8.30% CAGR over 2026-2031. In the baseline year, demand is fueled by new FDA Q14 analytical procedure mandates, finalized Laboratory Developed Test rules, and harmonized ICH Q2(R2) validation standards, all of which elevate outsourcing volumes and reinforce the growth runway for the pharmaceutical analytical testing market[1]“Q14 Analytical Procedure Development,” U.S. Food and Drug Administration, fda.gov. Rapid biologics expansion, rising nitrosamine impurity surveillance, and real-time stability monitoring initiatives further raise the complexity bar, prompting sponsors to favor specialized contract research partnerships that can scale advanced mass-spectrometry, capillary electrophoresis, and next-generation sequencing platforms. Among the competitive maneuvers reshaping the pharmaceutical analytical testing market, leading service providers are extending geographic footprints in Asia-Pacific, automating high-throughput workflows, and acquiring niche laboratories that excel in AI-guided method development. Regional cost optimization dynamics, particularly in China and India, are sharpening price competition even while global compliance burdens intensify. As a result, the pharmaceutical analytical testing market continues to convert regulatory headwinds into predictable revenue growth, with CROs benefitting from long-term master service agreements, multi-site GMP capacity investments, and premium pricing for complex biologics characterization.
Key Report Takeaways
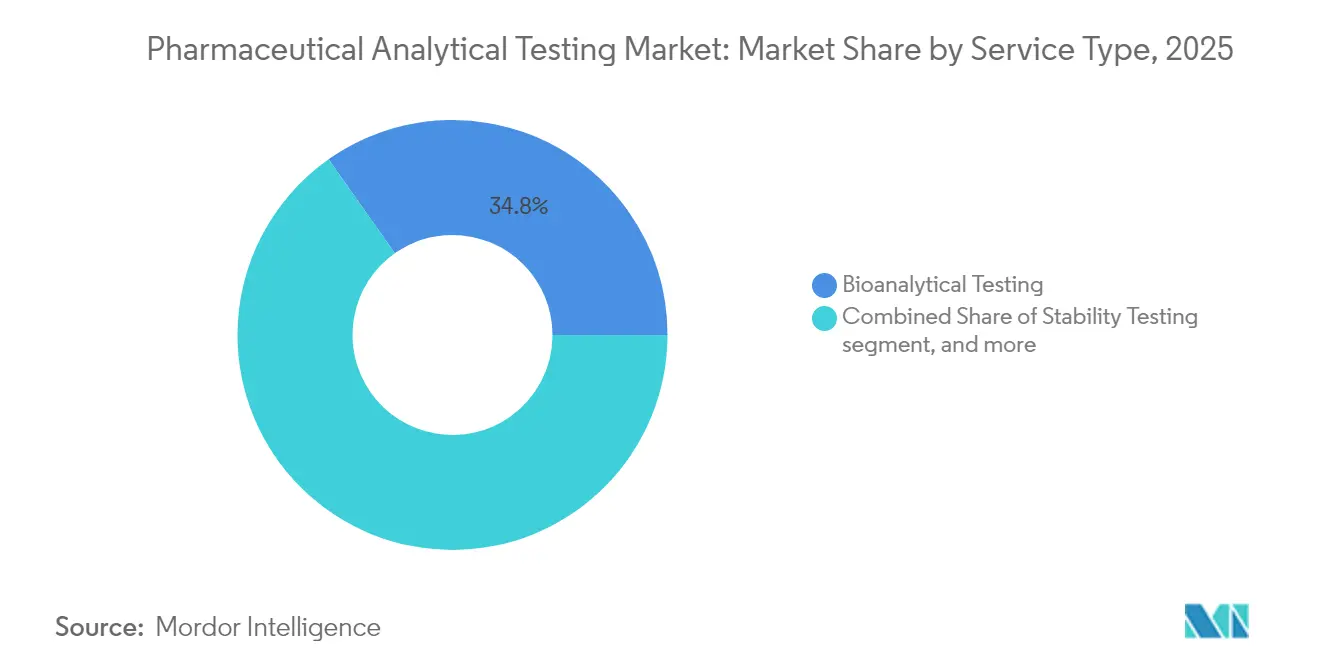
- By service type, bioanalytical testing led with a 34.78% share of the pharmaceutical analytical testing market in 2025, whereas raw material testing is forecast to expand at a 9.71% CAGR through 2031.
- By product type, APIs accounted for 45.18% share of the pharmaceutical analytical testing market size in 2025, whereas finished products testing is projected to grow at a 9.62% CAGR between 2026 and 2031.
- By end user, traditional pharmaceutical companies held 51.66% of the pharmaceutical analytical testing market size in 2025, whereas biopharmaceutical companies are expected to advance at a 10.08% CAGR through 2031.
- By geography, North America commanded 40.78% of the pharmaceutical analytical testing market share in 2025. Asia-Pacific is the fastest-growing region, posting a 9.12% CAGR to 2031.
Note: Market size and forecast figures in this report are generated using Mordor Intelligence’s proprietary estimation framework, updated with the latest available data and insights as of 2026.
Market Trends and Insights
Drivers Impact Analysis of Pharmaceutical Analytical Testing Market*
| Driver | % Impact on CAGR Forecast | Geographic Relevance | Impact Timeline |
|---|---|---|---|
| Increasing Regulatory Stringency and Compliance Requirements | +2.1% | North America, Europe | Medium term (2-4 years) |
| Rising Complexity of Drug Development and Formulations | +1.8% | Global innovation hubs | Long term (≥ 4 years) |
| Growth in Biologics and Biosimilars Development | +1.6% | North America, Europe, APAC | Long term (≥ 4 years) |
| Outsourcing Trend for Cost Optimization and Specialized Expertise | +1.4% | Global, APAC focus | Short term (≤ 2 years) |
| Technological Advancements in Analytical Techniques | +1.0% | Developed markets first | Medium term (2-4 years) |
| Rising Demand for Stability and Bioanalytical Testing | +0.5% | Global | Short term (≤ 2 years) |
| Source: Mordor Intelligence | |||
Increasing Regulatory Stringency and Compliance Requirements
Heightened supervisory rigor now governs the entire analytical lifecycle, spanning design, maintenance, and extending to product discontinuation. FDA Q14 obliges continuous verification, compelling manufacturers to validate method robustness under real-world manufacturing variability that many internal labs are not equipped to monitor. The EMA's adoption of analogous provisions creates a similar compliance ceiling across Europe, while the finalized LDT rule extends regulatory reach to in-house diagnostics, thereby broadening outsourced assay demand. In parallel, the ICH Q2(R2) framework deepens statistical scrutiny on precision, linearity, and robustness, driving a migration toward CROs with bio-informatics and chemometrics expertise[2]“ICH Q2(R2) Validation of Analytical Procedures,” International Council for Harmonisation, ich.org. Regulatory convergence,, therefore,, cements outsourced analytical testing as a permanent fixture rather than a discretionary expense.
Rising Complexity of Drug Development and Formulations
Combination products, nanocarriers, and personalized therapeutics are pushing analytical science beyond legacy chromatographic fingerprints. Cell and gene therapies require high-parameter flow cytometry, digital PCR, and viral vector potency assays that few sponsor labs have fully qualified. Antibody-drug conjugates necessitate orthogonal MS workflows to confirm drug-to-antibody ratios, while mRNA assets depend on capillary electrophoresis to demonstrate structural integrity[3]E. Dolgin, “Evolving Assays for Cell and Gene Therapy,” Nature Biotechnology, nature.com. Targeted protein degraders further complicate pharmacodynamic readouts, as standard micromolar potency curves fail to capture catalytic degradation kinetics. Given such heterogeneity, the pharmaceutical analytical testing market continues to recruit outsourcing to fill in expertise gaps and shorten method development timelines.
Growth in Biologics and Biosimilars Development
Biosimilars amplify analytical volumes because regulators demand a “totality of evidence” package encompassing hundreds of orthogonal attributes. Developers therefore commission extended peptide mapping, glycan profiling, charge variant assessments, and cell-based potency assays, often generating three to four times more data points than small-molecule submission. Bispecific and trispecific antibodies add layers of complexity, with domain-specific characterization for each binding site and forced-degradation studies to validate linker stability. These elevated requirements power sustained double-digit expansion of the pharmaceutical analytical testing market, especially in facilities that maintain GMP biology suites and qualified bioassay statisticians.
Outsourcing Trend for Cost Optimization and Specialized Expertise
While reducing fixed costs remains an incentive, the main outsourcing catalyst is access to high-end talent and instruments. Purchase, qualification, and upkeep for an orbitrap high-resolution MS platform may exceed USD 2 million in year one, discouraging all but the largest enterprise labs. CROs amortize that spend across dozens of clients, allowing small and mid-sized sponsors to access ultrahigh-resolution data without balance-sheet strain. Outsourcing further unlocks scheduling agility because integrated laboratories operate 24/7 shift models, compressing development cycles. As a result, global service contracts increasingly bundle method development, validation, routine release, and stability pulls into multi-year scopes, embedding CROs deep within sponsor supply networks.
Restraints Impact Analysis of Pharmaceutical Analytical Testing Market*
| Restraint | (~) % Impact on CAGR Forecast | Geographic Relevance | Impact Timeline |
|---|---|---|---|
| Data Security and Intellectual Property Concerns | −1.2% | Global, notably in competitive therapeutic areas | Short term (≤ 2 years) |
| High Costs of Advanced Analytical Equipment and Expertise | −0.8% | Emerging markets primarily, developed-market segments | Medium term (2-4 years) |
| Shortage of Skilled Analytical Professionals | −1.0% | Global | Medium term (2-4 years) |
| Complex Method Transfer and Validation Requirements | −0.6% | Global | Short term (≤ 2 years) |
| Source: Mordor Intelligence | |||
Data Security and Intellectual Property Concerns
Fierce therapeutic rivalry raises the perceived risk of data leakage when proprietary chromatograms, degradation pathways, or bioassay algorithms leave a sponsor’s firewall. Recent cyber intrusions at life-science vendors have underscored vulnerabilities, prompting some companies to retain ultra-sensitive assays in house and slow outsourcing uptake in high-value oncology and rare-disease programs. Compliance with FDA 21 CFR Part 11 and EU Annex 11 electronic record controls adds further contractual complexity, demanding CRO investments in segregated data centers, multi-factor authentication, and immutable audit trails. Though mitigatable, these risks moderately temper the pharmaceutical analytical testing market expansion curve.
High Costs of Advanced Analytical Equipment and Expertise
Cutting-edge tools such as fourier transform ion cyclotron resonance (FT-ICR) MS and cryo-electron microscopy carry price tags above USD 500,000 per instrument, with annual maintenance often topping 18% of purchase value. The supply of analysts adept at macromolecular mass-mapping or advanced chromatography remains tight, inflating wages and compressing margins, especially for regional firms in developing economies. Capital scarcity thus limits facility upgrades in price-sensitive geographies, nudging multinational sponsors toward more expensive global hubs, which slightly dampens overall adoption in emerging clusters.
*Our forecasts treat driver/restraint impacts as directional, not additive. The impact forecasts reflect baseline growth, mix effects, and variable interactions.
Pharmaceutical Analytical Testing Market Segment Analysis
By Service Type:
Bioanalytical Testing Leads Specialized GrowthBioanalytical workflows captured 34.78% of overall revenue in 2025, underscoring their indispensability to exposure-response modeling and companion diagnostic codevelopment. In regulatory submissions, the pharmaceutical analytical testing market size for bioanalytical assays is projected to widen further as adaptive trial designs demand interim PK/PD data reviews at granular patient-cohort levels. Sponsors also commission large-scale immunogenicity panels to contextualize biologic safety signals, extending sample queue lengths across phase II and III timelines. Concurrently, raw-material testing is registering a 9.71% CAGR—the fastest of any service—reflecting new supplier-verification clauses and global incidents involving excipient contamination. GMP-qualified laboratories now perform nitrosamine screening, identity confirmation, and USP <232> elemental impurity quantitation on every incoming lot, a requirement propelling sustained double-digit growth. From an operational standpoint, the pharmaceutical analytical testing market deploys high-throughput ICP-MS, automated FTIR dispensers, and barcode-driven chain-of-custody systems to satisfy rising demand without diluting turnaround commitments.
Method development and validation continues as a core offering, representing consistent mid-single-digit growth, because every new modality—from lipid nanoparticles to bifunctional degraders—requires novel chromatographic and bioassay protocols. Stability testing, especially for parallel global registrations, remains a reliable annuity segment because real-time and accelerated conditions run for multiple years. Extractables and leachables studies are likewise becoming mandatory for complex injectables and implantables, generating additional mid-term momentum. Collectively, these vectors ensure that the pharmaceutical analytical testing market remains indispensable across product-lifecycle checkpoints, with bioanalytical testing anchoring immediate revenue and raw-material verification setting the sprint pace through 2031.



By Product Type:
APIs Drive Current DemandActive Pharmaceutical Ingredients retain a commanding 45.18% revenue share, underscoring their analytical intensity. The pharmaceutical analytical testing market size allocated to API characterization is fueled by impurity profiling thresholds that now dip below 0.05%, compelling sponsors to adopt ultrahigh-resolution MS, comprehensive two-dimensional GC, and nuclear magnetic resonance hyphenations. Complex synthetic routes for chiral intermediates and targeted protein degraders require multi-dimensional resolution of stereochemistry and diastereomer ratios, further entrenching CRO involvement. As regulatory authorities scrutinize nitrosamine risks, API lots must undergo exhaustive risk evaluation and confirmatory testing, increasing laboratory utilization.
Finished products testing, advancing at a 9.62% CAGR, is redefining growth momentum. Extended-release, transdermal, and inhalable dosage forms necessitate dissolution profiling, aerodynamic particle-size distribution, and device-product interaction studies that command premium fees. Combination drug–device platforms, such as smart injectors and implantable pumps, add another validation layer, as analytical verification must encompass both pharmaceutical and engineering tolerances. Consequently, CROs that can integrate product performance testing with traditional chemistry analyses secure a competitive edge. The pharmaceutical analytical testing market share for finished product workflows is therefore expected to close the gap with API testing by 2031.

By End User:
Biopharmaceuticals Accelerate AdoptionTraditional pharmaceutical companies remain the largest client block, securing 51.66% of 2025 revenue as they externalize non-core analytics to control capital outlays and focus on candidate discovery. While their overall spend rises in line with pipeline breadth, biopharmaceutical sponsors represent the fastest growth lane, posting a 10.08% CAGR. This subset includes cell-therapy pioneers, viral-vector developers, and mRNA platform companies whose analytical demands extend beyond standard potency and purity assays to encompass genomic integrity, replication-competent virus testing, and process-related impurity removal. These operators rely heavily on CROs that house biosafety cabinets, GMP cell culture suites, and advanced flow cytometers capable of 30-color panels.
Academic and research organizations, though smaller in absolute dollars, inject early-stage diversity into the project mix, particularly for first-in-class modalities. Contract development and manufacturing organizations (CDMOs) also channel rising testing volumes through integrated service offerings, creating multi-tenant utilization for analytical laboratories embedded within manufacturing campuses. As technology converges, the pharmaceutical analytical testing market continues to serve an expanding client tapestry, each segment reinforcing overall volume and revenue predictability.
Geography Analysis
North America Pharmaceutical Analytical Testing Market
North America remains the epicenter, accounting for 40.78% of 2025 revenue. The U.S. regulatory environment, spearheaded by the FDA’s Q14 deployment, cements the region’s leadership in method lifecycle management, compelling local CROs to scale scientific talent pools and digital validation platforms. Canada supports growth through incentives for biologics manufacturing, while niche laboratories in Mexico absorb cost-sensitive routine assays and container-closure evaluations. Collectively, these dynamics maintain North America’s dominant contribution to the pharmaceutical analytical testing market, even as pricing competition intensifies.
Europe Pharmaceutical Analytical Testing Market
Europe anchors its stature through EMA-aligned guidance and sustained biosimilar activity. Germany, France, and the United Kingdom drive demand for orthogonal biologic characterizations, while Scandinavia supplies innovation in real-time release methodologies. Post-Brexit, U.K. CROs have repositioned to provide dual-release testing under both MHRA and EMA oversight, creating cross-border analytical demand corridors. Central and Eastern European nations offer capacity relief for stability chambers and routine batch-release assays, encapsulating Europe’s balanced mix of premium and cost-optimized services in the pharmaceutical analytical testing market.
APAC Pharmaceutical Analytical Testing Market
Asia-Pacific posts the steepest ascent, registering a 9.12% CAGR and progressively expanding its pharmaceutical analytical testing market size as multinational sponsors localize manufacturing and late-phase development in the region. China’s 14th Five-Year Plan earmarks funding for GMP laboratory infrastructure, while India capitalizes on deep organic chemistry expertise and English-speaking technical workforces. Singapore’s biotech incentives attract regional headquarters for advanced biologics characterization, and South Korea drives innovation through government-subsidized cell-therapy test beds. Harmonization with ICH guidelines across ASEAN members streamlines cross-border submissions, further lifting analytical demand. As capacity matures, Asia-Pacific’s share of the pharmaceutical analytical testing market is expected to approach North America’s by the early 2030s.


Regulatory Landscape
Analytical testing requirements are tightening around lifecycle-based expectations and harmonization. ICH Q14 (Analytical Procedure Development) and ICH Q2(R2) (Validation of Analytical Procedures) reached Step 5 implementation via the EMA in June 2024, reinforcing risk-based method development, validation, and ongoing verification across global submissions and increasing compliance demands on sponsor and contractor laboratories.
In 2026, chemistry and pharmacopeial updates added further compliance triggers for impurity controls and method suitability. The EMA adopted a revised Guideline on the chemistry of active substances on February 16, 2026 (effective September 1, 2026), expanding detail on starting materials, re-processing, recovery, and impurity control, including nitrosamines. In parallel, USP continued to advance standards and general chapters affecting analytical labs, including issuing a prospectus for 1068 Excipient Composition and Organic Impurities in July 2026 and publishing Chemical Information updates in May 2026 with staged official dates, increasing the need for monitoring of USP-NF online revisions and effective-date changes.
Value Chain Analysis
The value chain runs from sponsor companies (pharma and biopharma) and CDMOs that define analytical control strategies, to method development and qualification/validation activities performed in-house or outsourced to CROs and independent GMP laboratories. Service providers then depend on instrument and consumables ecosystems (LC/GC and high-resolution MS platforms, capillary electrophoresis, NMR, qualified reference standards, and data systems compliant with 21 CFR Part 11 and EU Annex 11), before executing routine release, stability, and investigational bioanalysis that feed regulatory submissions and post-approval change control under ICH-aligned expectations (Q14 and Q2(R2)).
The main constraints cluster around capital-intensive instrumentation, specialist talent, and method transfer and validation complexity, with additional friction from country-by-country review for post-approval changes. The chain is also being shortened through integration and regionalization: AGC Biologics partnered with Pyramid Pharma Services in June 2026 to link drug substance operations with sterile fill-finish in the United States, reducing handoffs that often drive analytical comparability work. Capacity is moving closer to end markets as well, with Merck opening a EUR 25 million BioReliance testing facility in Darmstadt, Germany in July 2026 to support release testing and stability studies, which can reduce lead times and improve scheduling resilience for European supply.
Competitive Landscape
Moderate fragmentation persists, with the top five vendors controlling slightly above 35% of global revenue. Eurofins Scientific and Charles River Laboratories steer the pack, leveraging broad geographic coverage and vertically integrated service arrays that span method development to post-approval surveillance. Continuous acquisition strategies remain the primary consolidation lever, highlighted by Charles River’s recent addition of cell-therapy analytical specialist Cellero and Eurofins’ USD 150 million North American expansion into gene-vector analytics. These moves broaden assay portfolios and raise the competitive bar for smaller regional firms.
Technology differentiation is also reshaping the pharmaceutical analytical testing market. Leading CROs invest in AI-assisted chromatographic modeling, automated headspace-GCMS for volatile impurities, and IoT-enabled stability chambers capable of remote data interrogation. Real-time release testing aligns with the industry’s pivot toward continuous manufacturing, where in-line analytics replace traditional end-product QC. Emerging players carve niches around single-use bioreactor monitoring, nanoparticle tracking analysis, or digitalized chain-of-custody interfaces, offering bespoke value propositions to sponsors with specialized demands.
Barriers to entry rest on capital intensity, regulatory track record, and the depth of scientific talent. Qualified person (QP) coverage for European batch release, FDA Form 483 history, and ISO 17025 accreditation influence vendor selection matrices. Consequently, mid-tier CROs often partner or merge to gain scale, diversify client rosters, and share compliance overhead. Over the forecast period, market concentration is expected to inch upward as strategic acquisitions persist, yet niche innovators will continue to emerge, sustaining competitive tension within the pharmaceutical analytical testing market.
Pharmaceutical Analytical Testing Industry Leaders
-
Intertek Pharmaceutical Services
-
Pace Analytical Services
-
SGS SA
-
Boston Analytical
-
STERIS
- *Disclaimer: Major Players sorted in no particular order
Pharmaceutical Analytical Testing Market Companies Covered in this Report
- Almac Group
- Boston Analytical
- Cambrex
- Catalent
- Charles River
- Element Materials Technology (Exova)
- Eurofins
- Frontage Laboratories
- ICON
- Intertek Group
- LabCorp
- MedPace
- Merck
- Pace Analytical Services
- PPD (Thermo Fisher Scientific)
- SGS
- Syneos Health
- STERIS
- Toxikon, Inc.
- West Pharmaceutical Services
- WuXi App Tec
Read Analysis of Pharmaceutical Analytical Testing Companies

Market Opportunities and Future Outlook
Lifecycle-based analytical expectations under ICH Q14 and ICH Q2(R2) (effective June 14, 2024) drive a practical need for laboratories to expand continuous verification capabilities, strengthen method robustness packages, and modernize instrument and system qualification and data integrity controls. This shift creates space for service providers that can combine analytical procedure development, statistical and chemometrics support, and compliant digital workflows to manage established conditions, change control, and comparability with fewer sponsor-side handoffs.
Capacity additions and modality-focused investments point to where demand is concentrating. In July 2026, Merck opened a 2,000 square meter, EUR 25 million BioReliance testing facility in Darmstadt, Germany for release and stability testing of biopharmaceuticals, indicating a stronger emphasis on regional GMP testing throughput for biologics. In the United States, sponsors and CDMOs are also adding infrastructure tied to complex products and QC needs, including Ritedose Corporation’s USD 17 million cGMP lab investment announced in September 2025 and Alcami Corporation commencing a 20,000 square foot laboratory expansion in Durham, North Carolina in October 2025 for biologics testing. At the same time, differentiated services are emerging around regulated use of advanced analytics and automation, but these approaches still require clear validation and governance aligned with regulator expectations, keeping premium value with providers that can operationalize compliant digital and advanced-analytics toolchains.
Recent Industry Developments in Pharmaceutical Analytical Testing Market
- June 2026: SGS acquired CMIC, INC., a Chicago-based bioanalytical testing provider, expanding its North American capacity and capabilities. The transaction strengthens SGS coverage across complex bioanalytical workflows used in modern drug development, supporting sponsors that want fewer vendor handoffs for regulated testing programs.
- December 2025: Intertek acquired a 29,000 square foot facility in Melbourn, UK to expand manufacturing and laboratory space supporting inhaled and nasal drug development. The added footprint increases capacity for specialized analytical and development work tied to complex delivery systems where performance testing and regulatory documentation are tightly linked.
- January 2024: Kindeva Drug Delivery launched a new global business unit providing integrated and stand-alone analytical support for pharmaceutical, biopharmaceutical, and medical device companies. The move positioned Kindeva to bundle analytical services more directly with product development and manufacturing programs, aligning testing capacity with delivery-system complexity.


Pharmaceutical Analytical Testing Market Report Scope and Research Methodology
Market Definition and Coverage
This market covers paid analytical testing services used to confirm the identity, strength, purity, and stability of pharmaceutical and biopharmaceutical drugs across development and manufacturing, so quality and regulatory requirements can be met.
Scope exclusions: We exclude routine hospital or clinical diagnostic lab testing that is not tied to pharmaceutical product development, release, or stability work.
Segments Covered in This Report
-
By Service Type
- Bioanalytical Testing
- Method Development & Validation
- Stability Testing
- Raw Material Testing
- Other Service Types
-
By Product Type
- Raw Materials
- Active Pharmaceutical Ingredients (APIs)
- Finished Products
-
By End User
- Pharmaceutical Companies
- Biopharmaceutical Companies
- CROs and CMOs
- Academic & Research Institutions
-
Geography
-
North America
- United States
- Canada
- Mexico
-
Europe
- Germany
- United Kingdom
- France
- Italy
- Spain
- Rest of Europe
-
Asia-Pacific
- China
- Japan
- India
- Australia
- South Korea
- Rest of Asia-Pacific
-
Middle East & Africa
- GCC
- South Africa
- Rest of Middle East & Africa
-
South America
- Brazil
- Argentina
- Rest of South America
-
North America
Data Sources, Market Sizing, and Validation
Desk Research
Desk research starts with public rules and reference standards that shape testing needs, because demand in this market is tightly linked to compliance. We reviewed sources such as US FDA guidance and updates, EMA publications, and ICH guidelines, then mapped these to pharmacopeia standards such as USP and EP to understand what testing is required and when.
To anchor activity levels, we also checked government and public datasets and science sources such as NIH and PubMed for modality shifts, clinical trial registries for development intensity, and reputable association or regulator websites for quality-system expectations. Company annual reports, investor presentations, and press coverage were then used to map service mix signals, for example stability programs and method validation work, and to capture capacity expansion commentary. Where it helped validate scale and peer sets, we referenced paid subscriptions for company financials and intelligence, patent databases, and an import and export shipment-level database for select lab instruments and consumables. The desk research source list is illustrative, and we checked many other public documents and datasets to clarify, validate, and cross-check inputs.
Primary Interviews and Surveys
Primary work centered on interviews and structured surveys with service providers, lab operations leaders, quality and regulatory roles, and procurement teams that influence testing budgets. We used these conversations to confirm what drives outsourcing versus in-house choices, how pricing is negotiated for common test packages, and which service lines are scaling faster across APAC, EMEA, and the Americas.
Distribution of primary research fieldwork respondents
| Company type | Respondent position | Region |
|---|---|---|
| Top tier: 33% | CXOs: 12% | APAC: 52% |
| Mid tier: 51% | Functional/Unit leaders: 29% | EMEA: 30% |
| Smaller Players: 16% | Managers: 59% | Americas: 18% |
Market-Sizing & Forecasting
The core sizing model uses a top-down demand pool build that connects pharmaceutical development and manufacturing activity to the required testing load, which is then converted into spending using service-mix pricing. When the demand signal is clearer from operations than from budgets, the logic starts with expected testing programs and timelines, and then we reconstruct revenue from typical frequency and pricing.
Key inputs include the share of work that is outsourced, the mix across bioanalytical testing, stability testing, method development and validation, and drug substances testing, plus average price progression for repeat programs such as stability and release support. We also track practical indicators such as clinical trial intensity by therapeutic area, biologics pipeline complexity, regulatory quality expectations, and lab capacity utilization cues that came up in primary discussions. To keep totals grounded, we run selective bottom-up checks using sampled ASP times volume for common test bundles and a limited roll-up from provider revenue disclosures where available, with gaps handled using peer benchmarks when a service line is not disclosed cleanly.
For forecasting, we use scenario analysis supported by a light multivariate regression where inputs have dependable time series, such as development intensity, outsourcing propensity, and pricing movement for routine panels. Assumptions are adjusted only after experts confirm direction and pace of change, especially for newer modalities where historical pricing is less uniform.
Data Validation & Update Cycle
Before finalizing, we run checks so outputs stay realistic. Model results are compared with independent signals such as disclosed service revenue ranges, lab expansion announcements, and demand indicators tied to development and manufacturing cycles, and then we investigate any large variances.
Anomalies, such as sudden price jumps or unusually high outsourcing shares in a region, are reviewed by a second analyst and re-tested with alternate assumptions. When a mismatch cannot be explained with documents, respondents are re-contacted to confirm whether it is temporary or a structural change. The report is refreshed annually, and interim updates are made when material events shift pricing, currency conversion timing, or regulatory-driven demand. Right before delivery, a final pass is completed so the latest public developments are reflected.
Mordor Intelligence's Pharmaceutical Analytical Testing Market Estimate Compared With Other Published Estimates
Published market sizes for pharmaceutical analytical testing often differ because the service boundary is not identical across studies, and because pricing and currency handling choices can move totals even when volumes look similar. We also see differences when authors rely on a single demand proxy, or when the estimate is not refreshed after large shifts in outsourcing behavior and lab input costs.
In practice, the biggest gaps usually come from whether in-house testing is counted alongside outsourced services, how broadly bioanalytical work is defined, and whether adjacent quality services are added into the same bucket. Timing matters too, since average selling prices for repeat programs are renegotiated through the year and currency conversion can be applied at different points. A slower refresh cycle can miss those changes that showed up in primary checks and public filings, which is why the update cadence and FX timing used in Mordor Intelligence can shift the reported value versus estimates built on older price points.
Benchmark comparison
| Source | Market Size | Gaps in Research Methodology |
|---|---|---|
| Mordor Intelligence | USD 10.55 B (2026) | |
| Industry Research Publisher A | USD 8.99 B (2024) | Uses an earlier base year and a broader definition that blends multiple applications and end-users, and it can understate later-period pricing resets and currency timing effects that lift service revenue in subsequent years. |
| Market Data Publisher B | USD 8.70 B (2024) | Tracks outsourcing-focused revenue with a narrower geography set and different inclusions within service types, which can compress totals versus studies that also model a fuller test mix and validate ASP progression through interviews. |
The spread in values is mostly explained by year alignment, what is included as analytical testing, and how pricing and FX are treated as they move through the period. By keeping the scope tight to pharmaceutical analytical testing services and by re-checking price logic and assumptions during updates, the final number stays traceable to clear demand drivers and repeatable calculation steps that can be reviewed and re-run.


Key Questions Answered in the Report
How big is the pharmaceutical analytical testing market in 2026?
The pharmaceutical analytical testing market size is USD 10.55 billion in 2026, expanding toward USD 15.67 billion by 2031.
What is the expected growth rate for analytical testing services?
The market records an 8.30% CAGR from 2026 to 2031, driven by stricter regulations and biologics pipeline complexity.
Which service type holds the largest revenue share?
Bioanalytical testing leads with 34.78% market share in 2025 due to its central role in precision-medicine trials.
Which region is growing the fastest for outsourced analytical testing?
Asia-Pacific is the fastest-growing region, rising at a 9.12% CAGR through 2031 as global sponsors expand manufacturing there.
Why are pharmaceutical companies outsourcing analytical testing?
Outsourcing provides access to advanced instruments, specialized scientific talent, and global GMP capacity without heavy capital expenditure.
What challenges limit further market growth?
Data-security concerns and the high cost of next-generation instruments slightly restrain adoption, especially for sensitive pipelines and emerging-market providers.
Page last updated on:


 Your data is secure and never sold or shared.


