
Lab Titration Market Size and Share
Market Overview
| Study Period | 2020 - 2031 |
|---|---|
| Market Size (2026) | USD 2.07 Billion |
| Market Size (2031) | USD 2.79 Billion |
| Growth Rate (2026 - 2031) | 6.18 % |
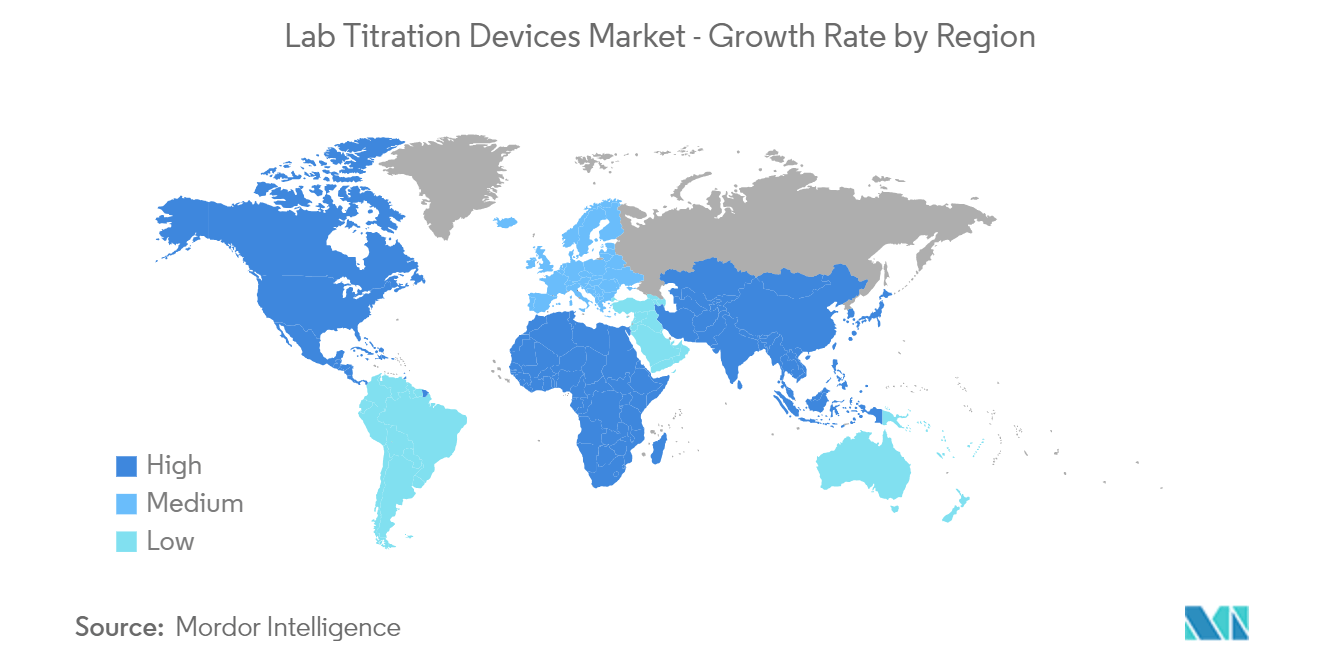
| Fastest Growing Market | Asia-Pacific |
| Largest Market | North America |
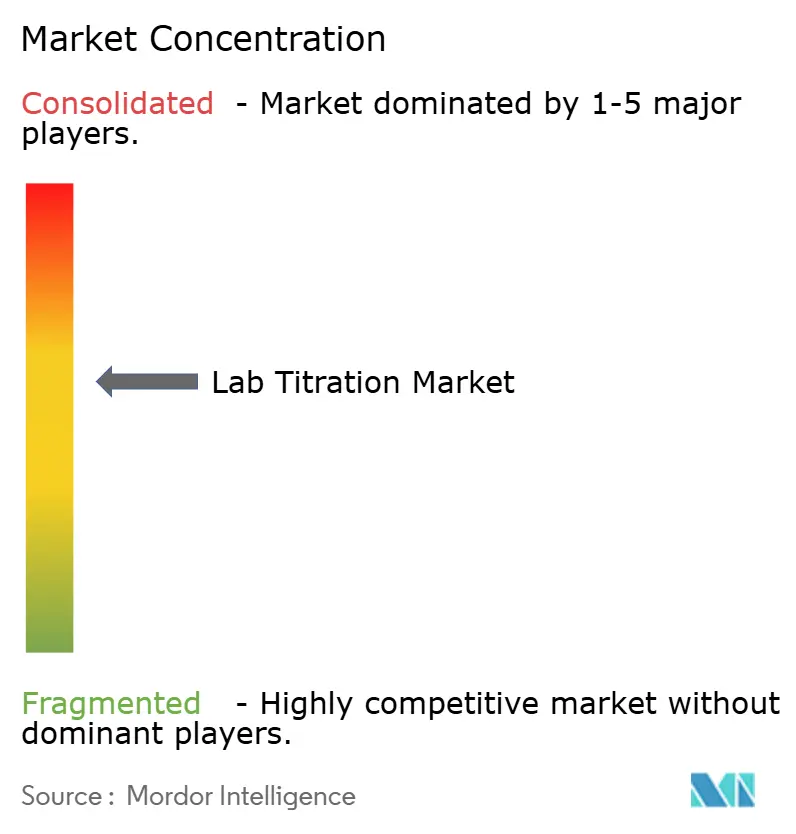
| Market Concentration | Medium |
Major Players *Disclaimer: Major Players sorted in no particular order Image © Mordor Intelligence. Reuse requires attribution under CC BY 4.0. | |
Lab Titration Market Analysis by Mordor Intelligence
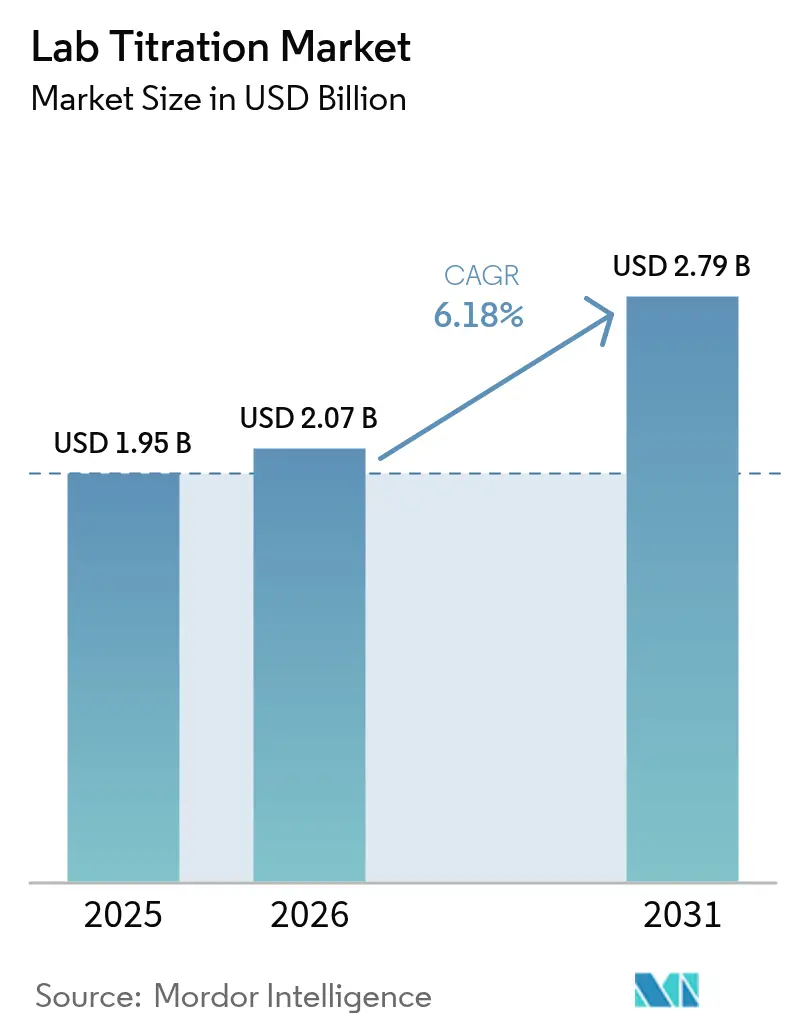
Lab Titration market size in 2026 is estimated at USD 2.07 billion, growing from 2025 value of USD 1.95 billion with 2031 projections showing USD 2.79 billion, growing at 6.18% CAGR over 2026-2031.
The market is driven by an increase in demand for automated lab titration devices and a rise in the applications of titration systems in chemical laboratories, research, and the pharmaceutical industry. The market is expected to witness significant growth over the forecast period.
The expansion of research and development activities across various industries, including pharmaceuticals, chemicals, and environmental sciences, drives demand for precise and efficient titration devices. Researchers and scientists require accurate measurement tools for their experiments and quality control processes.
Moreover, the growing application of lab titration in chemical laboratories, research, and pharmaceuticals is expected to increase its demand, thereby boosting market growth. For instance, according to an article published in PASCO in June 2023, titration is a widely used method for quantifying the concentration of various chemical components in water, soil, and air samples. Acid-base titrations, for instance, measure the alkalinity and acidity of water, aiding in the identification of pollutants such as acid rain and industrial discharges.
Further, in pharmaceuticals, titration is necessary to check for the correct concentration of ingredients to ensure the quality of products like pharmaceuticals, soap, and even biodiesel fuel. In quality control, titration provides a method of removing impurities from a sample by selectively reacting with the impurities. Thus, significant application of lab titration in various fields is expected to contribute to the market growth over the forecast period.
As research and development activities expand and the number of research laboratories grows, the demand for lab titration systems is set to surge, driving market growth. For instance, data from Higher Education Research and Development, published in May 2023, reveals that United States higher education institutions invested nearly USD 12.8 billion in new research facilities in 2022 and 2023. Such investments are anticipated to boost the demand for laboratory equipment such as titration systems in laboratories, subsequently heightening the demand for titration devices, essential for drug formulation.
Consequently, factors such as the increasing application of lab titration and intensified research and development activities are anticipated to drive market growth in the forecast period. Conversely, a shortage of skilled personnel may impede this growth.
Note: Market size and forecast figures in this report are generated using Mordor Intelligence’s proprietary estimation framework, updated with the latest available data and insights as of 2026.
Global Lab Titration Market Trends and Insights
The Automated Segment is Expected to Register a Healthy Growth During The Forecast Period
The automated titration segment is expected to register healthy growth during the forecast period. This is mainly due to the rising demand for an automated lab titration process, which favors the desired functionality with minimal human error. In addition, the rising healthcare spending worldwide is expected to boost research and development utilizing advanced laboratory devices for drug development, which is further expected to augment the segment growth.
The automated lab titration offers several benefits and is expected to contribute to the segment growth over the forecast period. Automated titration systems offer higher accuracy and precision compared to manual methods. This is crucial in analytical laboratories where precise measurements are essential for ensuring reliable results in various industries such as pharmaceuticals, food and beverage, environmental monitoring, and chemical analysis. Additionally, automation reduces the time required for titration processes. This efficiency allows laboratories to handle higher throughput without compromising on quality, thereby improving overall productivity and reducing operational costs. Thus, significant benefits associated with automated lab titration are expected to contribute to the segment growth over the forecast period.
In January 2024, Gayle Gleichauf, Applications Laboratory Manager at Thermo Fisher Scientific, underscored the advantages of automated titration systems in laboratories, particularly their enhanced efficiency and accuracy. By employing sensors for precise endpoint detection, automated titration minimizes human error, resulting in consistently reliable outcomes.
The introduction of fully automated systems that handle sample preparation, titration, and result evaluation, significantly improving efficiency and safety in laboratories by reducing human error and chemical exposure. For example, the Karl Fischer titration, a well-established method for gauging moisture levels in diverse materials, was crucial for upholding the quality and safety of pharmaceutical products. Choosing the appropriate Karl Fischer Titrator for pharmaceutical laboratory could profoundly influence research, development, and quality control endeavors. Labindia's Titra+ and Karl Fischer titrators feature advanced automation, compliance with regulatory standards, and improved user interfaces, enhancing accuracy and usability.
Thus, the segment is anticipated to witness significant growth over the forecast period owing to factors such as the advantages of automated titration devices over conventional titration devices and technological advancements by market players.


North America is Expected to Hold a Significant Share in the Market and is expected to do the Same in the Forecast Period.
Technological innovations in lab titration devices are set to bolster the North American region's market share. This growth is further fueled by heightened research and development activities in the region's pharmaceutical sector.
The surge in lab titration device adoption is linked to increased investments in pioneering research and the evolution of structure-based drugs. For example, in 2023, PhRMA members in the United States pharmaceutical sector allocated approximately USD 96 billion to research and development. This substantial investment from government bodies, universities, and private entities underscores the emphasis on scientific research. Such funding not only advances research but also facilitates the procurement of cutting-edge laboratory tools, including titration devices, essential for experiments and analyses.
Industries like pharmaceuticals and food safety face stringent regulatory frameworks, compelling laboratories to maintain high testing standards. Titration plays a pivotal role in ensuring products adhere to safety and quality standards, prompting labs to invest in dependable titration tools. In the United States, entities such as the United States Pharmacopeia (USP) and the International Council for Harmonisation (ICH) oversee lab titration regulations. Following ICH Guidance Q2(R1) is vital for validating analytical methods. Achieving accurate results hinges on standardizing titrants, which demands high-purity primary standards linked to reference materials. Moreover, titration techniques must adhere to established guidelines to evaluate specificity, accuracy, and linearity, ensuring their reliability in pharmaceutical contexts. Such regulations are paramount for upholding quality and safety in pharmaceutical research and testing.
With the pharmaceutical industry's heightened emphasis on drug formulation, quality assurance, and stability assessments, the demand for precise titration methods is surging. As the market sees an influx of new drugs, the reliance on accurate analytical methods, particularly titration, intensifies. For instance, a February 2024 article in Molecules highlighted that the United States FDA approved 55 new drugs, consistent with the five-year average of 53 approvals in 2023. Given this dynamic growth landscape, the titration device market is poised for continued innovation and demand.
Therefore, factors such as government funding for research and development, and stringent regulatory guidelines are projected to bolster the market growth in the region during the forecast period.

Competitive Landscape
The lab titration market is semi-consolidated and consists of several major players. In terms of market share, a few major players dominate the market. Some companies currently dominating the market are ThermoFisher Scientific, Metrohm AG, Xylem Analytic Germany, ECH Scientific, Hanna Instruments, Diagger Scientific Inc., COSA Xentaur, CSC Scientific Company, Hiranuma Sangyo Co., Ltd, and DKK-TOA Corporation.
Lab Titration Industry Leaders
Xylem
ThermoFisher Scientific
Metrohm AG
ECH Scientific
HIRANUMA Co., Ltd
- *Disclaimer: Major Players sorted in no particular order

Market Opportunities and Future Outlook
Automation and data integrity requirements in regulated labs create demand for instrument-based titration workflows that can support audit trails and electronic records. Industry publications and manufacturer guidance increasingly frame automated titration as a way to reduce analyst-to-analyst variability and improve consistency in endpoint determination, while newer systems also add compliance-focused capabilities such as FDA 21 CFR Part 11 and EudraLex Volume 4 Annex 11-aligned features, along with LIMS connectivity. This has supported ongoing upgrades from manual burettes toward connected workstations.
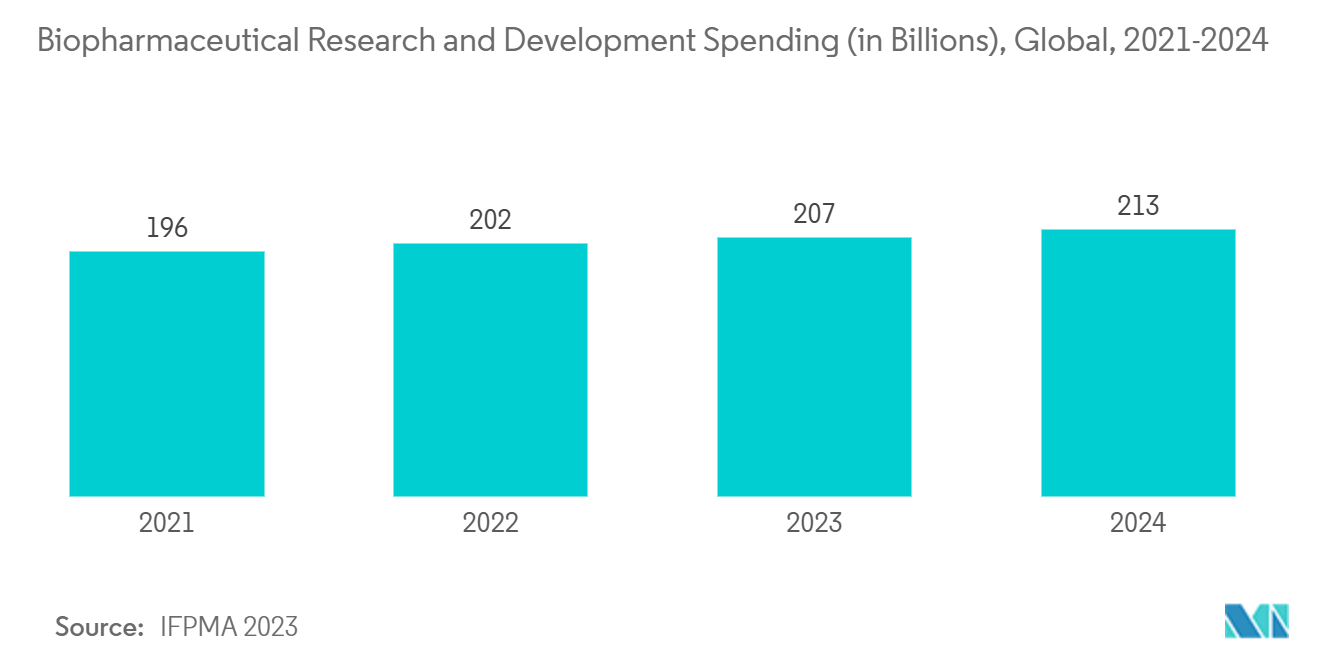
Platform consolidation and modularity also support incremental adoption across pharmaceutical QC, environmental testing, and industrial labs that run multiple wet-chemistry methods. Metrohm points to modular titration ecosystems (for example, OMNIS), and in January 2026, it introduced a 2026 Titrolyzer process analyzer concept aimed at extending titration into industrial and process monitoring, supplementing lab benchtop demand. Broader spending trends reinforce this installed-base dynamic, including the increase in biopharmaceutical R&D spend (2021-2024) and higher education research facility investment during 2022-2023 in the United States, which increases the number of laboratories positioned to standardize on automated titration and expand with additional sensors and peripherals over time.
Recent Industry Developments
- April 2026: KPM Analytics and Metrohm UK entered a distribution partnership in the United Kingdom covering KPM Analytics wet chemistry solutions, including SmartChem and NexaFlo analyzers. Metrohm UK took responsibility for sales and after-sales service, strengthening local application support and service capacity for automated wet-chemistry workflows that include titration.
- March 2026: Metrohm Central Africa (Metrohm AG) signed a distribution and servicing contract with Sartorius covering laboratory balances, pipettes, and filtration equipment in Central Africa. The agreement broadened Metrohm Central Africa's service portfolio and reinforced its field-support footprint for laboratories that procure bundled analytical instrumentation alongside titration systems.
- August 2024: METTLER TOLEDO introduced the EVA Volumetric Karl Fischer titrator for water content determination. The launch expanded options for automated Karl Fischer titration with workflow and safety positioning, supporting continued replacement of manual moisture determination in quality control laboratories.


Research Methodology Framework and Report Scope
Market Definition and Coverage
For this study, the lab titration market is defined as revenue generated from manual and automated titration instruments and systems used inside laboratories to measure concentration or moisture, along with core accessories that are typically sold with these setups.
Scope exclusions: We exclude broader lab analytical instruments that do not perform titration, general glassware not specific to titration workflows, and outsourced testing service revenue.
Segmentation Overview
- By Type
- Manual
- Automated
- By End-User
- Research laboratories
- Academic Institutions
- Other End-Users (Pharmaceutical and Biotechnology Companies and Chemical Manufacturing, Among Others)
- Geography
- North America
- United States
- Canada
- Mexico
- Europe
- Germany
- United Kingdom
- France
- Italy
- Spain
- Rest of Europe
- Asia-Pacific
- China
- Japan
- India
- Australia
- South Korea
- Rest of Asia-Pacific
- Middle East and Africa
- GCC
- South Africa
- Rest of Middle East and Africa
- South America
- Brazil
- Argentina
- Rest of South America
- North America
Data Sources, Market Sizing, and Validation
Desk Research
Desk research started by building a clear product and end-user map for titration used in labs, then checking how demand shows up across industries that run routine chemistry testing. We used public sources such as the US FDA and USP for method references, NIST for measurement standards, OECD and World Bank for macro and industry indicators, and UN Comtrade for trade signals that help explain instrument shipment direction by region.
We also reviewed company annual reports, investor presentations, product catalogs, and reputable press coverage to understand product positioning and typical buying cycles in quality control labs versus research labs. To avoid over-relying on any one source, we cross-checked these findings with paid subscriptions used for company financials and intelligence, news and financials, patent databases, and an import and export shipment-level database where it helped validate movement of instrument categories. These desk research sources are illustrative and not exhaustive, and many other public documents were referenced for data collection, validation, and clarification.
Primary Interviews and Surveys
Primary work was used to pressure-test our assumptions on replacement cycles, price bands, and where automation is actually being adopted fastest, since these points vary by industry and country. We spoke with a mix of instrument suppliers, distributors, lab managers, and method-focused experts across APAC, EMEA, and the Americas, and then used their inputs to confirm the split between manual and automated demand and the pace of new lab additions.
Distribution of primary research fieldwork respondents
| Company type | Respondent position | Region |
|---|---|---|
| Top tier: 28% | CXOs: 14% | APAC: 39% |
| Mid tier: 58% | Functional/Unit leaders: 31% | EMEA: 36% |
| Smaller Players: 14% | Managers: 55% | Americas: 25% |
Market-Sizing & Forecasting
Sizing was built using a top-down and bottom-up approach, where the top-down view first reconstructs the addressable lab demand pool by linking testing intensity to end-user lab footprints, then applying titration adoption by workflow type. In practice, this meant using indicators such as growth in pharmaceutical and biotech QA and QC activity, chemical and food testing throughput trends, lab automation penetration, average replacement cycles for benchtop instruments, and observed pricing bands for manual versus automated systems.
Once global and regional totals were formed, the numbers were corroborated with selective bottom-up checks, such as supplier and distributor channel sense-checks, sampled ASP times estimated unit volumes, and cross-checks against trade movement patterns for relevant instrument categories. When direct unit clues were thin for a smaller country, we handled gaps by anchoring on comparable markets with similar lab intensity and regulatory testing requirements, then adjusting by expert inputs on purchasing behavior.
For forecasting, scenario analysis was used so that adoption of automated titration, pricing progression, and end-user spending cycles could be flexed together without making the model overly complex. Assumptions were aligned to what primary respondents described as realistic over the next few years, then stress-tested against macro signals and sector investment trends.
Data Validation & Update Cycle
Validation was done through several rounds of checks so outputs stayed consistent with real-world demand signals. We compared model results against independent indicators like lab equipment spending direction, import and export patterns for instrument categories, and the stated expansion plans of major end-user industries, then reviewed outliers at country and region level.
If a variance was large, the related inputs were re-opened and targeted re-contacts were triggered to confirm whether the issue came from pricing, adoption, or an unusual procurement cycle. Before sign-off, the work goes through multi-step analyst review so assumptions, conversions, and arithmetic are checked again. Reports are refreshed annually, with interim updates when material events occur, and a final pre-delivery review is completed so clients receive the latest updated view.
Mordor Intelligence's Lab Titration Market Size Versus Other Published Estimates
Published market numbers for lab titration can look far apart, even when the topic sounds similar, because each publisher can change what products are counted and which year is treated as the starting point. The table shows a spread that mainly comes from scope boundaries, price and volume linking assumptions, and how aggressively automation adoption is projected.
The table also points to a common mismatch in what gets bundled with the instrument value. In Mordor Intelligence's model, the market total is tied to manual and automated titration systems used in laboratory settings and related core accessories, and it is reported on a 2026 current-year basis, while some other estimates appear to use a narrower instrument-only definition or a different base-year timing that shifts the headline value.
Benchmark comparison
| Source | Market Size | Gaps in Research Methodology |
|---|---|---|
| Mordor Intelligence | USD 2.07 B (2026) | |
| Trade Journal A | USD 0.51 B (2024) | Often closer to a laboratory titrator instruments-only scope, which can exclude accessories and adjacent titration setups, and it uses an earlier base year that reduces the reported level versus a 2026 current-year view. |
| Industry Tracker B | USD 0.85 B (2024) | Tends to blend titration equipment into broader equipment groupings with simplified ASP assumptions, and it may treat semi-automatic and accessory revenue differently, which shifts totals even if growth rates look similar. |
Across the three figures, the biggest takeaway is that the year used for the headline number and what is counted as titration revenue drive most of the gap, not a disagreement that titration demand is growing. By keeping the inputs traceable to lab activity indicators, replacement cycles, and realistic automation uptake, we arrive at a market value that can be replicated and re-checked when new signals emerge.


Key Questions Answered in the Report
How big is the Lab Titration Market?
The Lab Titration Market size is expected to reach USD 2.07 billion in 2026 and grow at a CAGR of 6.18% to reach USD 2.79 billion by 2031.
What is the current Lab Titration Market size?
In 2026, the Lab Titration Market size is expected to reach USD 2.07 billion.
Who are the key players in Lab Titration Market?
Xylem, ThermoFisher Scientific, Metrohm AG, ECH Scientific and HIRANUMA Co., Ltd are the major companies operating in the Lab Titration Market.
Which is the fastest growing region in Lab Titration Market?
Asia-Pacific is estimated to grow at the highest CAGR over the forecast period (2025-2030).
Which region has the biggest share in Lab Titration Market?
In 2025, the North America accounts for the largest market share in Lab Titration Market.
What years does this Lab Titration Market cover, and what was the market size in 2025?
In 2025, the Lab Titration Market size was estimated at USD 2.07 billion. The report covers the Lab Titration Market historical market size for years: 2019, 2020, 2021, 2022, 2023 and 2024. The report also forecasts the Lab Titration Market size for years: 2026, 2027, 2028, 2029, 2030 and 2031.
Page last updated on:


 Your data is secure and never sold or shared.


